
How Do Americans, and Different Generations, Spend Their Monthly Income?
This post contributed by Mike Brown of LendEDU.
Americans, of all ages and careers, make varying amounts of money and subsequently have monthly budgets that can differ quite drastically.
But, no matter how much a person is bringing home on a monthly basis, setting and sticking to a budget is still important. Without a mapped out monthly expense breakdown, spending habits are more likely to be irresponsible, which can lead to taking on debt.

If a person has student loan debt, then he or she must alot funds for student loan payments. Similarly, a homeowner needs to account for monthly mortgage payments, in addition to costs associated with utilities. There are also necessities to budget for, like groceries and commuting expenses.
And when all of those things are accounted for, what portion of a person’s monthly income will be used for discretionary spending like going out for a nice dinner or throwing a few extra dollars into an investment account?
Interested in painting a picture that depicts the average American’s monthly budget, LendEDU utilized the polling services of Pollfish to survey 1,000 adult Americans on questions related to their respective monthly incomes and how those earnings impact month-to-month financial commitments.
The data was further segmented by generation to see where monthly millennial spending may differ from what baby boomers budget each month. Some of the data found in the LendEDU report reflected to-be-expected trends, like millennials spending the most on student loan payments, but there were some surprises, like millennials committing the largest proportion of their income to investments.
Overall, Americans Spend the Most Per Month on Housing, Living Expenses
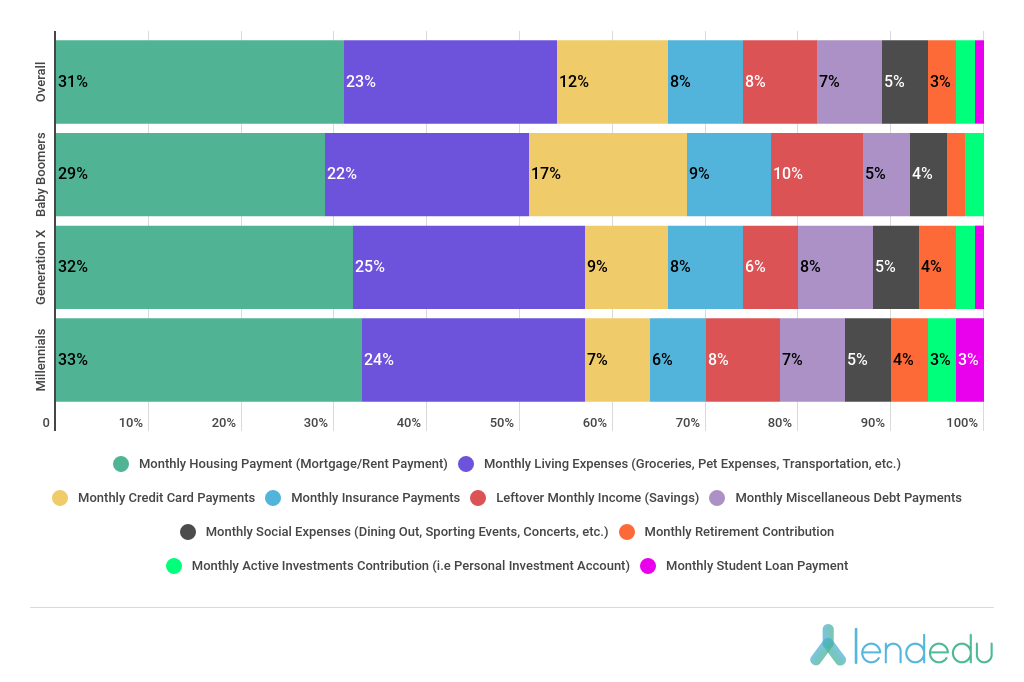
When accounting for answers from all 1,000 adult Americans, the two largest monthly expenses for respondents were housing payments, like a mortgage or rent payment, and living expenses, like bills for groceries, pets, or transportation.
On average, the former accounted for 31% of the average American’s monthly income, while the latter demanded 23% of the average monthly income. For reference, the average monthly income derived from the pool of 1,000 respondents was $6,298.
Rounding out the average American’s monthly budget were credit card payments (12%), insurance payments (8%), miscellaneous debt payments (7%), social expenses (5%), retirement contributions (3%), active investment contributions (2%), and student loan payments (1%).
When all monthly costs have been accounted for, the average adult American had 8% of their monthly income leftover to be saved or used for emergencies.
Let’s see how things changed when the data was broken down by generation.
Millennials Use the Most Income on Student Loan Payments & Investments
With college tuition rates climbing ever steeper and with student loan debt at an all-time high, it was no surprise to see millennials are using the largest proportion of their monthly income for student loan payments.
On average, a millennial is forking over 3% of their monthly income for student loan payments, compared to Generation X only using 1% for the same purpose and baby boomers not having to worry about that debt commitment at all.
For reference, the average monthly income for millennials was $5,750, while it was $6,851 for Generation X, and $6,355 for baby boomers.
One of the bigger surprises from the report pertained to millennials contributing the largest proportion of their income towards investments, perhaps dispelling a common narrative that millennials spend too much on avocado toast and Starbucks frappuccinos and not enough on things like retirement savings or active investments.
Specifically, millennials were contributing 4% of their monthly income to their respective retirement accounts and another 3% towards more active investments, like those made in a Robinhood account. The combined 7% being used for investments outpaced the 6% being allotted by Generation X and the 4% from baby boomers.
The two older generations were both putting 2% towards active investments, while Generation X was using 4% for retirement contributions and baby boomers were contributing 2% for retirement.
On the notion that millennials spend too much on frivolous things, this generation uses 5% of their monthly income for entertainment expenses, compared to baby boomers (4%) and Generation X (5%).
Baby Boomers Have a Serious Credit Card Debt Commitment, Also Pay the Most For Insurance
One of the largest monthly budget discrepancies between the generations pertained to credit card debt, and baby boomers were on the wrong side of it.
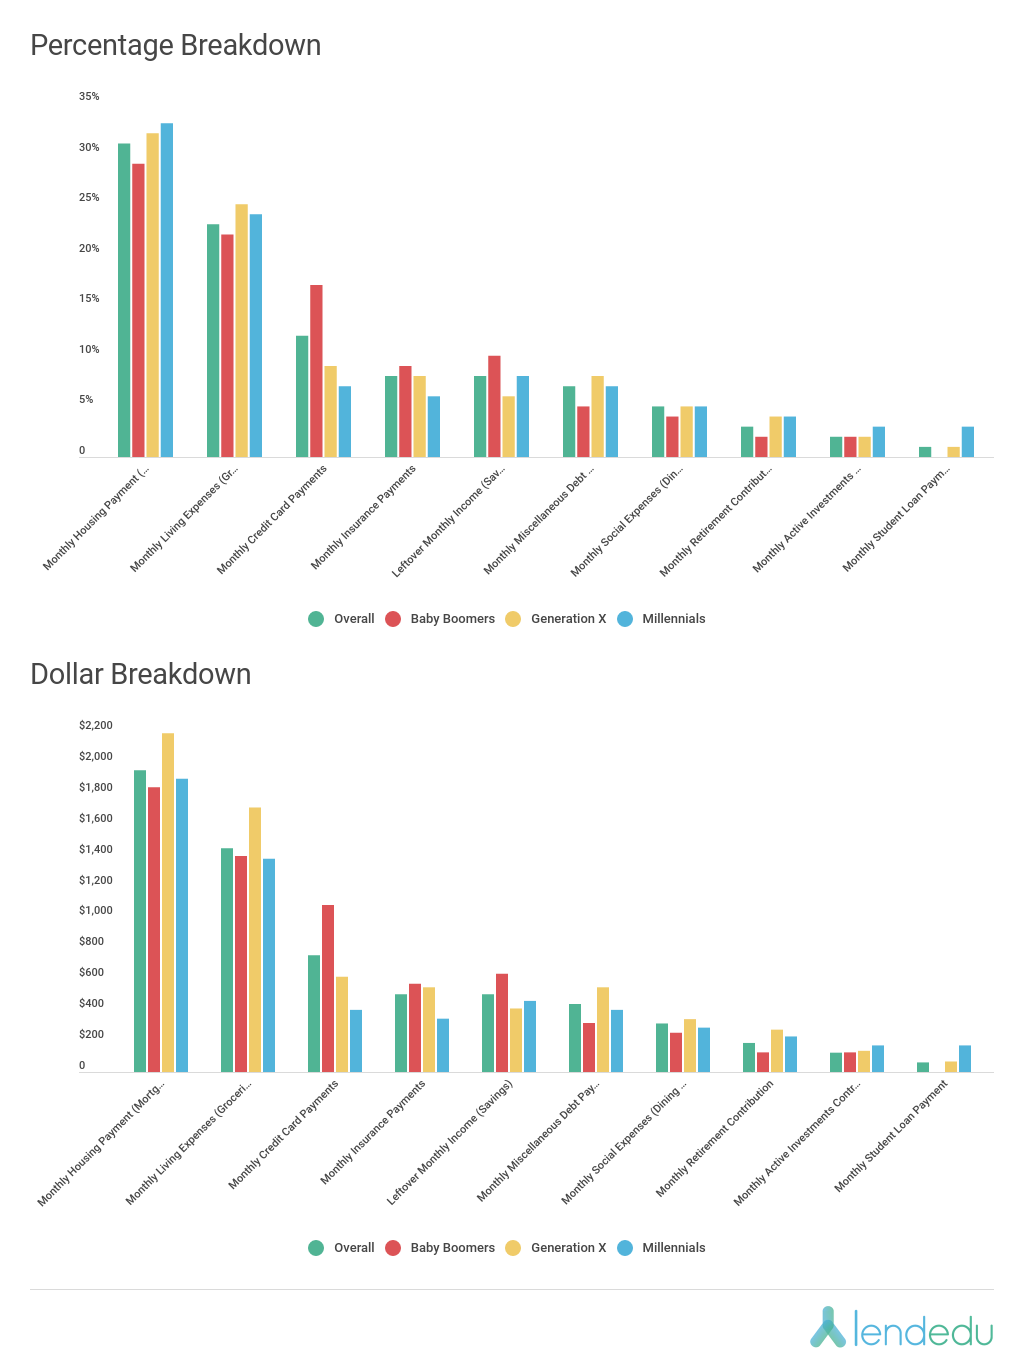
On average, baby boomers were using 17% of their monthly income to make payments on credit card bills; comparatively, millennials were using 7% of their income for the same reason, while members of Generation X were using 9%.
Interestingly, baby boomers also had the steepest month-to-month commitment for overall debt. Between monthly payments for credit cards, student loans, and other forms of debt, baby boomers were using 22% of their monthly income, while millennials were using 17% and Generation X was using 18%.
In a less surprising outcome, insurance payments each month were proportionally the largest for baby boomers, accounting for 9% of their monthly income. This number was slightly smaller for those in Generation X (8%), and even tinier for millennials (6%).
Since baby boomers are older than Generation Xers and millennials, they are inclined to more health issues associated with that age. As the biggest health risks, boomers will receive the least favorable life insurance policies that will cost considerably more compared to policies provided to younger, healthier consumers.
Using Pollfish, LendEDU has gathered original data helpful to understanding consumers, developing insightful reports, and offering the right solutions to their customer base. Want great data of your own? Create an account and get started.