9 Best Conjoint Analysis Software in 2026 (In-Depth Look)

In this post, we review the best conjoint analysis software platforms on the market.
To start, we’ll discuss our product, Pollfish. We offer robust conjoint survey design tools and powerful built-in analytics that save you significant time and reduce reliance on external tools.
Then, we’ll discuss other conjoint analysis software to help you make a well-informed decision.
Note that there is no such thing as a truly free conjoint analysis software. Most of the tools on this list (including our own) offer free plans for when you survey your own audience. However, if you want access to audience panels or more advanced features, payment is typically required.
Best Conjoint Analysis Software
1. Pollfish
In this section, we’ll discuss:
- Step-by-step overview of how to build conjoint analysis surveys with Pollfish. You’ll discover two key advantages:
- Pollfish’s advanced platform handles even the most sophisticated conjoint analysis requirements, letting you design surveys that exactly match your research needs
- Our platform is designed for ease of use, so you can jump right in and start building conjoint analysis surveys without a steep learning curve.
- How to analyze conjoint analysis results directly within Pollfish with no external tools needed. Specifically, we’ll show you how to create these essential charts with just a few clicks:
- Attribute Relative Importance Graph
- Level Utilities
- Distribution of Level Preferences Graph
- Ranked List of Product Alternatives, and more (these are just a few of the key examples we’ll cover)
- Additional key reasons to choose Pollfish for your conjoint analysis survey needs, including:
- High-quality audiences with rigorous data quality standards
- Transparent pay-per-response pricing that scales with your needs
- Fast turnaround time from a few hours to a few days
- Complimentary support from market research experts
- Intuitive and easy to use, with a minimal learning curve
- Full-service option where we’ll handle your conjoint analysis survey needs from start to finish
Let’s dive in.
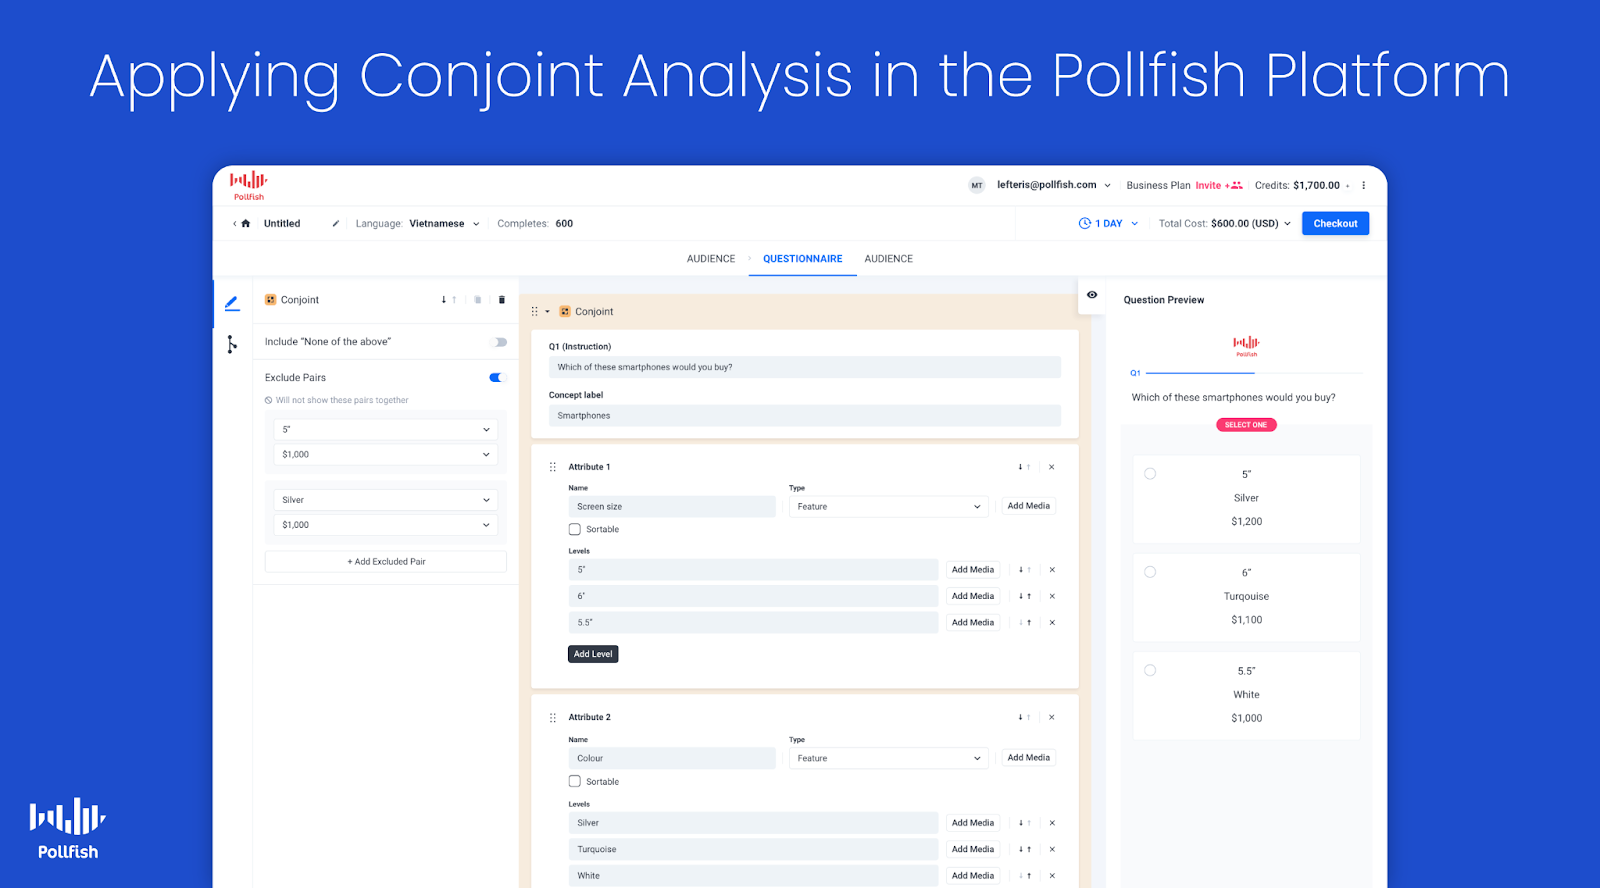
How to Build a Conjoint Analysis Survey in Pollfish
Here’s a brief, step-by-step overview of how you can create a conjoint analysis survey with Pollfish. For a more in-depth explanation of each step, see this article.
❇️ Step 1: Open the Pollfish dashboard and hit “Create a new survey”
❇️ Step 2: Add the conjoint method to your survey

Select the Conjoint option from the question type options.
❇️ Step 3: Add the instructions
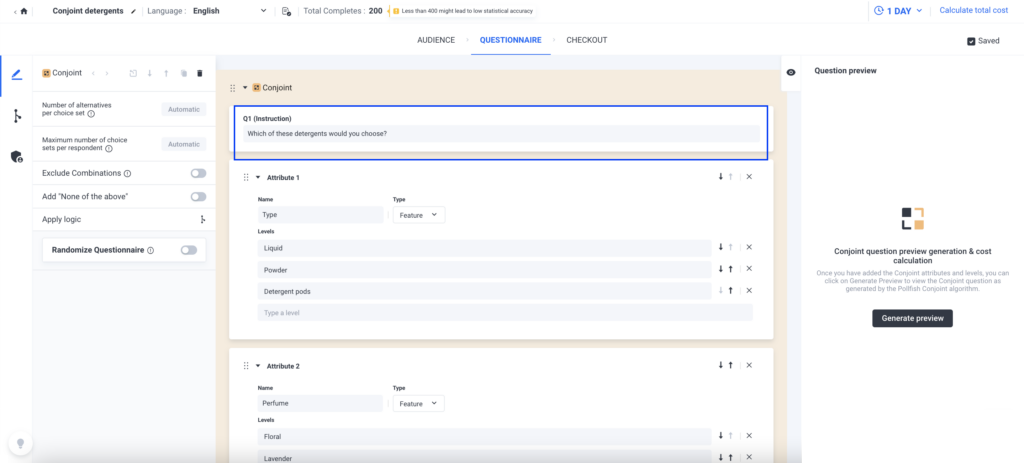
Provide instructions on how to respond to the question text. Conjoint is presented as a repeated single selection question with different sets of product alternatives each time.
❇️ Step 4: Add product attributes and levels
Attributes are a product’s characteristics, such as shape, color, scent, etc.
Levels are the values that each attribute can have, such as lavender scent, lemongrass scent, etc.

You can specify price as an Attribute or Level.
❇️ Step 5: Heed the following restrictions and advice on attributes and levels
- A conjoint experiment should have at least 2 attributes
- Each attribute should have at least 2 levels
- Use a maximum of 6-7 attributes. Any more, and respondents may struggle to evaluate all the different options
❇️ Step 6: Prohibit particular level pairs
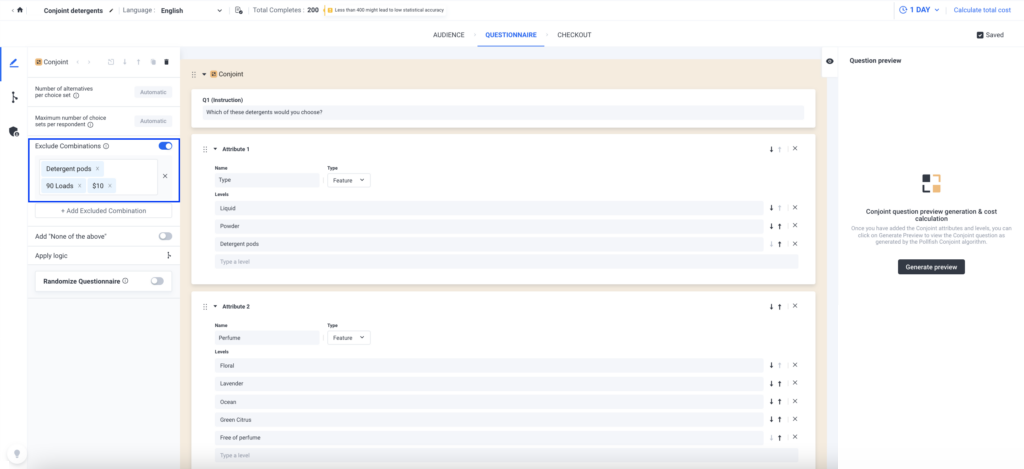
By default, all attribute levels have an equal likelihood of displaying together. This can lead to unrealistic product alternatives, such as a product with all the best features at the lowest price.
In order to prohibit such alternatives, you can use the “exclude combinations” setting.
❇️ Step 7: Optionally enable none of the above
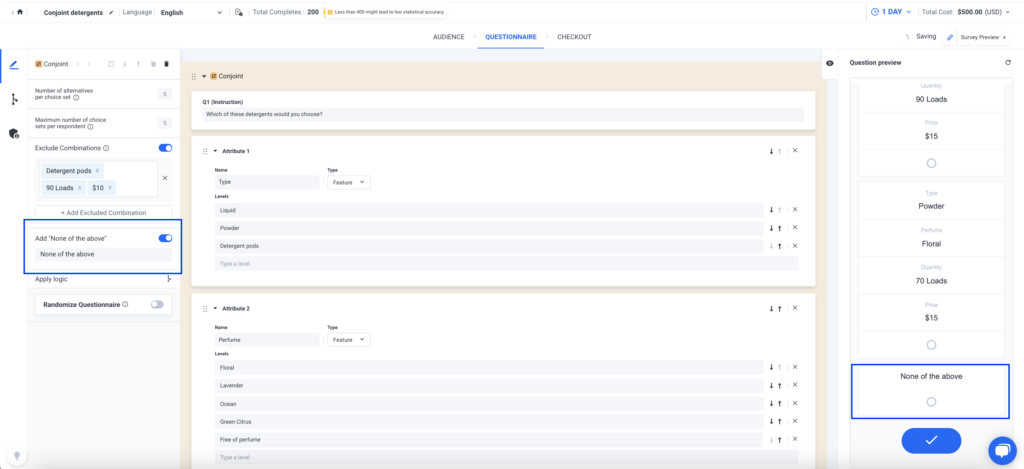
The “none of the above” option is disabled by default. You can opt to enable it, which will make it visible on mobile every time a respondent views a choice set of alternatives.
❇️ Step 8: Access the preview
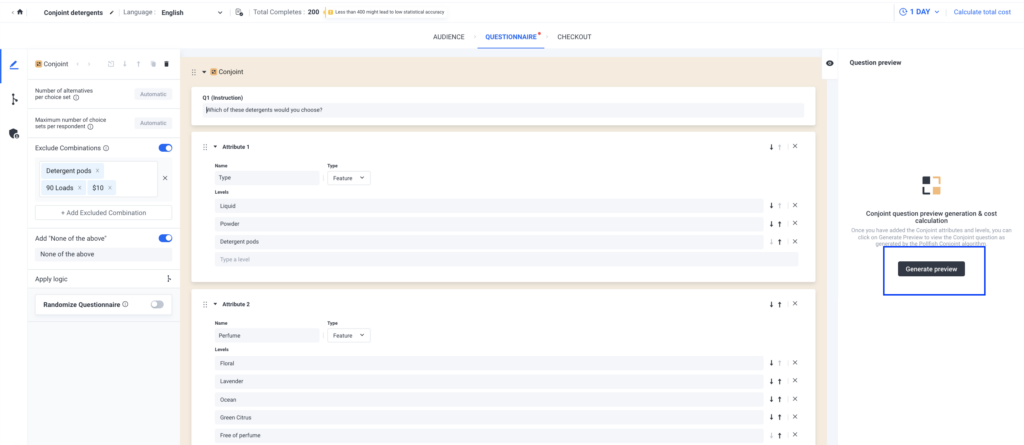
To preview a survey with a Conjoint question, click the “Generate preview” button in the questionnaire tab. This runs the Conjoint Design of Experiments algorithm to display the actual question respondents will see, along with an updated survey flow, cost, and design details. Any time attributes, levels, or exclusions change, you need to regenerate the preview to reflect the updates.
How to Analyze Conjoint Analysis Results Within Pollfish
With most conjoint analysis software, you have to export your results and spend a lot of time and energy in external tools creating filters and custom charts.
In contrast, with Pollfish, you can easily create custom branded charts directly within our platform with just a few clicks, eliminating the need for external tools and saving time and effort.
Below, we cover a few examples of charts you can generate to analyze conjoint analysis survey results. Of course, these are just a few examples — you can create other types of charts, as well.
❇️ The Attribute Relative Importance Graph
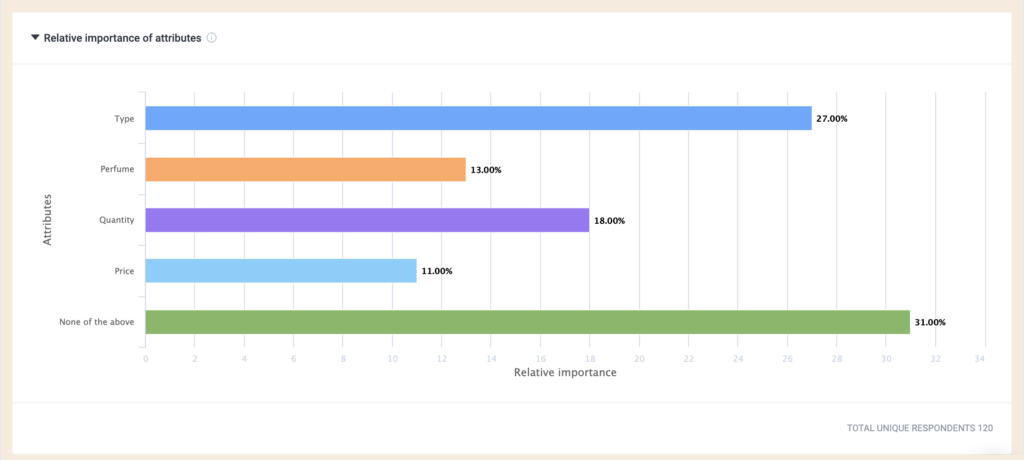
This graph shows how much influence each attribute has on respondents’ choices, with higher percentages indicating a stronger impact. It highlights which attributes matter most compared to others and reflects only the specific levels included in the survey design.
❇️ Level Utilities
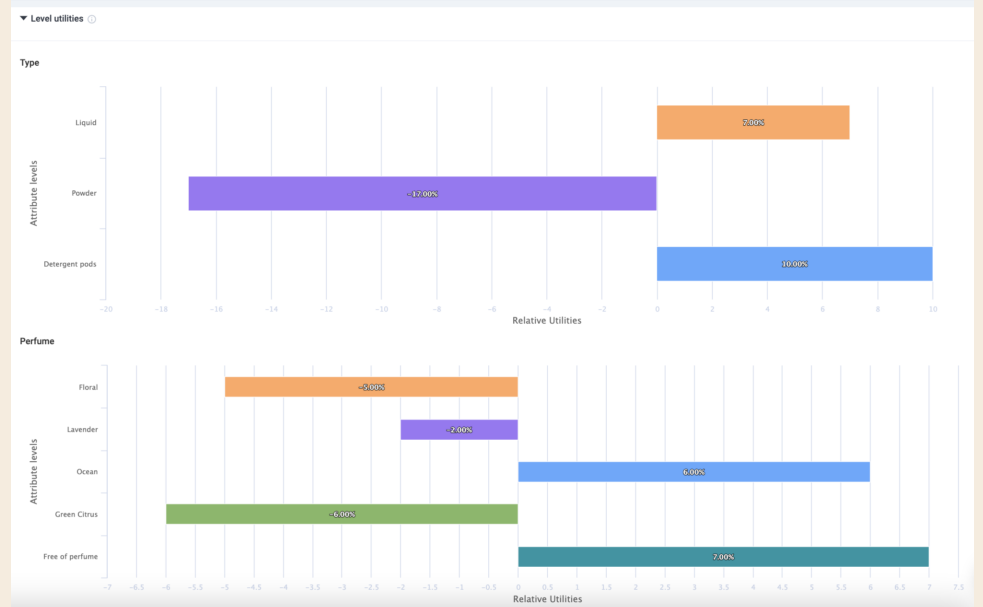
This view breaks down how individual levels within an attribute influence customer choice. It shows preference scores for each level, with higher percentages indicating a stronger impact on respondents’ decisions.
❇️ Distribution of Level Preferences Graph

This visualization shows the likelihood of one level being chosen over another when all other attributes are held constant. Higher percentages indicate stronger respondent preference for that level within the attribute.
❇️ Willingness to Pay
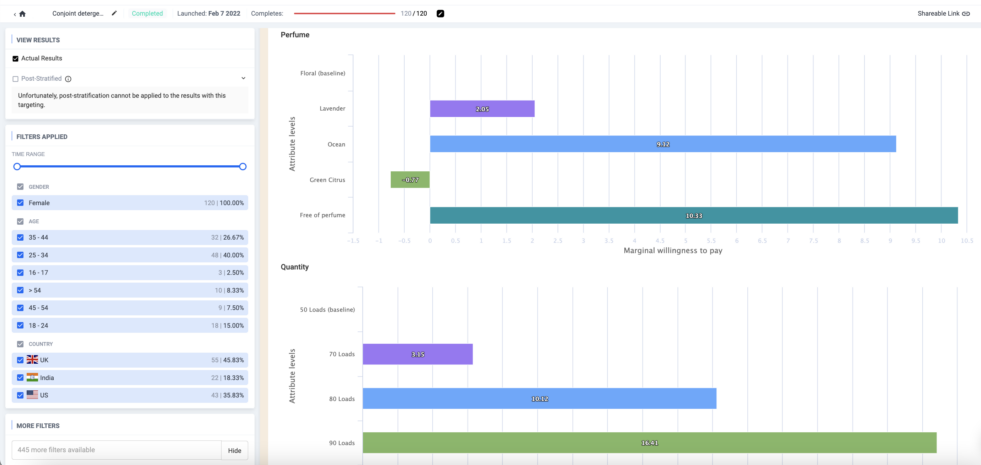
Willingness to pay measures the maximum amount customers are willing to pay to move from one level of an attribute to another. Displayed as monetary values in a chart, it helps compare upgrades or downgrades between levels, but is only available in Conjoint surveys with a Price attribute. By changing the baseline level, you can see how preferences shift and what respondents value more or less.
❇️ Ranked List of Product Alternatives
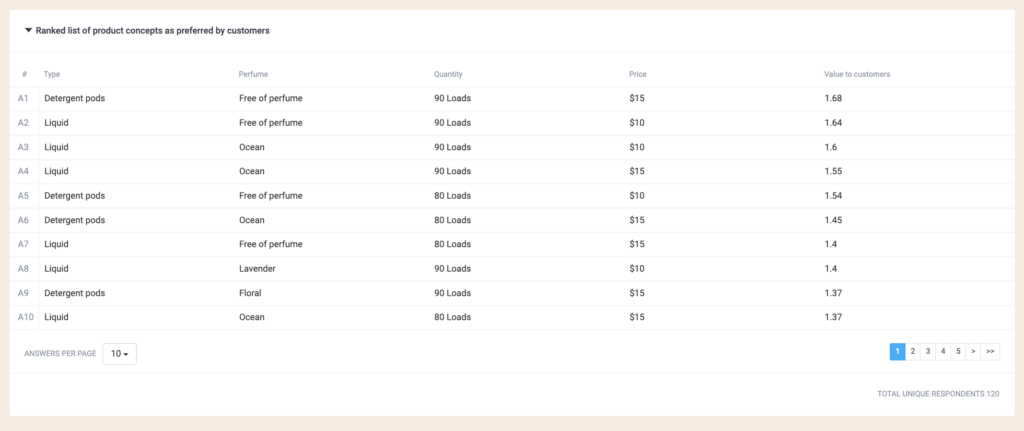
This table ranks product alternatives based on respondent preferences, with the top options being the most favored. Results can be filtered by demographic criteria, and the charts will recalculate accordingly, provided there are enough responses to ensure reliability.
❇️ Additional Chart Creation & Reporting Options
Beyond the visualizations above, there are also other types of advanced charts you can generate in just a few clicks for both conjoint analysis surveys and other types of surveys.
Another customer favorite feature is the ability to create presentations directly within Pollfish and export them as a PowerPoint file. For example, you can customize any of the earlier conjoint analysis visualizations above by adding your brand’s colors directly within Pollfish. Then add them to your presentation in just one click, saving time and helping you share survey results in a more streamlined way.
Note that while we designed Pollfish to help you create and analyze charts directly within the platform, we also offer flexible export options (including PDF, Excel, crosstabs, SPSS, and more) so you can analyze results externally as desired.
Beyond the functionalities mentioned above, Pollfish also offers other key advantages, including:
- High audience data quality
- Transparent pay-per-response pricing
- Fast turnaround time
- Quality customer support
- Ease of use and intuitiveness
We’ll briefly cover each of these below and share quotes from customers.
High-Quality Audiences with Rigorous Data Quality Standards
Data quality is especially critical in conjoint analysis, where flawed responses can distort how attributes and levels are valued. To learn more about common data quality issues (and how Pollfish fixes them), see this article.
Pollfish utilizes our parent company Prodege’s first-party respondent communities, applying strict quality controls like verified purchase behavior, respondent trust scores, manual review of open-ended answers, sophisticated fraud prevention technology, and more. This ensures that results truly reflect consumer preferences and provide a solid foundation for product and pricing decisions.
As several of our customers shared on Trustpilot:
“The most important point to make is that I trust the responses of my survey. My target audience was very specific and I could tell that the responses were legitimately coming [from] subjects in my target audience.”
“Each time I use this service I am blown away by the speed with which the responses come in and with the detail which most of them include. You can tell that the respondents take this very seriously. They must really enjoy doing it.”
Transparent Pay-per-Response Pricing That Scales with Your Needs
Pollfish uses a transparent pay-per-response pricing model, starting at $0.95 per response.
Costs update in real time as you add targeting filters, so you always see the exact price per response and total survey cost upfront. This ensures clear, predictable budgeting for conjoint analysis and other survey needs.
As one customer shared on Trustpilot:
“The dollar amount they quote you in their cost calculator tool, and the number they show when you’re developing the survey, is the number you pay. I was burned multiple times by SurveyMonkey charging me unexpected amounts and making it difficult to quit an expensive subscription. I’m so happy to have found Pollfish as an alternative. Their support team also responds VERY quickly to chat messages and has been tremendously helpful the few times I had questions.”
– Read the full review here
Fast Turnaround Time from a Few Hours to a Few Days
Because Pollfish leverages Prodege’s first-party audience data, we can deliver conjoint analysis survey results much faster than platforms relying on third-party sources.
Broad population samples (e.g., U.S. adults aged 18–65) can be completed within hours, while highly specific audiences (e.g., households with two children, income over $250,000, living in Phoenix) are typically fulfilled within a few days.
As multiple reviewers noted:
“The thing that amazes me most is how quickly you can get your data results back. So fast! Usually in a couple of hours.”
– Read the full review here
“Much more affordable than all the alternatives I found, and I had all my results ready within just a couple of hours.”
– Read the full review here
“I’m amazed at how quickly the platform was able to deliver rich, segmentable data from over 500 respondents. I had feature-ready insights in only 3 days.”
For turnaround estimates for your specific conjoint analysis survey, contact us here, or submit your question via live chat.
Complimentary Advanced Support from Conjoint Analysis Research Experts
Designing a conjoint analysis survey can be complex, which is why Pollfish offers complimentary 24/7 support from seasoned market research professionals.
We can help with proper survey design, targeting, data analysis, and more, whether you’re new to conjoint analysis or an experienced researcher seeking a second pair of eyes.
As several customers shared:
“The customer support agents were awesome. They responded to every question I had in a timely manner. (And before we even paid a cent!)”
– Read the full review here
“The customer service team is super responsive too for those more complex enquiries about the tool and criteria. All in all this experience has been way easier (and cheaper) than any other ‘big players’ out there”.
– Read the full review here
Intuitive and Easy to Use
Pollfish’s user-friendly, step-by-step survey builder is highly intuitive and simple to use. You can start from scratch or use templates, set precise audience qualifications with demographics and screeners, and easily add conjoint analysis questions alongside other formats.
As one of our customers noted on Capterra:
“Pollfish is probably the single easiest software I’ve ever used. The drag and drop builder is great itself, but the template library also has anything we ever need, so you rarely have to design anything from scratch. The templates are also designed very well, we usually pick one, do a couple edits, and deploy. The whole thing takes less than 10 minutes.”
DIY vs. Full-Service Options to Meet Your Specific Conjoint Analysis Needs
Whether you prefer to build surveys on your own or want to hand off the work to an expert team, Pollfish gives you the choice of a DIY or full-service option.
❇️ DIY Option: You can manage every step of building a conjoint analysis survey on your own with our intuitive platform. It’s easy to use, but our team is always available to offer complimentary expert support if you need help along the way.
❇️ Full-Service Option: If you’re short on time or want added expertise, our dedicated research team can run the entire project for you from survey design to final analysis and reporting.
You can learn more about our market research services here.
Get Started with Pollfish
Ready to start building your conjoint analysis survey? Pollfish makes it easy to get started.
You have three flexible options:
- Create a free account: Explore our platform and start building conjoint analysis surveys at your own pace. No credit card required.
- Schedule a demo walkthrough: Get a guided walkthrough tailored to your goals.
- Inquire about full-service brand research offering: Prefer a hands-off approach? As stated, our in-house research team can take care of the entire process from designing your survey and selecting the right audience to analyzing the data and delivering a final report tailored to your goals.
2. Conjointly
Conjointly is a survey platform with tools such as conjoint, MaxDiff, Gabor-Granger, Van Westendorp, brand-price trade-off, etc. It offers a range of conjoint analysis options, including Generic Conjoint, Brand-Specific Conjoint, SaaS-specific feature/pricing conjoint, TURF, and BPTO.
Key product features include:
- Automated translations and multi-country research projects
- Built-in panels with millions of respondents
- Manual and automated quality checks
- Exports to PowerPoint and Excel
- Support from experienced researchers for custom or self-serve projects
3. Qualtrics

Qualtrics is an enterprise customer experience platform that includes conjoint analysis for product optimization and pricing.
Key features include:
- Intuitive simulator for feature/price tradeoffs and competitor benchmarking
- Step-by-step guided study setup, no advanced research degree required
- Conjoint Dynamic Images (image-based attributes instead of text)
- Automated modeling and optimization that finds the best product configuration and price
- Integrated with larger CX platform for segmentation and customer experience analytics
4. Sawtooth
Sawtooth is a conjoint analysis platform offering design options like Adaptive Conjoint, alternative-specific designs, dual-response None, and custom HTML/CSS. It’s widely used by academics and practitioners for flexible, highly customizable conjoint studies and robust market simulations.
Key features include:
- Advanced conjoint design options, such as Adaptive Conjoint, alternative-specific designs, dual-response None, advanced prohibitions, custom HTML/CSS
- Market simulator to predict market share and run sensitivity analysis
- Simulation Insights Recommendation Engine for fast, actionable insights
- Extremely flexible and customizable designs (free-format, conditional graphics/prices)
- Dedicated customer support, conferences, and training
5. OpinionX
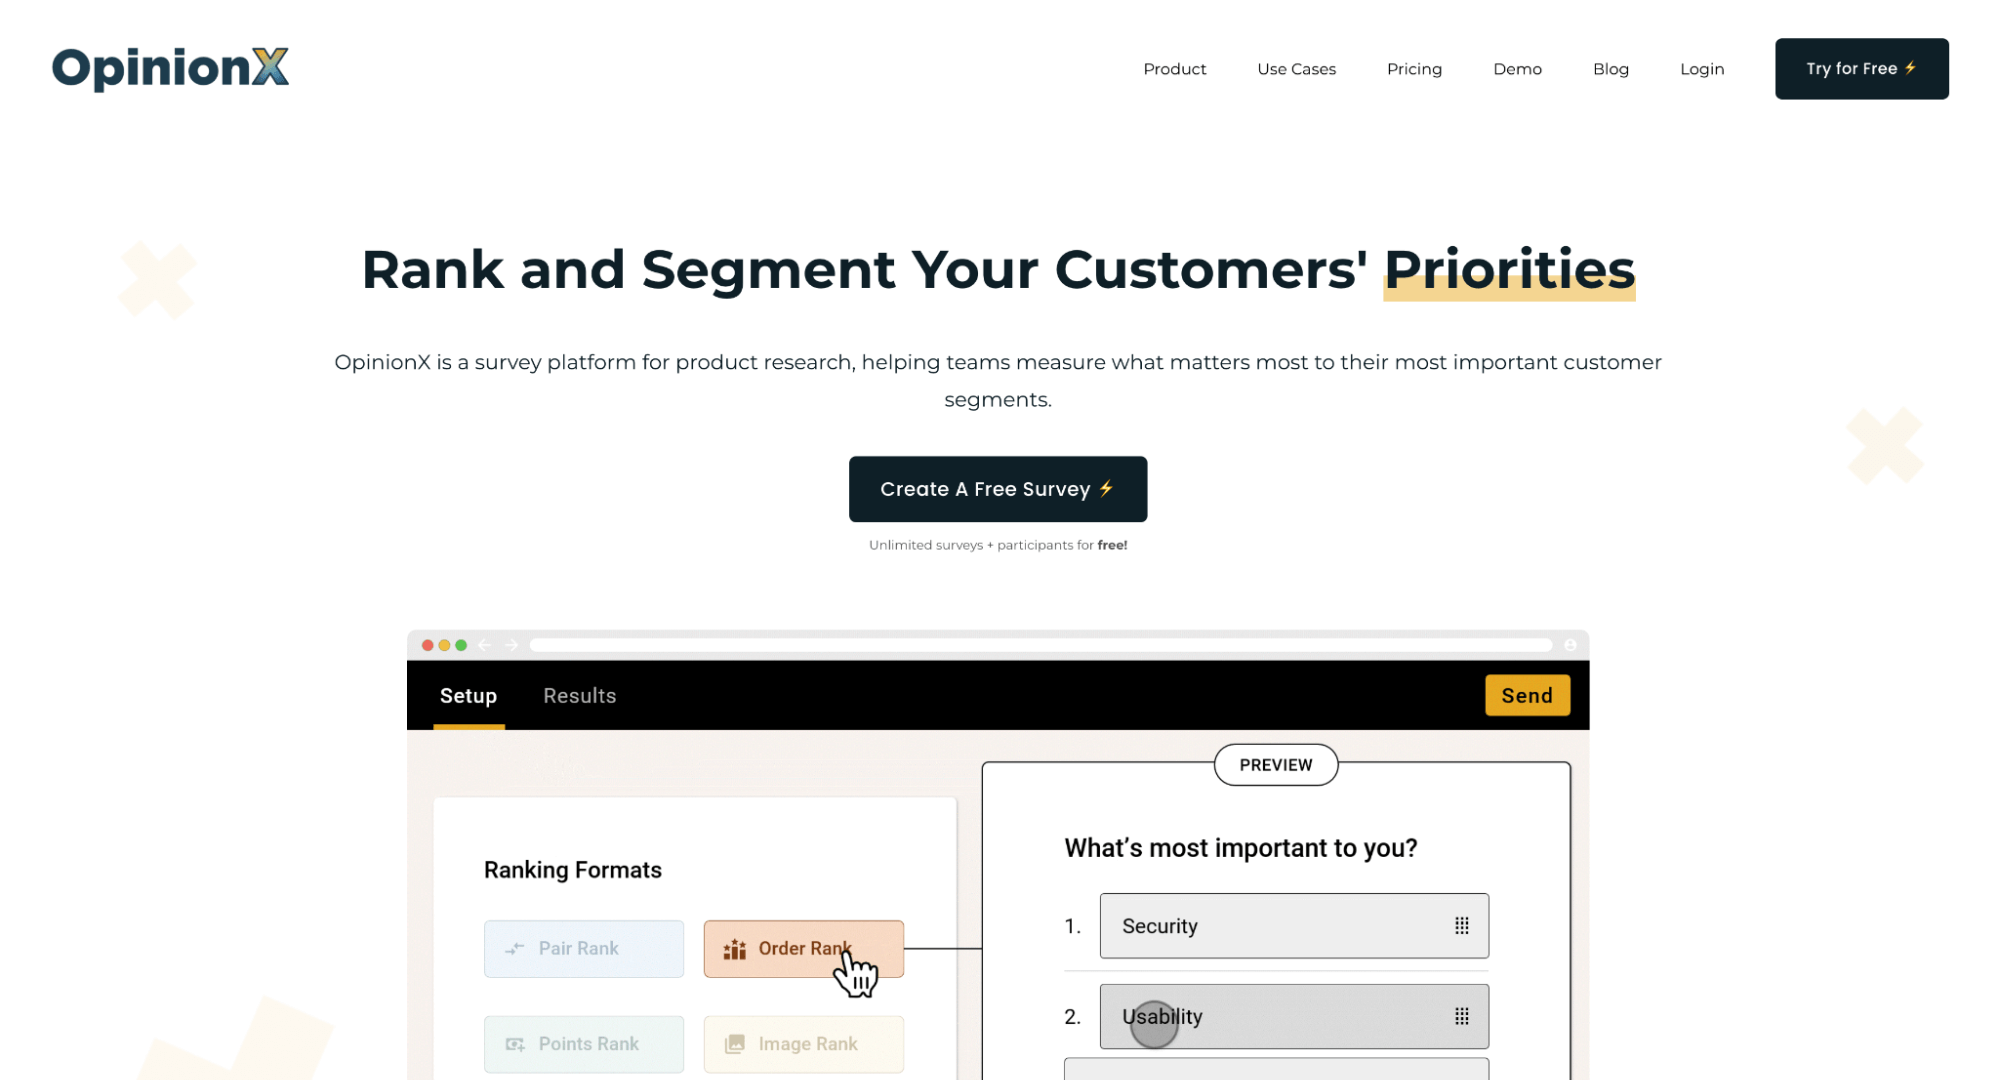
OpinionX is a conjoint survey tool that offers a number of reporting formats, including preference charts, ranked concepts, scenario simulator, marginal willingness to pay, crosstabs, clustering, and more.
Key product features include:
- Easy setup similar to Google Forms, integrates conjoint sections
- Machine learning automatically calculates preference scores in real time
- Subgroup filtering with a single click
- Special focus on engaging your own audience (CRM/HR data enrichment)
- Prohibited pairs exclusions engine
- Optimized for mobile
- Integrity checks to prevent spam responses
6. XLSTAT

XLSTAT is a statistical add-on for Microsoft Excel that includes full-profile conjoint analysis based on ratings or rankings. It outputs partial utilities, importance scores, and individual-level results, making it accessible for analysts who prefer working directly in Excel.
Key features include:
- Advanced statistical research methods: OLS-based ANOVA, MONANOVA
- Classification of individuals via k-means or hierarchical clustering
- No coding required
- Customizable Excel charts and reporting
7. 1000minds
1000minds is a decision-making and conjoint analysis platform built on its patented PAPRIKA method, which presents trade-offs one question at a time for accurate results. It is widely used in healthcare, government, and academia for transparent, fair, and inclusive decision-making.
Key features include:
- Emphasis on engagement, fairness, and inclusivity in tradeoff decisions
- Step-by-step model building (create, tailor, run, results)
- Transparent, auditable results, making it strong in ethics/governance applications
8. Q Research Software
Q Research Software is an analysis platform designed for market researchers, with conjoint analysis streamlined into a single interface. Its conjoint analysis features include efficient/partial profile designs, prohibitions, and randomized designs.
Other notable features include:
- Models supported: HB, latent class, multinomial logit, multi-class HB
- Interactive conjoint simulators
- Automates “grunt work” such as cleaning, stat testing, updating analyses, and reporting
- Integration with PowerPoint/Displayr for reporting
- Designed to democratize advanced analysis, so even beginners can design MaxDiff/conjoint with built-in warnings
9. Survey Monkey
SurveyMonkey is a survey platform that offers conjoint analysis alongside its broader research tools.
Key features include:
- Supports Choice-based conjoint (CBC) and Adaptive Conjoint Analysis (ACA)
- Simplified setup and guided process for non-researchers
- Strong integration with global panel
- AI-assisted survey creation and analysis
- Wide applications, including product dev, pricing strategy, R&D, and branding
- Option to outsource to SurveyMonkey research experts
Sign Up for a Free Pollfish Account
Create your free Pollfish account today (no credit card required, no commitments) and get started building a conjoint analysis survey with transparent pricing and high-quality data.