MaxDiff Analysis Guide: Benefits, How it Works, Use Cases
When businesses ask customers what matters to them the most, they rarely get a useful answer. Standard rating scales invite agreement bias, where respondents rate nearly every feature a 4 or 5 out of 5. But when everything is important, nothing is, and decision-makers are left with data that tells them little about what customers actually prioritize.
MaxDiff analysis was built to solve this problem. Rather than asking people to rate items in isolation, it presents a series of trade-off choices that mirror how decisions are actually made in the real world. The result is a precise ranked picture of customer priorities that you can base business decisions on.
At Pollfish, we’ve guided many companies through MaxDiff studies, both through our DIY survey platform and our full-service offering, fulfilled through our parent company Prodege. In this guide, we’ll answer common questions we’ve gotten through the years.
We’ll cover the following topics:
- What is MaxDiff analysis?
- How MaxDiff analysis works
- Benefits of MaxDiff analysis
- Use cases for MaxDiff analysis
- How MaxDiff analysis compares to other survey methods
- Our MaxDiff analysis offerings: full-service and DIY options
- How to run a MaxDiff analysis with Pollfish, our DIY survey platform
- How to analyze MaxDiff analysis results in Pollfish
- Benefits of Pollfish, backed by customer quotes
Note: Sign up for a free Pollfish account to launch your first MaxDiff analysis survey (no credit card required). If you prefer a more hands-off approach, inquire about our full-service research offering, where we handle everything from survey design to analysis and reporting.
What Is MaxDiff Analysis?
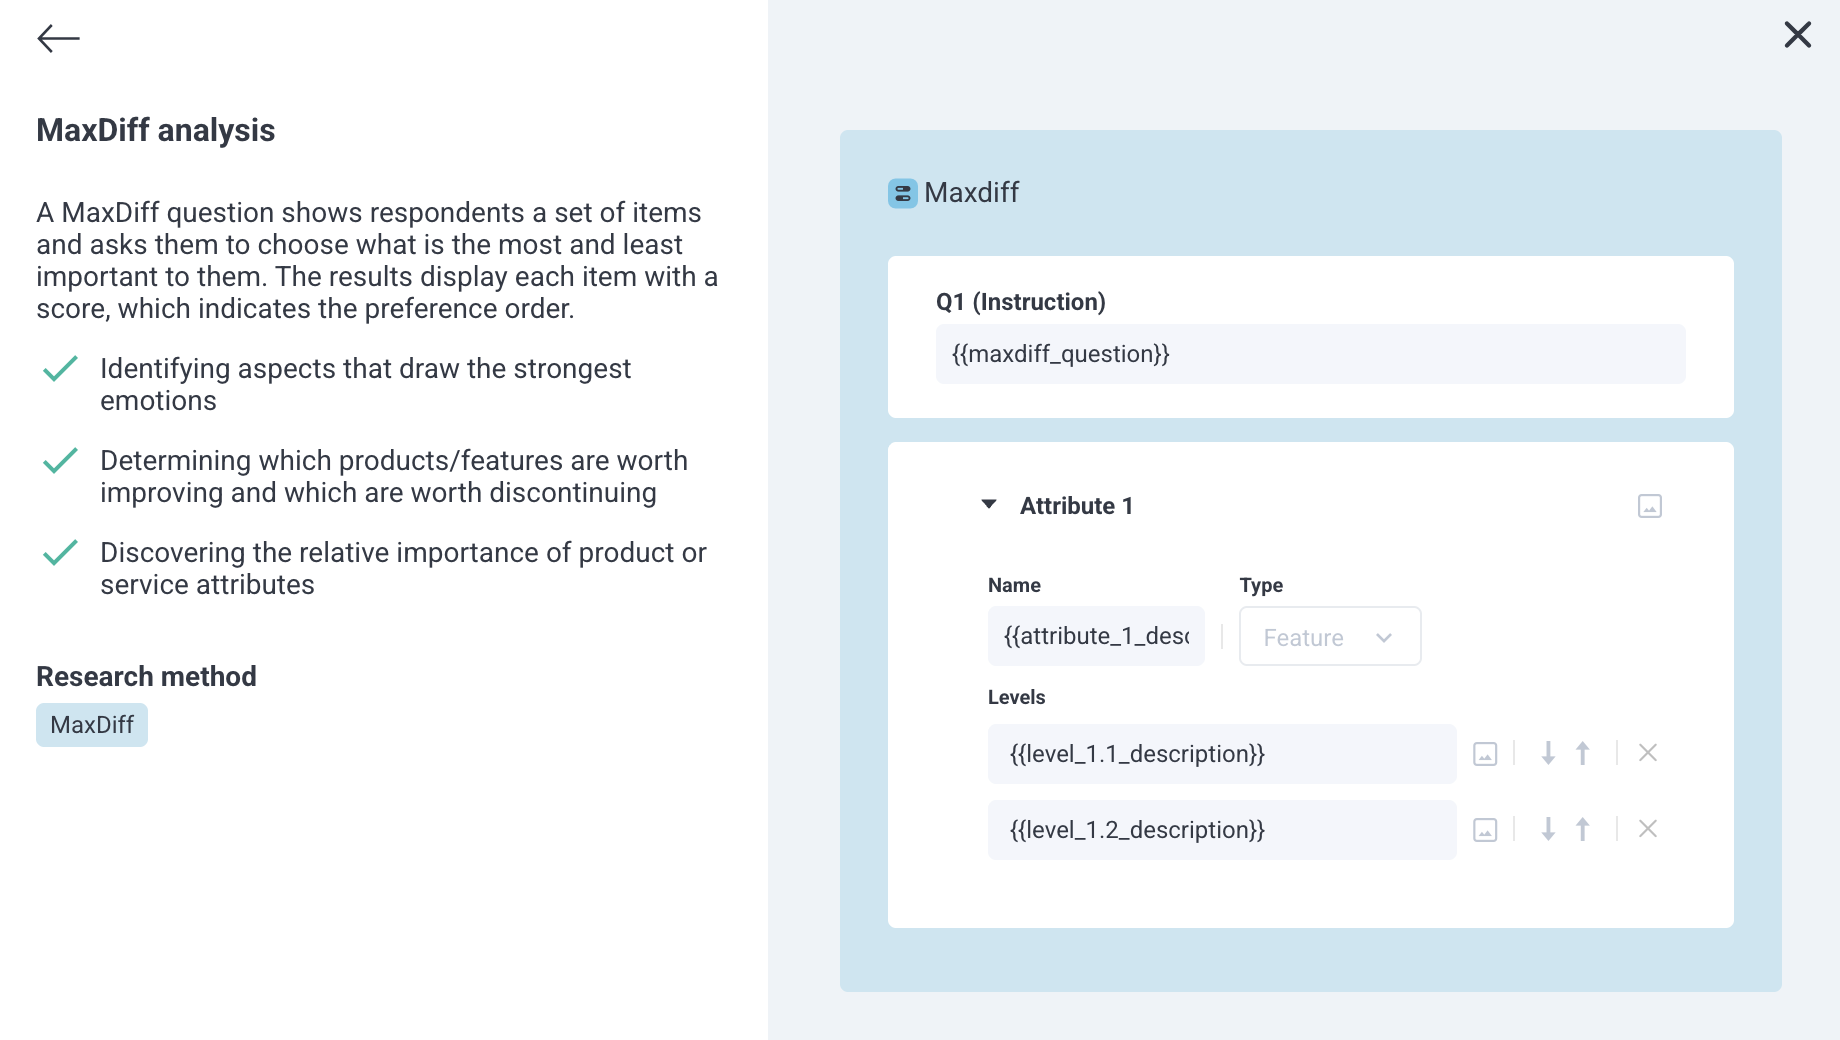
MaxDiff analysis (also known as Best-Worst Scaling or Maximum Difference Scaling) is a survey methodology used to identify which items in a list people value most and least and by how much.
What makes this approach powerful: Like the real world, MaxDiff analysis forces trade-offs. Rather than rating items in isolation, respondents repeatedly choose a single best and a single worst item from small sets of options. Since they can’t rate everything highly, their true priorities emerge.
By analyzing the patterns of choices across all respondents, the methodology produces preference scores that show:
- Which items rank highest
- How much more important they are relative to everything else on the list
The result: A clear, data-driven picture of what customers actually care about.
How MaxDiff Analysis Works
Instead of asking respondents to rate a long list of items, MaxDiff shows them a small set at a time (typically 4 to 6 items) and asks just two questions:
- Which option is most important to you?
- Which is least important?
This is repeated across multiple rounds (usually 12 to 16 questions), each showing a different combination of items.
The responses are then run through a statistical model (typically Hierarchical Bayes estimation) that analyzes choice patterns across all respondents.
The output is a set of preference scores showing not just which items ranked highest, but by how much. You can see, for instance, that feature A outranked feature B, and that the gap between them was significant.
Example: Here’s what a single MaxDiff question might look like:
From the list below, which attribute is MOST important to you when choosing a smartphone, and which is LEAST important?
- Camera quality
- Battery life
- Screen size
- Design aesthetics
- Price
The resulting utility scores give each item a number reflecting the relative strength of preference across all respondents, making it easy to compare and prioritize.
Benefits of MaxDiff Analysis
Here’s what MaxDiff analysis does particularly well:
✅ Solves the “everything is important” problem.
When customers rate a list of items on a scale, most items end up scoring high. MaxDiff eliminates this by forcing trade-offs, so the data actually differentiates between priorities instead of flattening them.
✅ Tells you not just what ranks highest, but by how much.
The preference scores MaxDiff produces are quantified, meaning you can see the relative distance between items. For example, knowing that battery life is the top priority is useful, but it’s even more actionable to know it scores three times higher than screen size.
✅ Supports confident decision-making.
Whether you’re deciding which product features to build, which improvements to invest in, or which messages to lead with, MaxDiff replaces guesswork with a ranked, quantified picture of what customers actually value.
✅ Offers a better experience for respondents.
Choosing a best and worst from a small set of options is intuitive and low-effort. This keeps respondents engaged and produces more reliable data than asking people to rank a long list all at once.
✅ Avoids personal bias.
Rating scales can be interpreted differently depending on respondents’ personalities. Some respondents tend to avoid extreme scores, others gravitate toward them. Because MaxDiff is based on simple comparative choices rather than numerical ratings, it produces cleaner and consistent data.
Use Cases for MaxDiff Analysis
Some of the most common applications for MaxDiff analysis include:
✅ Prioritizing features during product development.
MaxDiff analysis helps determine which features customers will actually care about most. Rather than relying on internal assumptions or inconclusive survey data, teams get a clear ranking of what would drive the most interest and justify investment.
✅ Prioritizing improvements to make to services.
Organizations looking to improve customer experience often face the same dilemma: a long list of potential improvements and limited resources to act on all of them. MaxDiff identifies where changes will have the most meaningful impact on customer satisfaction and loyalty.
✅ Launching new products or menu items.
For retailers, CPG companies, and other types of businesses, launching new products carries real risk. MaxDiff analysis can assess the relative importance of potential additions before anything goes to market, helping teams focus on the options most likely to resonate with their audience.
How MaxDiff Analysis Compares to Other Survey Methods
Let’s take a look at how MaxDiff analysis compares to other common survey and research methods.
✅ Standard rating scales vs. MaxDiff analysis
Standard rating scales is a common survey format that asks respondents to rate each item on a scale of 1 to 5 or 1 to 7 and tallies the results. The problem is that rating scales tend to produce undifferentiated data. When people can rate everything highly, they often do. This can make it difficult to draw clear conclusions about what actually matters most.
Rating scales have their place for gauging general opinion or satisfaction, but they’re a poor fit when the goal is meaningful prioritization. MaxDiff analysis forces trade-offs, ensuring the data reflects genuine customer preferences rather than the tendency to rate everything highly.
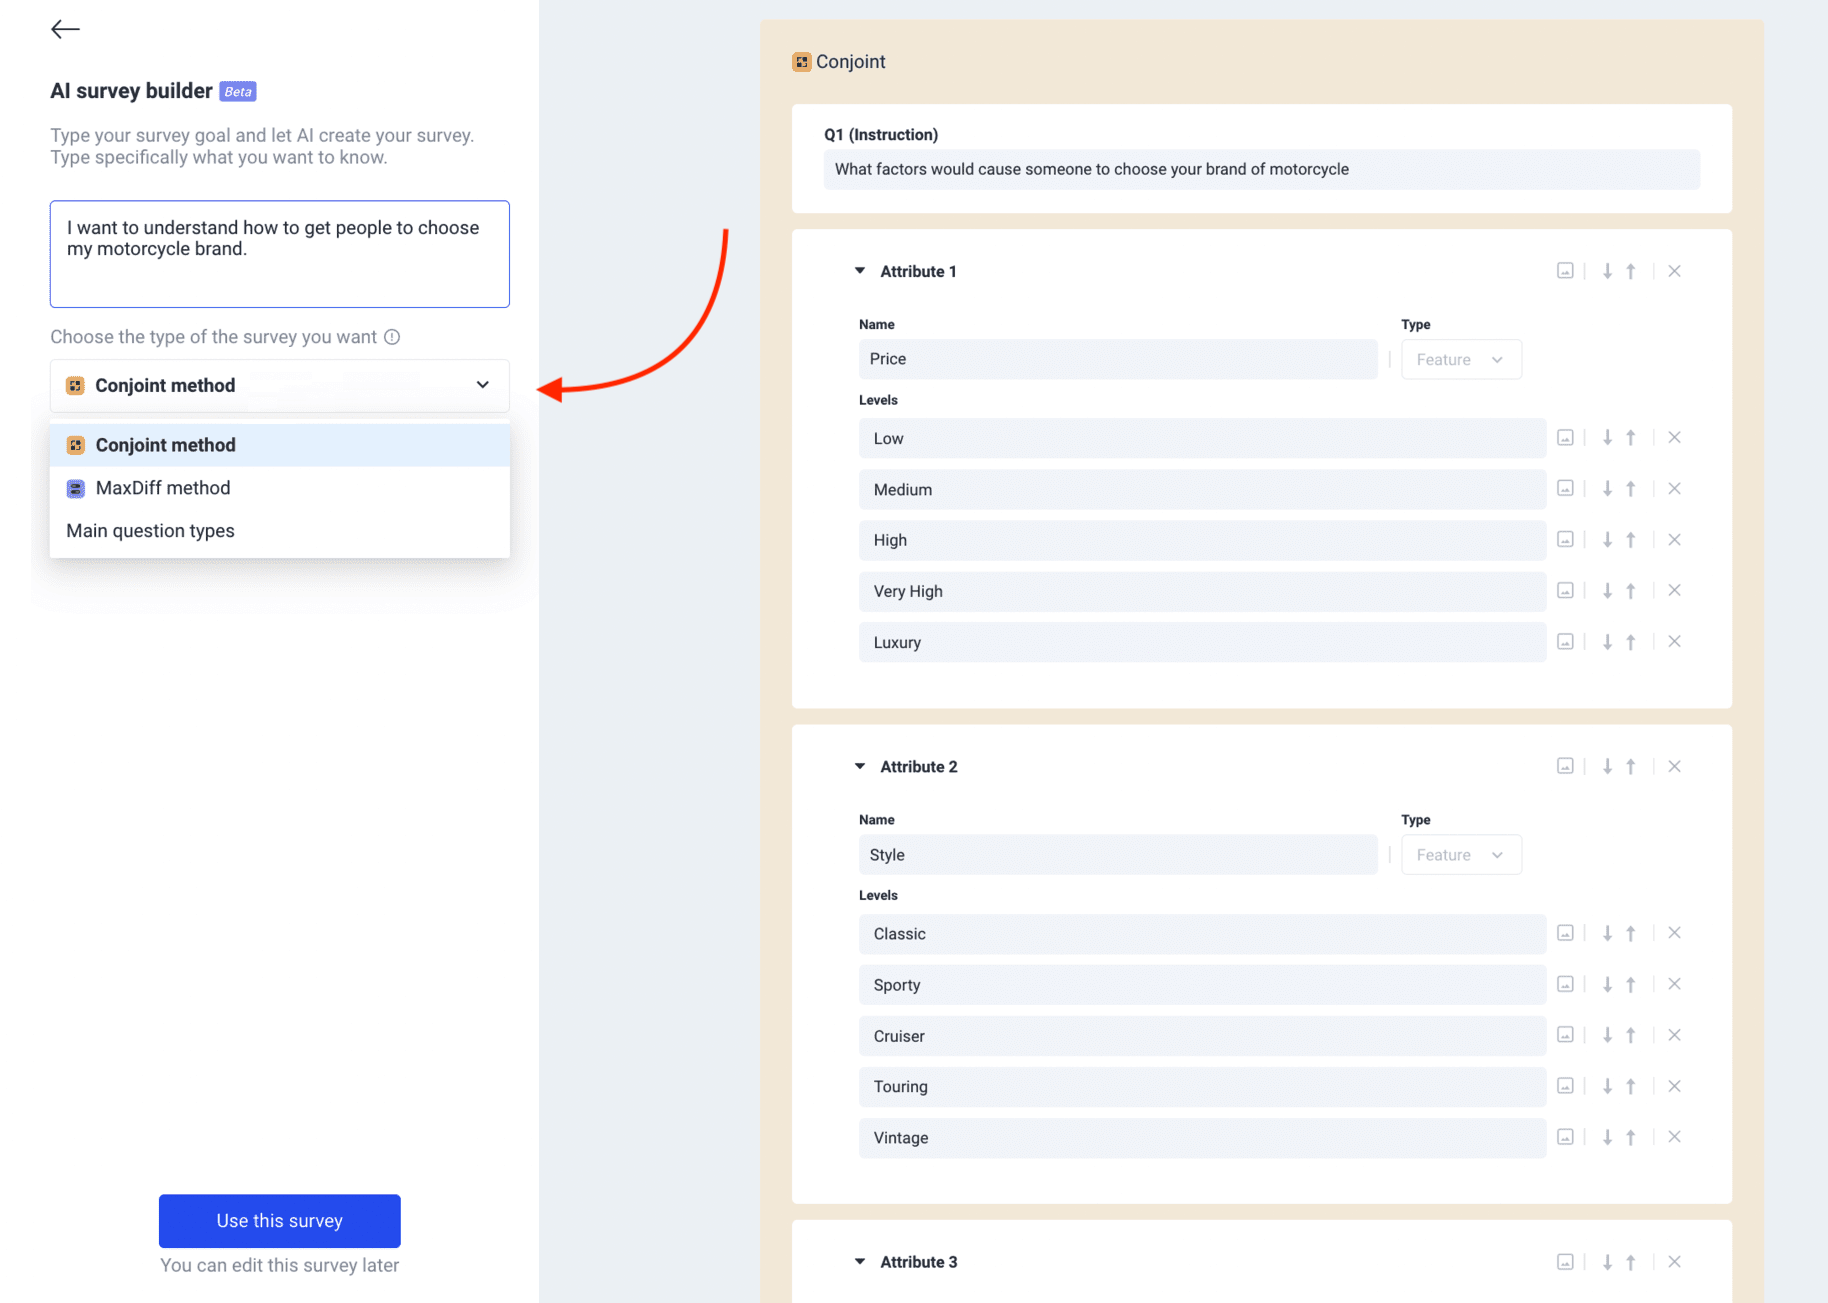
✅ Conjoint analysis vs. MaxDiff Analysis
Conjoint analysis is sometimes confused with MaxDiff, but it’s asking a fundamentally different question.
Where MaxDiff focuses on the question “Choose the single BEST and WORST option from this small list,” conjoint analysis seeks to answer “Which of these complete product packages do you prefer?” It tests different combinations of features (i.e., product packages) to identify the optimal mix and price point.
Note that Pollfish’s AI Survey Builder, one of our most widely popular features, supports both MaxDiff and conjoint methods:
For more information on Pollfish’s AI Survey Builder (and Pollfish’s other AI capabilities), explore this page.
You may also be interested in reading our article on the Best Conjoint Analysis Software, where we discuss how to run conjoint analysis surveys with Pollfish, analyze results, and key benefits of choosing our product over other conjoint analysis tools.
Our MaxDiff Analysis Offerings: Full-Service vs. DIY Options
We offer two flexible options for clients to conduct MaxDiff analysis, each suited to different needs and budgets.
Option 1: Full-Service MaxDiff Analysis
For teams that need deep customization or prefer to hand off the research process entirely, we offer a full-service option through our parent company Prodege.
We handle the end-to-end process, including:
- Research design
- Survey programming
- Sample & fielding
- Data processing & analysis
- Reporting
You can also engage us for specific phases of your MaxDiff analysis research — whatever level of support makes sense for your needs.
Turnaround typically runs 4 to 6 business days: 1–2 days for design, 1–2 days for programming, and around 2 days for analysis.
Why Choose Prodege?
✅ Commitment to high data quality
We’re deeply dedicated to ensuring the integrity of your survey data. We have a 40-person Panel Support, Security, and Compliance department dedicated specifically to this area. To learn more, read our article on the 3 Survey Data Quality Issues Sabotaging Your Research (& How We Fix Them).
✅ Decades of collective market research experience
Prodege’s consulting team brings decades of collective market research expertise, including researchers who have worked at firms such as Hall & Partners, Ipsos, Nielsen, Lieberman Research, NPD, and Kantar.
✅ Dedicated specialists for each project
Every project comes with a dedicated sample manager and project manager, plus additional specialists as needed. Unlike providers who spread their teams across dozens of accounts, we stay close to your project so you’re never left chasing down answers or managing details yourself.
✅ Other methodologies available
Depending on your goals, we can help identify the methodology that best fits your research needs, whether that’s MaxDiff, Conjoint, or something else entirely.
Option 2: DIY Survey Platform
The second option is to run your MaxDiff analysis through Pollfish, our DIY survey platform, renowned for:
- Exceptional survey data quality: We utilize Prodege’s first-party audience panels and implement rigorous quality control measures, as you can read about here.
- Transparent, pay-per-response pricing: As you build your survey, you can see your price update in real-time, offering full transparency with no subscription costs or hidden fees.
- Fast turnaround time: Turnaround time ranges from just a few hours (for general population surveys) to a few days (for more niche audiences).
- Complimentary 24/7 support from seasoned market researchers: We go beyond basic technical support. Our experienced market researchers are available around the clock to help with strategic aspects of your MaxDiff analysis project, from survey design to audience targeting and data analysis.
- Intuitive, easy-to-use platform: Pollfish is user friendly and designed to make building MaxDiff surveys straightforward, whether you’re a first-time researcher or a seasoned pro.
We’ll explore these benefits in more detail at the end of this article, backed by customer quotes. First, let’s walk through how to run a MaxDiff analysis using Pollfish.
How to Run a MaxDiff Analysis with Pollfish, Our DIY Survey Platform
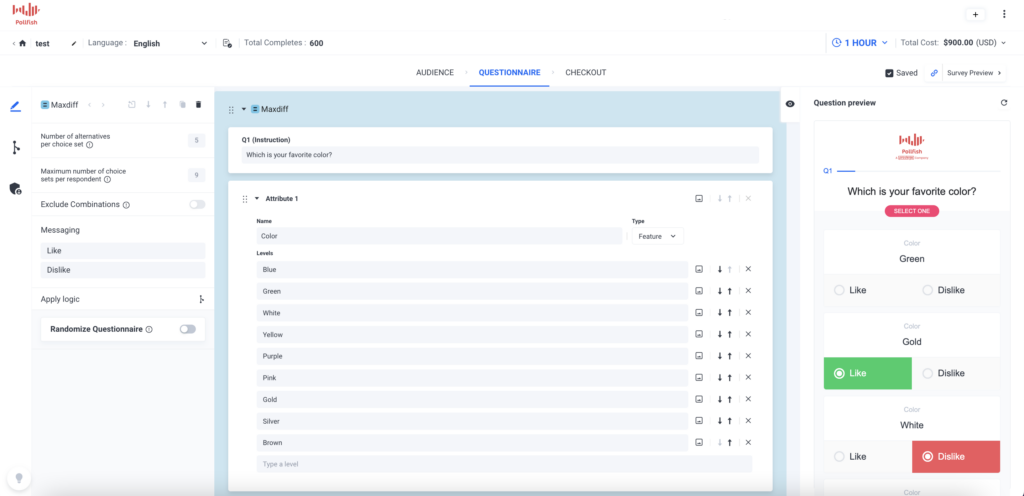
With Pollfish, you have three flexible options for building a MaxDiff survey:
- Build your survey from scratch
- Use our pre-built MaxDiff analysis template
- Use Pollfish’s AI Survey Builder
In this section, we’ll take a brief look at options 2 and 3. For a deeper dive, see our article on the Best MaxDiff Analysis Tools. For an overview of how to build a Pollfish survey from scratch, see this video.
Using Pollfish’s MaxDiff Analysis Template
Our MaxDiff analysis template gives you a ready-made, fully editable survey so you can customize from a solid starting point instead of building from scratch:
Note: See Pollfish’s full offering of 17 survey templates here.
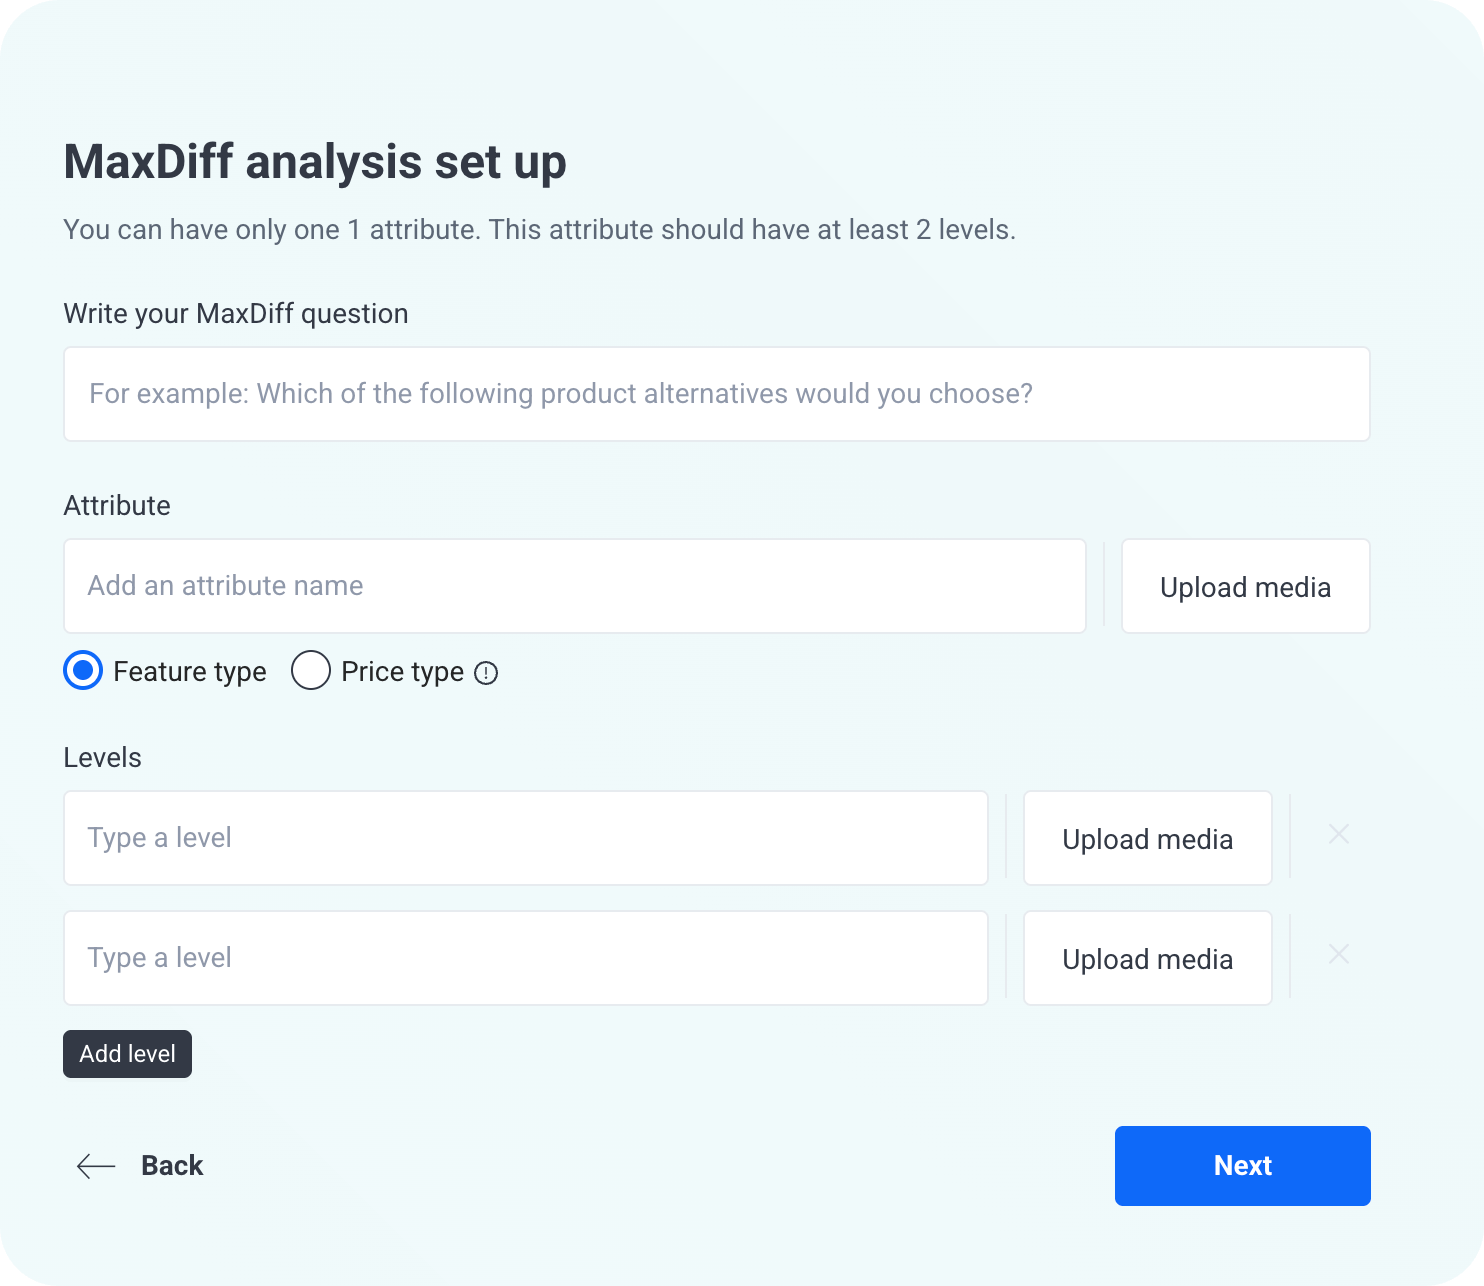
Simply enter your details into our intuitive MaxDiff analysis setup wizard, including the option to upload media (e.g., images):
As one of our customers noted:
“Pollfish is probably the single easiest software I’ve ever used. The drag and drop builder is great itself, but the template library also has anything we ever need, so you rarely have to design anything from scratch. The templates are also designed very well, we usually pick one, do a couple edits, and deploy. The whole thing takes less than 10 minutes.”
– Read the full review here
Creating a MaxDiff Analysis Survey with AI Survey Builder

Another popular option for creating a MaxDiff survey in Pollfish is to use our AI Survey Builder. As one of our customers shared:
“I’m loving Pollfish’s AI-generated questions — not only are they accurate and time saving, but it even came up with better survey queries than I could have thought of! With a quick poll of 250 respondents in just one working day, targeting my niche market was a breeze. The customer service team is super responsive too for those more complex enquiries about the tool and criteria. All in all this experience has been way easier (and cheaper) than any other ‘big players’ out there.”
– Read the full review here
How it works: Simply enter your survey objective and the AI builds a complete MaxDiff survey in minutes. From there, you can refine it manually or simply chat with the AI to make adjustments.
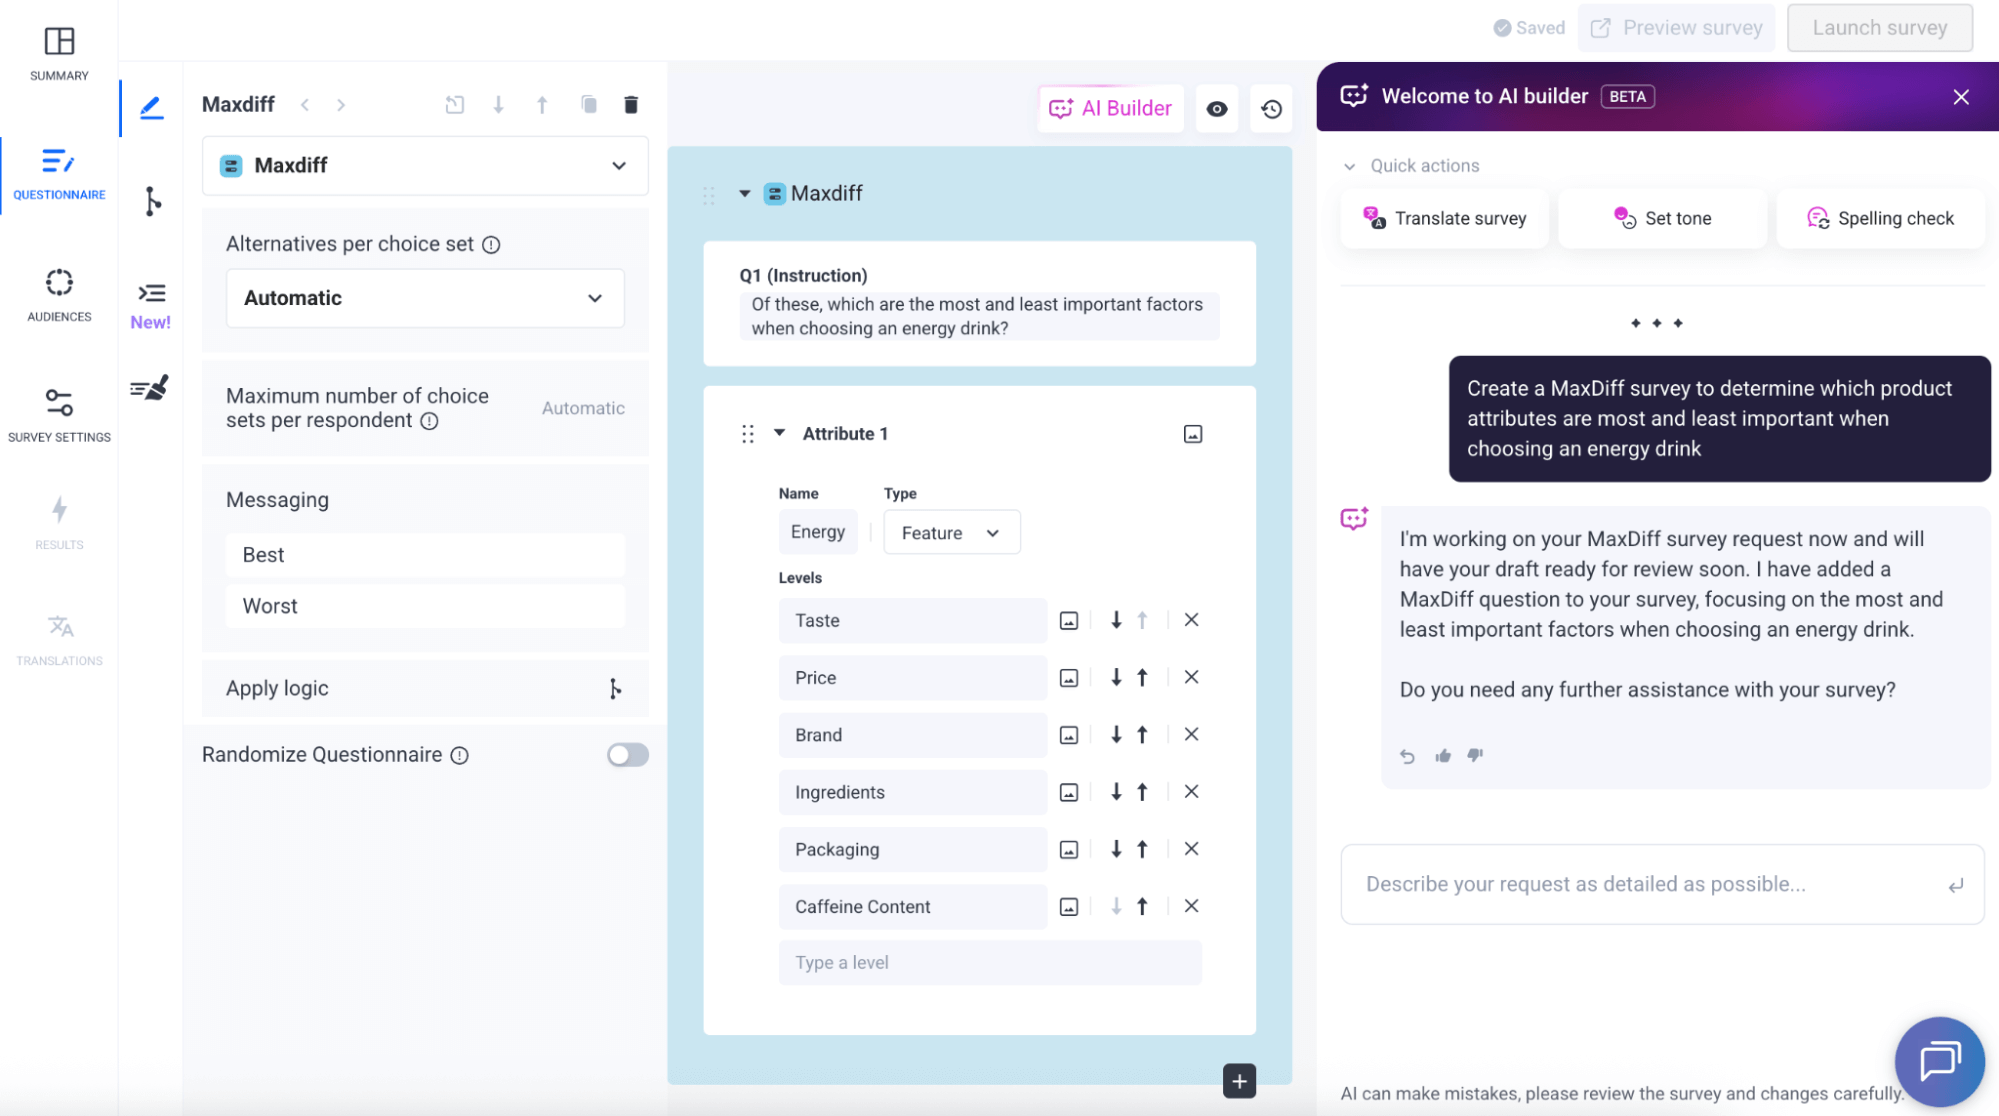
❇️ Customizing your MaxDiff survey
Once your survey is generated, just chat with the AI to refine it further. You can adjust attributes, target a specific audience, add or remove survey questions, change the tone, translate to another language, and more.
❇️ Applying sophisticated survey design
You can also use the AI to implement more advanced elements such as skip logic and branching, screening questions, answer shuffling, advanced survey question types, and more.
How to Analyze MaxDiff Analysis Results in Pollfish
With Pollfish, you can easily analyze your MaxDiff data directly within our platform. You also have the option to export your MaxDiff results to Excel, PDF, Crosstabs, and SPSS.
Up next, we’ll take a brief look at just some of the MaxDiff analysis charts available in Pollfish. For more detail, see our articles on the Best MaxDiff Analysis Tools and the Best Survey Software with Data Analysis Tools.
❇️ The Level Utilities Graph
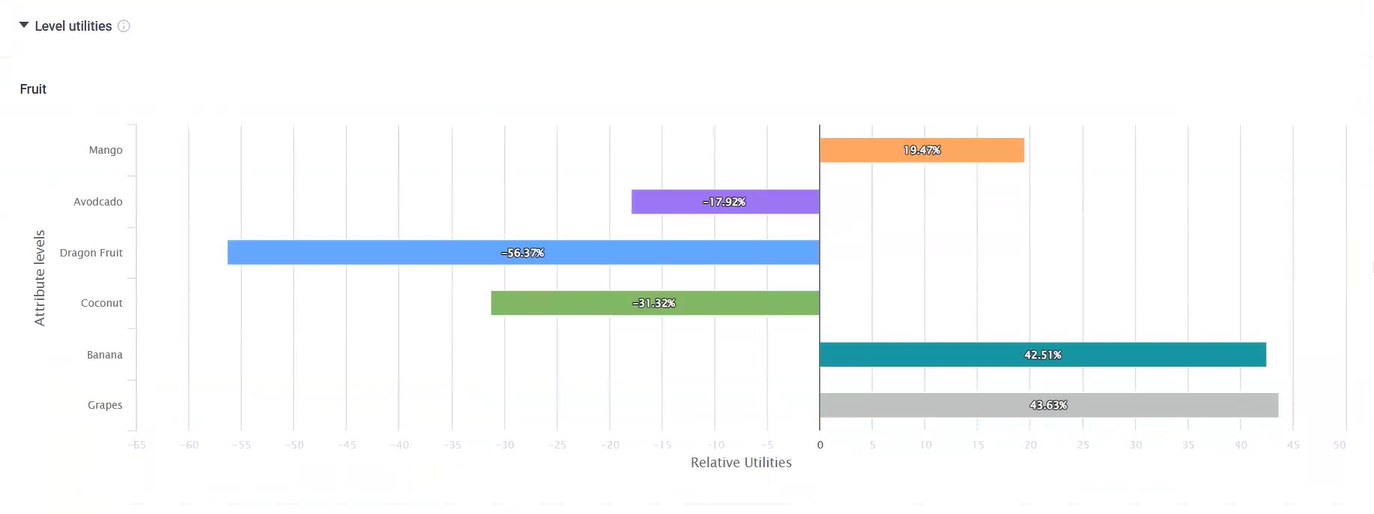
This chart shows how individual items affect relative preference, with each assigned a utility score reflecting how strongly it influences choice. Items to the right have positive scores (meaning they increase the likelihood of being chosen) while items to the left have negative scores.
In the example above, grapes and bananas are strongly preferred, while dragon fruit scores strongly negative.
❇️ The Best/Worst Level Performance Graph
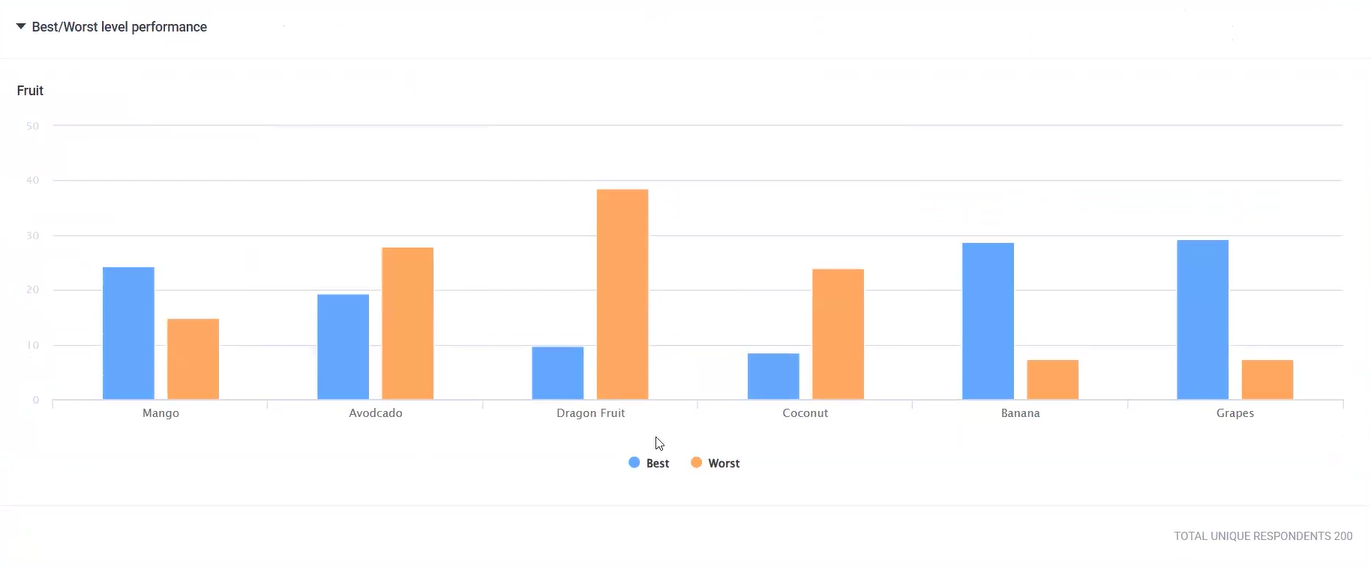
This chart shows how often each item was chosen as best versus worst, highlighting what drives strong positive or negative reactions.
In our example, dragon fruit and avocado were ranked worst most frequently.
❇️ The Distribution of Level Preferences Graph
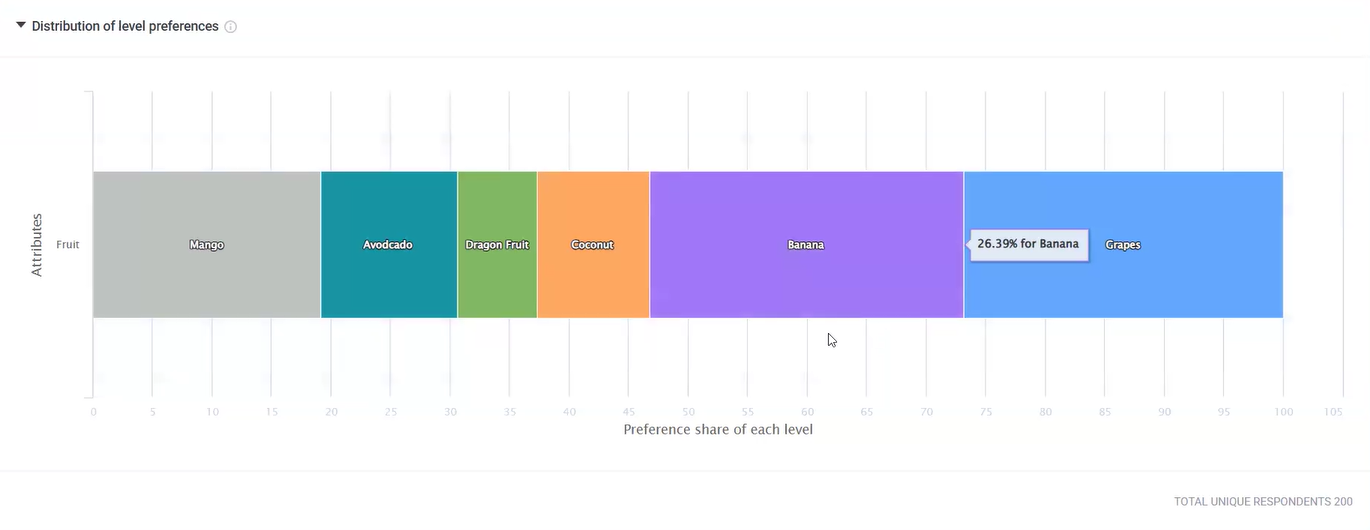
This chart shows the likelihood of each item being chosen over the others when all else is equal. Higher percentages indicate stronger preference.
In our example, bananas and grapes command the largest share, making them the most likely to be chosen.
❇️ Advanced Chart Creation & Reporting Options
For power users, we also offer Insights Builder, a robust data visualization tool that lets you build sophisticated multi-variable charts in just a few clicks and automatically export charts in your brand’s colors.
This can all be done via our intuitive, easy-to-use dashboard, rather than spending hours analyzing your dataset in Excel or other external tools.
Additional Benefits of Pollfish for MaxDiff Analysis, Backed by Customer Quotes
As we’ve explored above, Pollfish makes it simple to run sophisticated MaxDiff studies and gain valuable insights without giving up design flexibility or advanced features — no matter the complexity of your survey research.
Below, we explore additional advantages of using Pollfish for market research, backed by customer quotes.
Rigorous Data Quality Measures
At Pollfish, we are committed to ensuring the integrity of your survey data. We source respondents from Prodege’s first-party audience panels, giving us complete control over how respondents are recruited, vetted, and managed. This means you can be confident in the quality of your survey results.
To learn more about how we address common survey data issues, read our article on the 3 Survey Data Quality Issues Sabotaging Your Research (& How We Fix Them)
As several customers shared on Trustpilot:
“The most important point to make is that I trust the responses of my survey. My target audience was very specific and I could tell that the responses were legitimately coming [from] subjects in my target audience.”
– Read the full review here
“Each time I use this service I am blown away by the speed with which the responses come in and with the detail which most of them include. You can tell that the respondents take this very seriously. They must really enjoy doing it.”
– Read the full review here
Transparent Pay-per-Response Pricing Model
Our pricing is fully transparent from the start. As you build your survey, the pricing calculator updates in real-time so you always know exactly what you’ll pay — no subscriptions, no hidden fees.
Want to learn more? Check out our pricing page for details and explore our survey pricing calculator, where you can toggle the MaxDiff option, input your survey and audience details, and get an instant cost estimate.
As several customers shared on Trustpilot:
“They charge based on the completed response. It is very fair and transparent. As a researcher, I have used many survey platforms, but they are the best so far.”
– Read the full review here
“The dollar amount they quote you in their cost calculator tool, and the number they show when you’re developing the survey, is the number you pay. I was burned multiple times by [competitor] charging me unexpected amounts and making it difficult to quit an expensive subscription. I’m so happy to have found Pollfish as an alternative. Their support team also responds VERY quickly to chat messages and has been tremendously helpful the few times I had questions.”
– Read the full review here
“The pricing is clear and transparent from the beginning. The results come quickly and can be downloaded in different formats and with different filters. What we like most is the ability to filter the results and analyze them separately for each segment. We highly recommend this platform.”
– Read the full review here
Fast Turnaround Time
By utilizing Prodege’s first-party audience panels, we offer incredibly fast turnaround times. General population surveys (e.g., U.S. adults 18+) come back in just a few hours, while more niche audiences (e.g., dog owners in New York City who regularly buy dog treats) typically come back in a few days.
Review for a general population survey:
“I needed a 25 question survey answered, and was able to get 500 completed surveys in 8 hours with Pollfish. The presentation of the results is very impressive and the demographics information Pollfish provided is invaluable.”
– Read the full review here
Review for a specialized niche:
“I’m amazed at how quickly the platform was able to deliver rich, segmentable data from over 500 respondents. I had feature-ready insights in only 3 days.”
– Read the full review here
Complimentary Customer Service From Seasoned Market Researchers
Our support goes beyond basic troubleshooting. Experienced market researchers are available 24/7 by chat or phone, including nights and weekends. We can help with MaxDiff survey design, audience selection, data analysis, and more. Note that we can provide guidance on other types of surveys, including conjoint analysis, concept testing, brand tracking, and more.
As some of our customers mentioned on Trustpilot:
“The customer service team is super responsive too for those more complex enquiries about the tool and criteria. All in all this experience has been way easier (and cheaper) than any other ‘big players’ out there.”
– Read the full review here
“I love this product. I feel like it gives me enterprise grade market survey tech at a consumer price. Highly recommend. I love how responsive the customer support team is.”
– Read the full review here
“The customer service I received was fantastic. Brilliant guidance that helped get high-quality results. I was really pleased with the outcome and highly recommend using them.”
– Read the full review here
Intuitive, Easy-to-Use Platform
Whether you’re building from scratch, starting from a template, or using our AI Survey Builder, Pollfish makes running a MaxDiff survey straightforward at every step.
As several of our customers noted:
“I have used this platform ~10x over time and find the process easy, their review process helpful, and the insights I get from people valuable as I work through different product concepts in market research. Their pricing is more reasonable than other competitors I’ve looked into, and am happily going to continue using Pollfish.”
“The surveys were easy to set up, allowed me to select my very specific target and launched right away. Within a couple of days I had my results in an easy to interpret, actionable format well within my budget.”
Learn More About How We Can Help You Run MaxDiff Analysis Surveys
We invite you to:
- Create a free Pollfish account, no credit card required, to explore our DIY survey tool and launch your first MaxDiff survey.
- Visit our pricing page and explore our survey pricing calculator, where you can toggle the MaxDiff option, input your survey and audience details, and get an instant cost estimate.
- Book an introductory call to discuss our full-service offering, fulfilled through our parent company Prodege.