Brand Health Tracking: Best Practices & Choosing the Right Provider
![]()
Brand health is one of the strongest indicators of long-term growth, yet most companies struggle to measure it in a way that reflects how markets actually move. One-off studies and isolated metrics rarely capture how perception is evolving, or what’s driving the change.
Brand health tracking solves this by providing a continuous, structured way to measure and benchmark how customers perceive your brand over time and whether your marketing and product efforts are actually working. It helps teams spot trends early, detect shifts in perception, and connect brand performance to real business outcomes.
At Prodege (Pollfish’s parent company), we’ve run large-scale tracking programs with organizations across various industries, giving us a front-row seat to what works, what doesn’t, and why.
In this guide, we’ll cover:
- What is brand health tracking?
- Brand health tracking use cases
- What a strong brand health tracking program should deliver
- How our full-service brand health tracking offering works
- The Prodege “secret sauce” & key benefits for brand health tracking
- Signs it may be time to transition your brand tracker
- Switching to Prodege from other brand health trackers
Note: Book an introductory call to inquire about Prodege’s full-service brand health tracking offering, where we handle the entire process for you. If you prefer a DIY option, sign up for a free Pollfish account, no credit card required.
What Is Brand Health Tracking?
Brand health tracking is an ongoing, survey-based research program that serves as a regular check-up for your brand. It consistently measures how current and potential customers perceive your brand over time, helping you evaluate whether your marketing, product development, and promotional efforts are actually working.
Unlike one-off research, brand health tracking is continuous. Data is collected in recurring surveys called “waves,” fielded at regular intervals (monthly, quarterly, or semi-annually, depending on category activity) with the same core questions asked each time to enable direct wave-over-wave comparisons.
This longitudinal view is what makes it so powerful: it allows you to identify trends, spot problems early, and measure the real-world impact of strategic decisions.
Brand Health Tracking Use Cases
Some of the most common applications for brand health tracking include:
✅ Validating marketing spend
Brand health tracking helps you determine if your marketing campaigns are communicating the intended message and shifting brand sentiment in the right direction. It can also help you discover if your message is being confused with competitors’ ads.
Example: Through brand health tracking, one Prodege client discovered that their new ads were so generic that consumers misattributed them to their biggest competitor. This insight sparked a creative redesign that saved millions in misdirected messaging.
✅ Diagnosing strengths and weaknesses
Brand health tracking reveals how consumers perceive your brand and whether it aligns or misaligns with your intended brand positioning. This highlights areas to improve brand strength as well as opportunities for strategic pivots.
Example: Through brand health tracking, one Prodege client (a lotion brand) aspiring for a luxury positioning discovered that customers saw them as an everyday value brand. By embracing this perception and offering value packs, they saw sales skyrocket.
✅ Spotting competitive threats
Brand health tracking serves as an early warning system that shows if emerging competitors are gaining share of voice and market share, enabling you to take a proactive defense strategy.
Example: One Prodege client, a category leader, used brand health tracking to discover that new competitors were winning with innovative packaging and flavors. This led them to innovate their own product offerings and retain their leadership position.
✅ Identifying market trends
Brand health tracking uncovers shifts in consumer needs and behaviors so you can capitalize on new trends before the competition does.
Example: In the air freshener category, brand health tracking spotted a major shift from consumers preferring floral scents to clean/fresh scents. This helped one Prodege client shift focus to spotlight their fresh scents and capture massive growth.
What a Strong Brand Health Tracking Program Should Deliver
The success of your brand health tracking program depends on its ability to offer several elements, including:
- Reliable, consistent data you can trust: High-quality data is essential for ensuring that observed trends are real market shifts and not just noise.
- A clear understanding of brand performance across the customer journey: Brand health tracking should look holistically at the entire customer journey — from awareness to loyalty — to pinpoint exactly where your brand is winning or losing potential customers.
- Insights that go beyond metrics to explain what’s driving change: A strong program delivers strategic guidance, not just raw data.
- Accessible, usable insights across the organization: Great brand health tracking makes insights not only more stable but also more visible and actionable.
- A system that evolves with the market: Your brand health tracker should adapt to make room for new and emerging channels, topics, and brand segments.
How Our Full-Service Brand Health Tracking Offering Works
Prodege (Pollfish’s parent company) is our full-service brand health tracking provider known for exceptional data quality, which you can read more about in our article on the 3 Survey Data Quality Issues Sabotaging Your Research.
We serve as a partner, not just a vendor. This is a significant departure from many competitors’ rigid, productized offerings. Here’s how that difference plays out in practice:
The Prodege Methodology: Building a Better Tracker
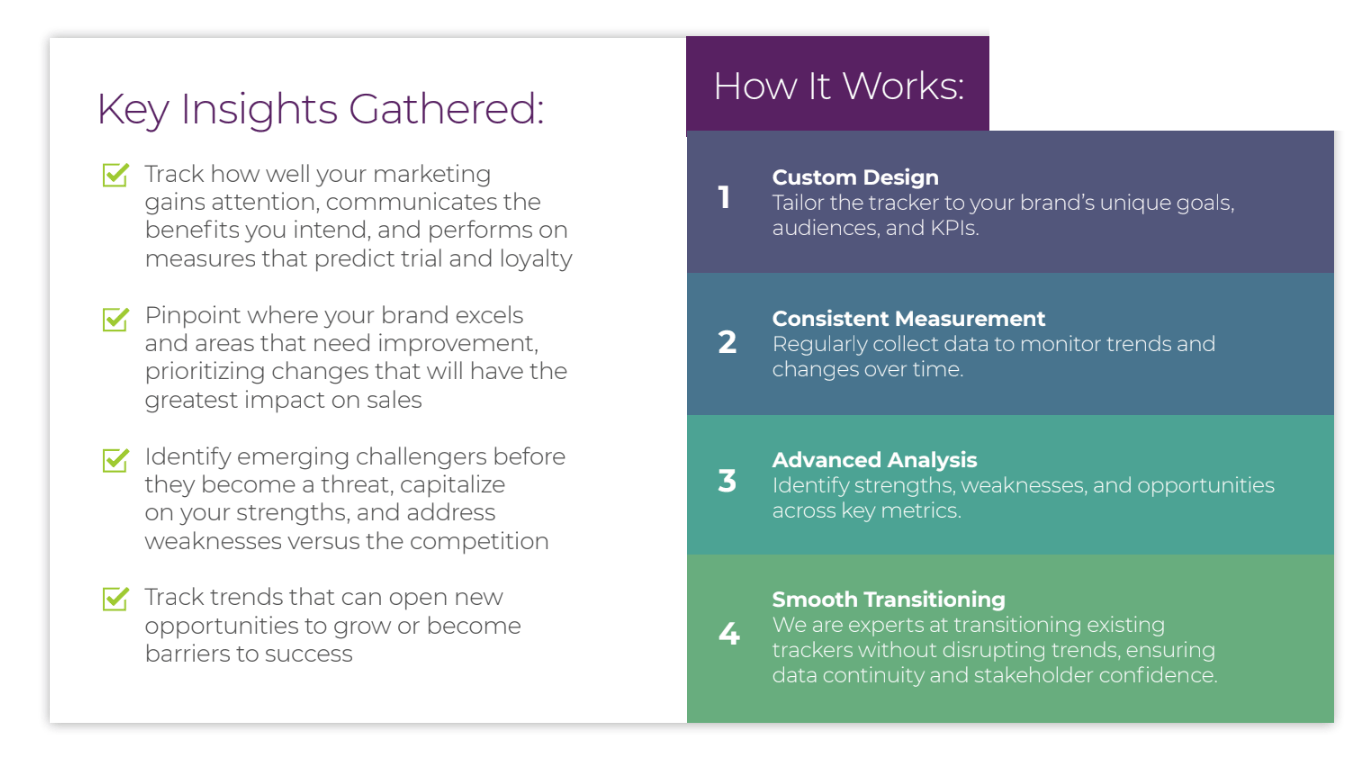
We design and execute brand health tracking programs through a structured framework centered on the full customer journey and advanced analytics.
The goal is to understand where a brand is losing potential customers on their journey from awareness to loyalty.
Let’s take a look at each stage in the funnel and how to optimize your brand strategy:
✅ Awareness: “Do people know you exist?”
- What it is: Measures a brand’s recall, both unprompted (“Top of Mind”) and when prompted from a list (“Aided”).
- Why it matters: This is the foundational hurdle; a brand cannot be purchased if it is not known.
- Prodege Advantage: Panel quality is crucial for consistent tracking. When brand awareness changes, our clients can trust it is due to their marketing efforts, not sample inconsistencies.
✅ Familiarity & Perceptions: “Do people know what you stand for?”
- What it is: Assesses what consumers think about the brand and its associations (e.g., “good value,” “high quality,” “innovative”).
- Why it matters: Uncovers critical gaps between the brand’s intended message and actual consumer perceptions — the core of brand equity.
- Prodege Advantage: Custom design shines here. We’ll work with you to define unique and category-relevant attributes, providing richer insights than generic templates.
✅ Consideration: “Will people spend their money on you?”
- What it is: Measures brand preference and whether a brand makes the “shortlist” for actual purchase among consumers who are aware of it.
- Why it matters: This is a critical Key Performance Indicator (KPI) that bridges brand perception and consumer action, and helps measure a brand’s success.
- Prodege Advantage: Our consulting expertise adds value by analyzing the “why” behind consideration scores, helping you convert aware non-considerers into customers.
✅ Usage & Loyalty: “Will they come back for more?”
- What it is: Measures trial, customer satisfaction, and likelihood to purchase again or recommend (Net Promoter Score – NPS).
- Why it matters: It is more cost-effective to retain customers than acquire new ones. This stage measures brand “stickiness” and predicts long-term viability, brand loyalty, and customer loyalty.
- Prodege Advantage: Our methodology is flexible. We customize it to match each client’s business model and key metrics, whether it’s NPS and retention for a subscription service or share of pantry for a snack brand.
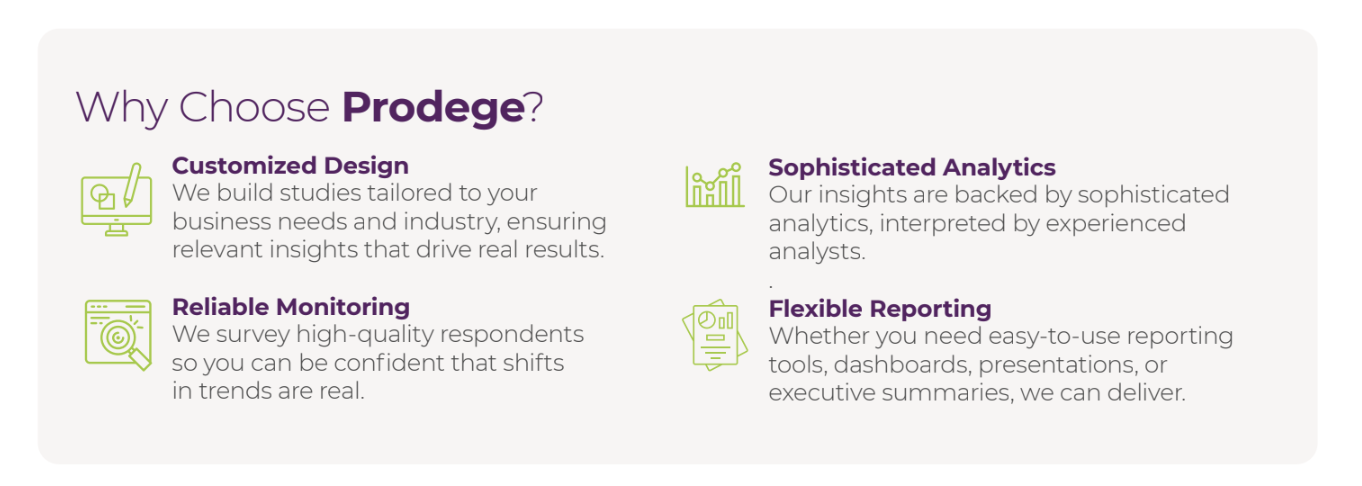
From Data to Decisions: The Prodege “Secret Sauce” & Key Benefits for Brand Health Tracking
Beyond the structured brand tracking framework above to measure brand health, Prodege offers several additional benefits that set our program apart:
✅ Key Driver Analysis (KDA)
Instead of just asking consumers what is important, Prodege uses advanced analytics to determine which brand attributes actually predict purchase behavior. This prevents organizations from investing in features that do not truly drive sales.
✅ Actionable recommendations
Our experienced consultants connect the data points to provide strategic direction.
With other brand trackers, your output might be: “Your consideration is down 3%.”
With Prodege, you’ll get a comprehensive recommendation: “Your consideration is down 3% among millennials, and our analysis shows it’s because a competitor is winning on the perception of ‘sustainability,’ which has become a key driver in the category. We recommend testing messaging that highlights your eco-friendly packaging.”
✅ Flex questions
A Flex section is built into your brand health tracker to ask about hot topics, delivering fresh insights and customer feedback in every wave without requiring a separate study. This keeps the tracker relevant and gives stakeholders a reason to engage with each new wave of results.
For a food company, one wave’s flex section might explore consumer attitudes toward GLP-1 medications and their impact on snacking behavior. The next wave might focus on protein perceptions. And so on.
✅ Dynamic dashboards
Unlike many competitors who deliver static reports and data tables, our dynamic Insights Builder empowers you to explore the data yourself. You can filter by demographics, time periods, or custom segments, increasing transparency and keeping insights accessible long after we formally present them to you.
Historical data from previous tracking providers can be mapped into these dashboards as well, so you see your full data history in one place from day one.
✅ High-quality, reliable data
As we explore in-depth in our article on 3 Survey Data Quality Issues Sabotaging Your Research, data quality has been central to Prodege’s DNA for over 15 years. We back that commitment with a dedicated 40-person Panel Support, Security, and Compliance Department focused exclusively on maintaining the integrity of our panel and the research it powers.
What makes our approach unique starts with something most providers don’t offer: we own and operate our own first-party audience panels, with over 100 million respondents across 125+ countries. And because our panelists do far more than just take surveys (they upload shopping receipts, play games, watch videos, and more to earn rewards), we can verify identity and engagement quality through real behavioral signals, not just survey responses alone.
Because panelists share real purchase receipts, we can build audience segments based on verified actions rather than claimed preferences. For example, you can target respondents and your target audience by:
- Stores visited: Consumers who’ve visited Target, Costco, 7-Eleven, Papa John’s, etc.
- Products purchased: Consumers who’ve purchased Ruffles, Dr. Pepper, Angel Soft, Tabasco, etc.
- Websites browsed: Consumers who’ve interacted with sites like CNN, Reddit, Quora, etc.
Precise behavioral filters ensure your brand health tracker is built on data you can reliably trust, yielding more actionable insights.
✅ Expert white-glove service
Our team consists of consultants with decades of collective market research experience, including members from firms such as Hall & Partners, Ipsos, Kantar, Lieberman Research, Nielsen, NPD, and others. And that experience carries through to every client interaction.
Every project includes a dedicated sample manager and project manager, with additional specialists added based on scope, so you always have a direct line to someone who knows your tracker inside and out.
✅ Better value
Because we own and operate our proprietary audience panels (including Swagbucks, MyPoints, InboxDollars, and others), we can deliver custom solutions at a more competitive price than traditional providers. You get a flexible, tailored program with deeper insights and stronger strategic guidance, without paying a premium for rigid, one-size-fits-all “Big Box” providers.
Signs It May Be Time to Transition Your Brand Tracker
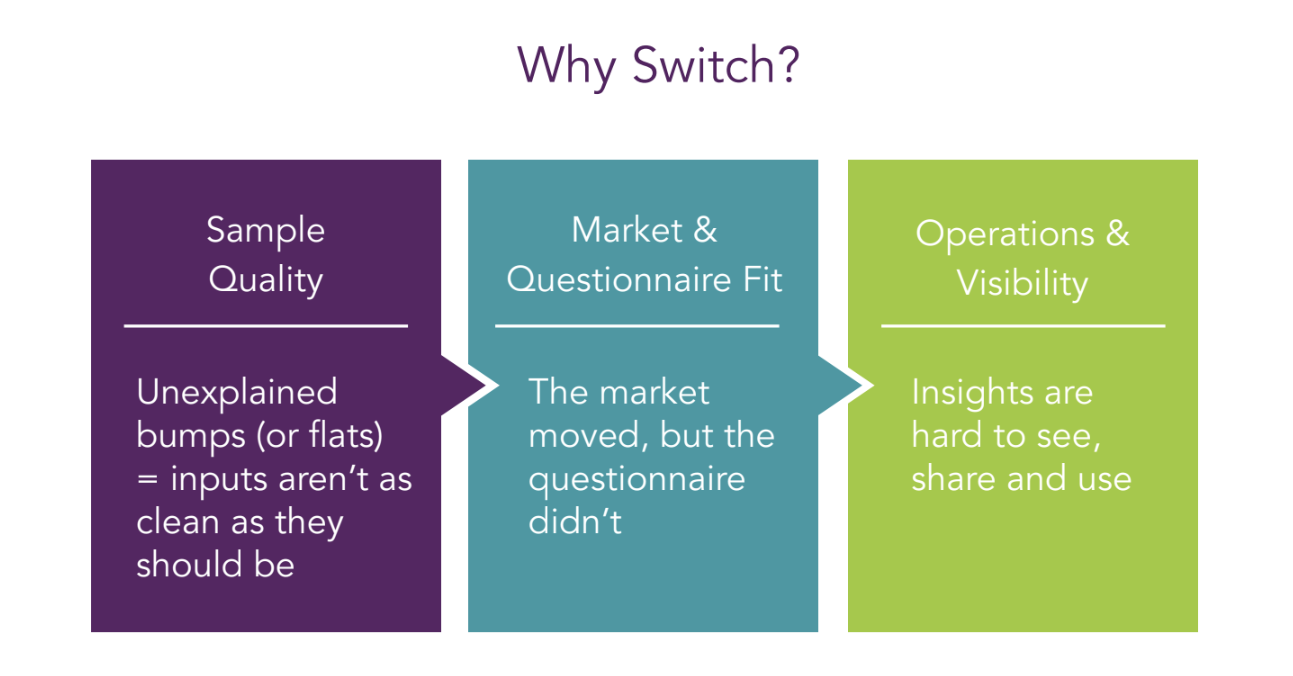
Not every tracking program delivers the value it should. If any of the following signals sound familiar, it may be worth evaluating whether your current setup is still meeting your needs.
Sample Quality: Unexplained bumps (or flats) signal inputs aren’t as clean as they should be
You open your tracker results on Monday morning and see an unexpected jump, but there was no PR event, no promotion, no market shift to explain it. Or the reverse happens: a major campaign launches and your trend line barely moves.
These patterns can be signs of sample quality issues. When the data source isn’t clean or consistent enough from wave to wave, the resulting fluctuations reflect sampling noise rather than genuine market shifts. If your team is regularly debating whether a data movement is “real” or just an artifact, that’s a signal worth taking seriously.
Market & Questionnaire Fit: The market has evolved, but the questionnaire hasn’t
It’s a new quarter. The market is evolving. There are new competitors and purchase drivers, new social media channels, and novel ways consumers discover and evaluate products.
Your stakeholders are asking: we see the what, but why is it happening? You scan the survey, and the language feels a step behind. It’s capturing yesterday’s habits, not today’s decisions.
This often happens because teams are understandably hesitant to change questionnaire wording for fear of disrupting trend lines. But the result is a tracker that shows the outcomes without enough of the why, and misses the new forces shaping your market.
Operations & Visibility: Insights are hard to see, share, and use
It’s readout week. Your team is scrambling for exports, screenshots, and email threads. Nobody is sure which data cut is the latest. Stakeholders need specific views of the data, and everything stalls.
The insight might be there, but it’s buried under operational friction.
If accessing and sharing your tracking results requires significant manual effort, the tracker’s practical value to the organization is diminished by how it’s delivered.
None of these signals means anyone did anything wrong. Markets evolve, tools age, and needs change. But if you recognize one or more of these patterns, it’s worth exploring what a transition could look like.
Switching to Prodege From Other Brand Health Trackers
Even when the signs point toward a change, many organizations hesitate to switch brand tracking providers for a couple of key reasons:
- Fear of the unknown: “What will change? What might break?”
- Fear of losing trends: “If we improve, do we lose the history?”
These concerns are legitimate, and we address them directly.
A major advantage of working with Prodege is how easy we make it to switch from other brand trackers without losing important data. We offer a fully documented and transparent transition process designed to protect continuity while making necessary enhancements.
Our transition process is designed to achieve four key outcomes:
- Protect trend lines where they matter.
- Improve quality where it’s safe and necessary.
- Reduce internal lift over time through automation and better tools.
- Provide faster access to results that people actually use.
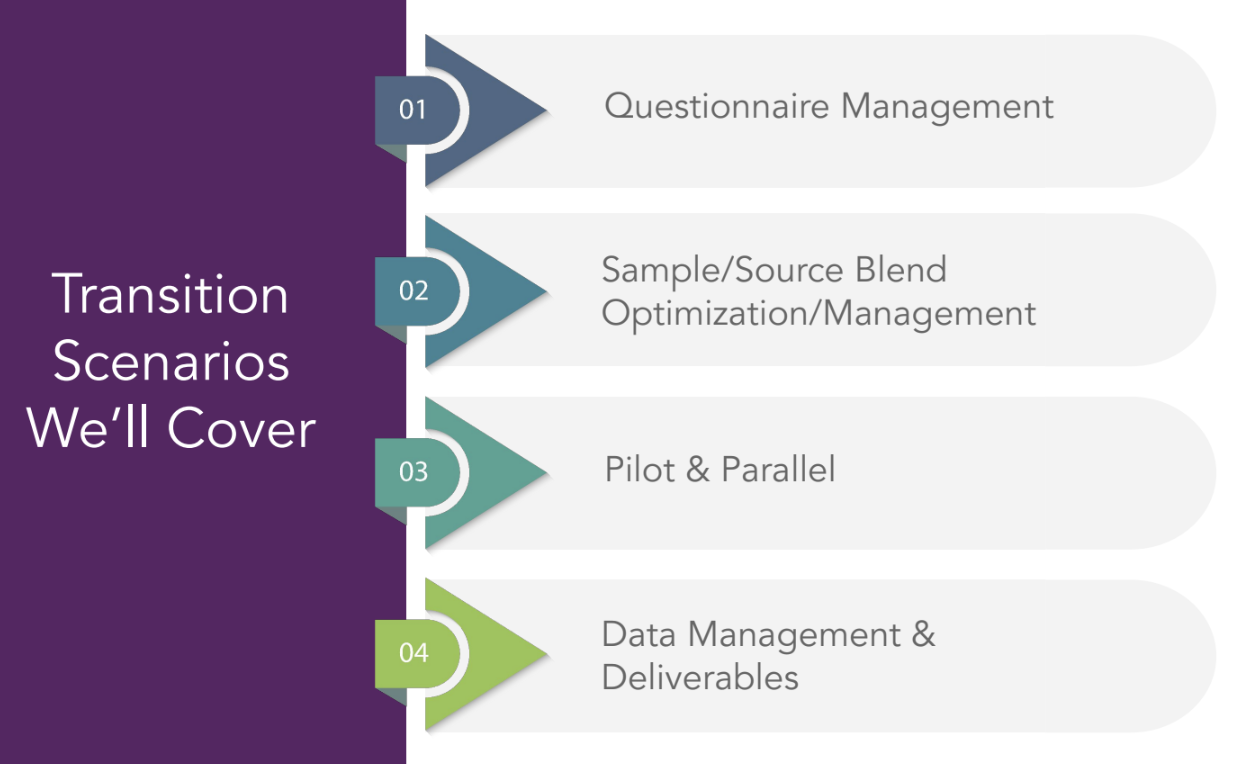
Prodege manages the transition through 4 key scenarios, ensuring a calm and methodical process:
✅ Questionnaire Management
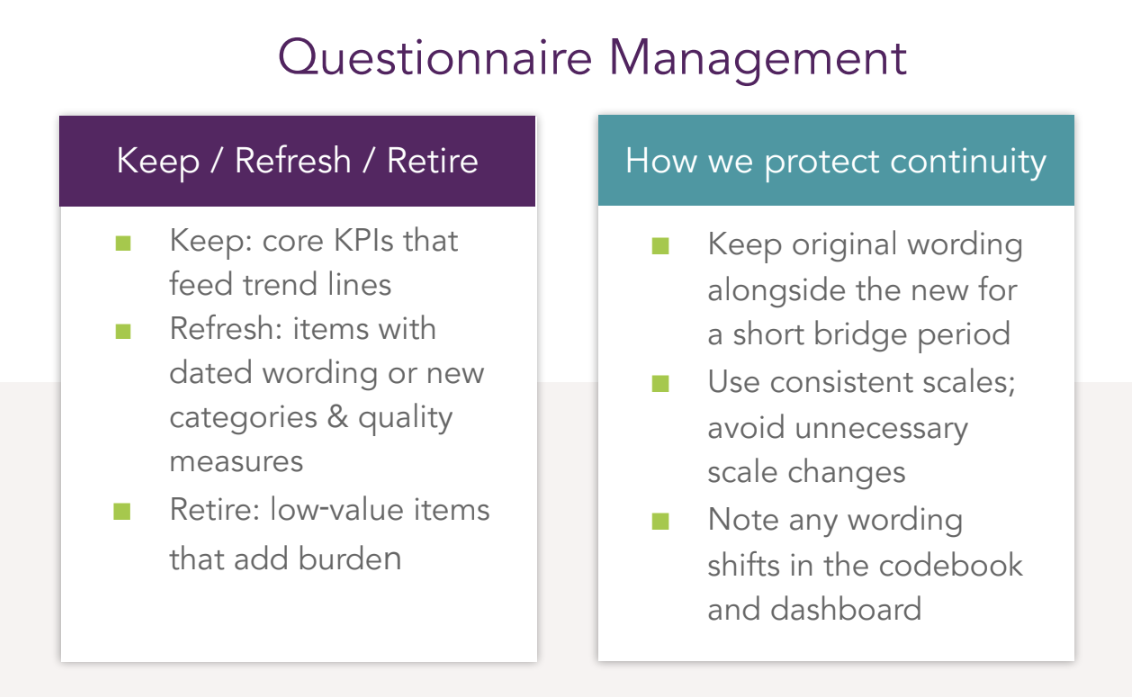
When transitioning a tracker, one of the biggest priorities is balancing continuity with the opportunity to improve. The goal is to protect the integrity of existing insights while enhancing the design, boosting quality, and reducing unnecessary burden.
We don’t want to carry along outdated or low-value questions simply because they’ve always been there. But we also need to safeguard valuable trend data. We approach this through a “Keep / Refresh / Retire” framework:
Keep: Core KPIs are non-negotiable. These are the key brand health metrics that feed your trend lines and are essential for business decisions. They’re preserved exactly as they are — with minimal to no changes in wording, structure, or placement within the questionnaire. This level of consistency is what protects continuity and ensures stakeholders can still rely on long-term trends.
Refresh: Some questions may have dated wording or may be missing newer categories that reflect today’s market reality. For instance:
- Brand lists that need updating
- Product formats or general answer lists that have evolved
- Digital channels that weren’t previously included
If certain responses were previously captured as open ends, this is a good opportunity to incorporate the most frequent mentions into the code frame for cleaner, more actionable data.
This stage is also the perfect moment to strengthen quality controls by introducing or refining attention checks, trap questions, and inconsistency flags. These measures improve data reliability and reduce the time teams spend on manual quality checks.
Retire: Some questions no longer serve a purpose (e.g., items stakeholders don’t actively use, or those that add unnecessary length and complexity to the survey and customer experience). Retiring low-value questions streamlines the respondent experience, reduces survey fatigue, and often improves overall data quality. It also frees up room for new, more relevant items that could provide greater business and brand value.
How we protect continuity:
- Keep original wording running alongside refreshed wording for a short bridge period, allowing direct comparison between old and new results
- Maintain consistent scales, as even a small adjustment to the number of points can disrupt established trends
- Clearly document any wording or design updates in the codebook and dashboards, ensuring full transparency for anyone analyzing or reporting the data
A tracker transition isn’t just about migrating data or switching suppliers. It’s an opportunity to modernize and future-proof your research in real-time. And a trusted, experienced partner can make that process significantly smoother. We provide a second pair of eyes to catch potential issues early, validate survey design changes, and ensure quality measures are applied correctly.
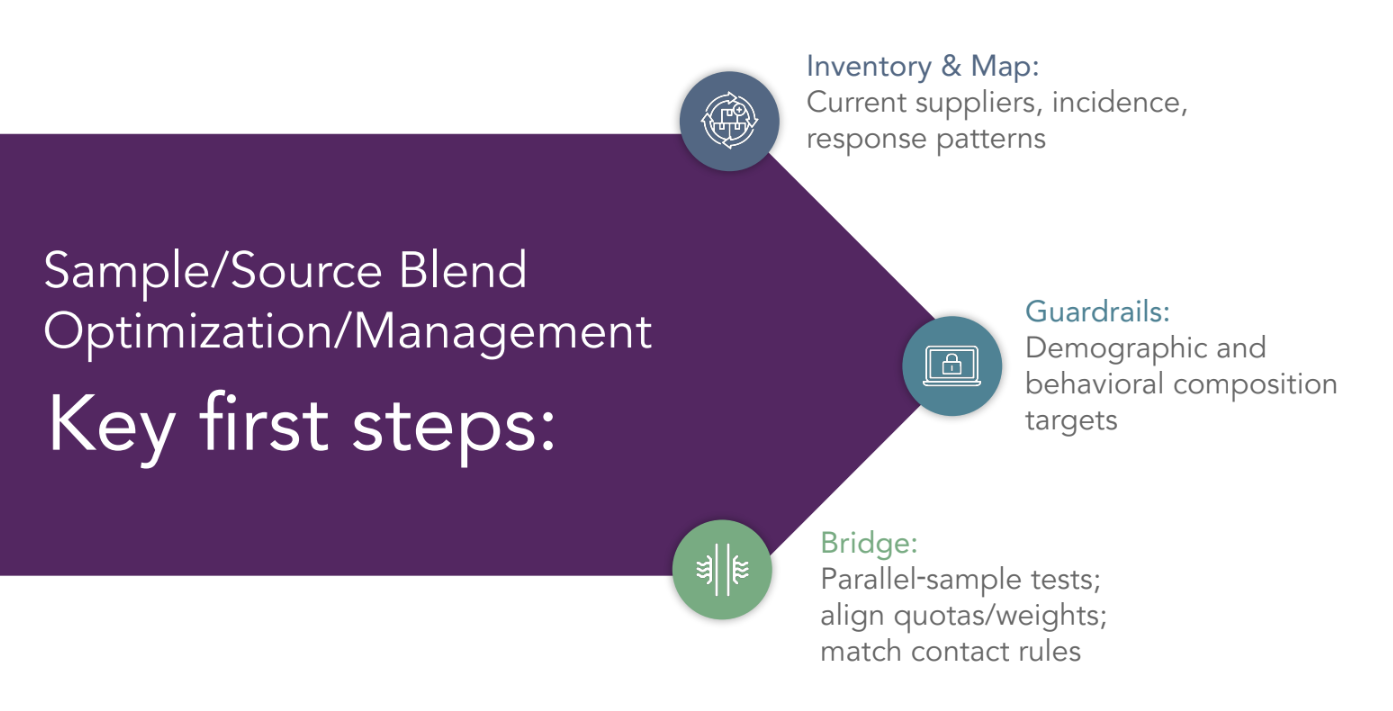
✅ Sample/Source Blend Optimization
When moving a tracker to a new vendor, one of the most sensitive areas is sample and source management. If this isn’t handled correctly, it can create shifts in who you’re hearing from, which risks distorting the trends.
Every online panel is unique. Differences in recruitment methods, validation processes, and the mix of sources each panel relies on (including whether they leverage partner networks) can all influence who ends up in a sample. These variations can have a significant impact on outcomes, so it’s important to understand a panel’s composition upfront to ensure consistency and reliability in the results.
The way to avoid skewing crucial results is to follow a structured transition process:
Inventory & Map: We take a close look at the current supplier mix:
- Who is providing the sample? What are the proportions by provider?
- Are they using owned-and-operated panels or leveraging partner networks?
- What do incidence rates look like per source?
- What have response patterns been historically?
All of this helps establish the baseline you need to match.
Set Guardrails: We set demographic and behavioral targets or quotas to ensure the sample composition reflects the same population you’ve been tracking. This is what prevents sudden changes in the respondent profile.
Bridge: If time allows, we run a bridge test with parallel samples, aligning quotas and weights across all sources. We also match key contact rules like frequency of outreach, exclusions, and targeting schedules so that respondents have a similar experience across all vendors.
✅ Pilot & Parallel Testing
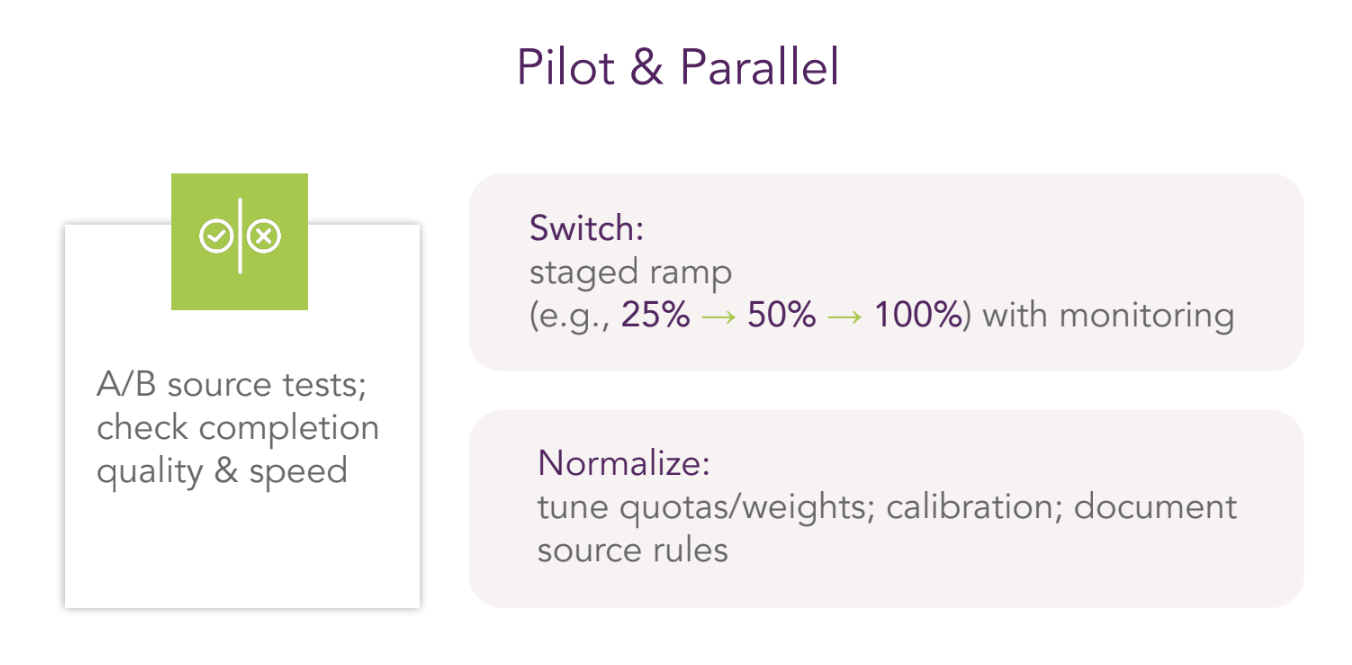
Before making any big moves, it’s a good idea to run A/B source tests in parallel. This lets you compare data side by side — completion quality, speed, and consistency — to confirm the new source can perform at the same level, or ideally better, than the existing ones.
The transition to a new source should never happen as a hard cut. A sudden change can introduce unnecessary risks and make it difficult to pinpoint the cause of any data shifts.
Instead, we recommend a staged ramp-up approach. For example:
- Begin with no more than 25% of traffic from the new source
- Evaluate results, then gradually increase to 50%
- Move to 100% only once stability is confirmed
At each stage, data should be monitored closely — not just for incidence and response rates, but also for demographic balance, speed, and overall quality. This phased approach allows you to identify and resolve any issues early, before they affect the full sample.
If new quality measures are introduced at the same time — for example, enhanced attention checks or trap questions — the staged ramp also allows you to compare results directly between old and new sources. This makes it easier to validate both the quality of the new source and the effectiveness of new checks, giving added confidence before the full switch is complete.
Once the transition is complete, we fine-tune quotas and weights, calibrate where needed, and fully document all source rules. This ensures long-term stability and provides transparency for future teams and audits.
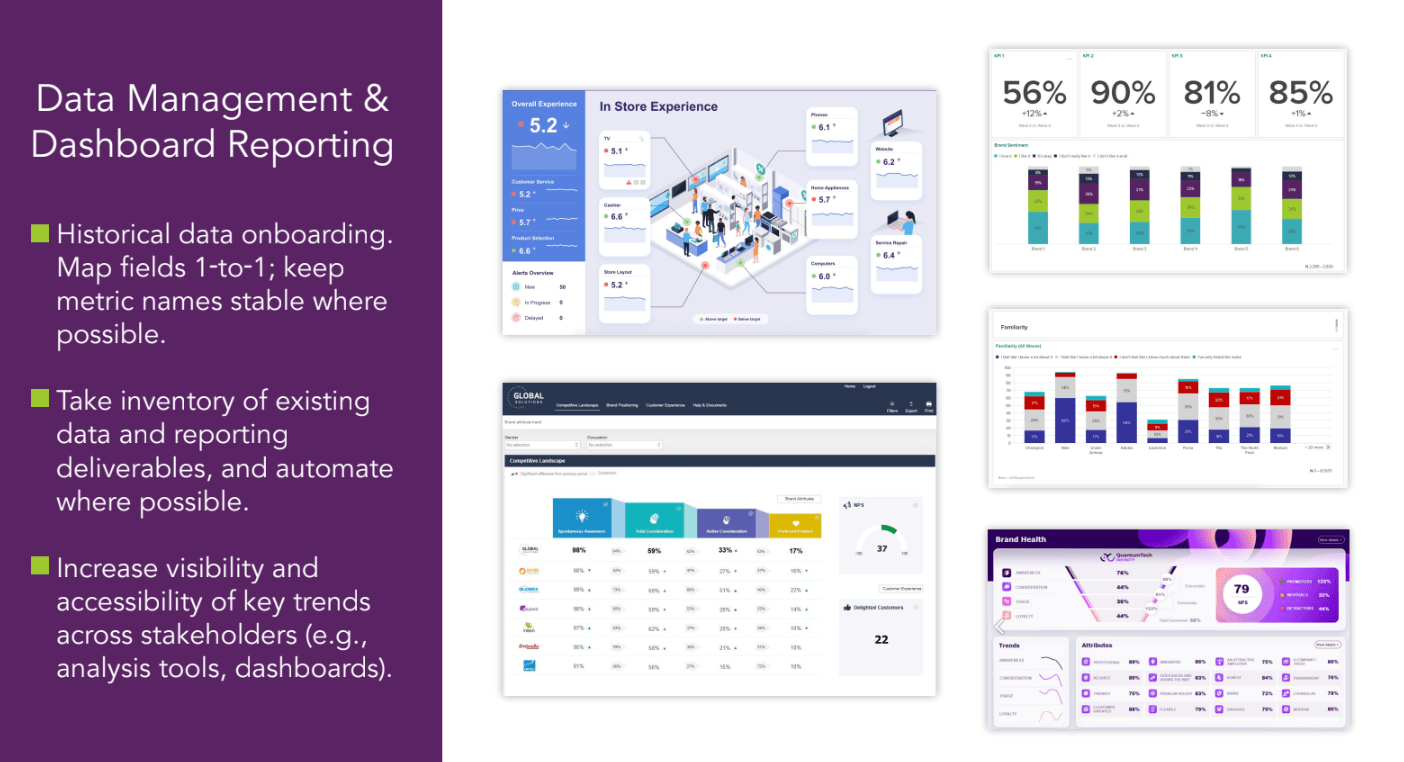
✅ Data Management & Dashboard Reporting
When transitioning a tracker, data management and dashboard continuity are just as crucial as the survey itself.
Start by taking stock of what exists: historical datasets, dashboard views, filters, user groups, exports, and any automated processes. Understanding the current setup gives you a clear roadmap for migration.
Historical data onboarding: All historical data must be onboarded so everything sits in one place. We map fields one-to-one wherever possible and keep metric names consistent. This ensures that historical trends remain interoperable.
Inventory & automation: We take stock of all existing data and reporting deliverables, then automate wherever possible. This reduces manual effort, cuts down errors, and ensures reporting comes out faster and more reliably.
Visibility & accessibility: A transition isn’t just about replicating what you had before. It’s also a chance to increase accessibility of key insights. That might mean surfacing trends in a more user-friendly dashboard and giving stakeholders role-based access. The goal is to make insights not just stable, but more visible and actionable.
A key takeaway is that onboarding historical data isn’t just housekeeping — it’s how we make sure stakeholders can trust and read the data easily from day one, while setting the foundation for smoother and improved reporting going forward.
Learn More About Our Brand Health Tracking Offerings
Whether you’re just starting out or looking to improve how you’re tracking brand health today, we’re here to help.
We invite you to:
- Book an introductory call to discuss our full-service brand health tracking offering, fulfilled through parent company Prodege.
- Create a free Pollfish account, no credit card required, to explore our DIY survey tool and launch your brand health tracking survey.