Market Research Surveys: Everything You Need to Know

Over the years, we’ve helped more than 13,000 users conduct market research surveys — from beginners designing their first questionnaire to seasoned researchers tackling complex studies. Through this experience, we’ve identified common questions and challenges that arise time and again.
This comprehensive guide consolidates those frequently asked questions along with our answers, drawn from decades of collective market research experience.
Here’s what we’ll cover:
- What is a market research survey?
- What are the benefits of market research surveys?
- How do surveys compare to other research methods?
- What is primary vs. secondary market research?
- What are the common types of surveys you can run?
- What are the best practices for running a market research survey?
- What are common market research survey pitfalls to avoid?
- What are the best software & tools for running market research surveys?
Note: Our market research survey software, Pollfish, is renowned for high audience quality, a transparent pay-per-response pricing model, and quick turnaround times. Sign up for a free Pollfish account, no credit card required.
What Is a Market Research Survey?
Market research surveys allow you to gather insights quickly from a large audience at scale. They can be used to collect information from consumers of your specific brand or from a more general population.
Surveys are made up of a series of closed or open-ended questions. For instance, you might ask open-ended questions about why users prefer certain phone brands (“What do you like most about your current smartphone?”), or closed-ended questions ranking specific features: (“Which of the following smartphone features are most important to you?”).
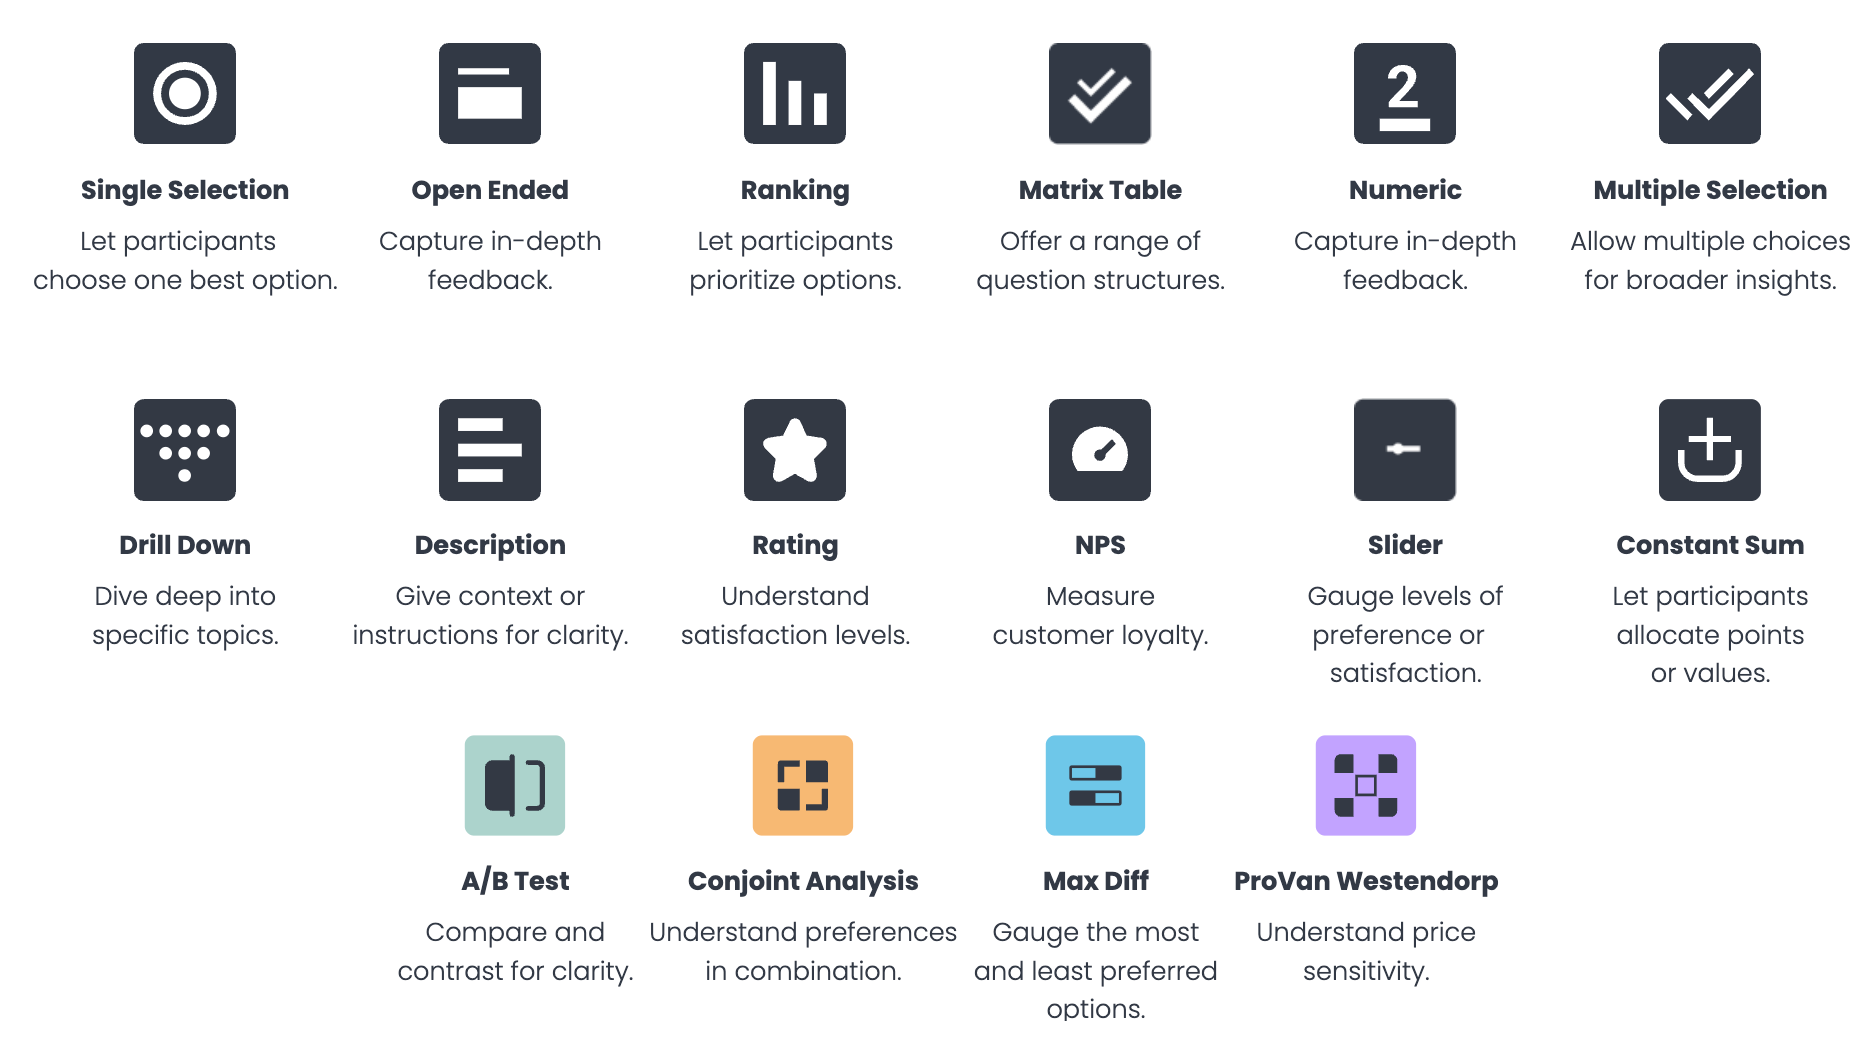
Pollfish, our market research survey software, supports 16 question types, ensuring you meet your research objectives.
Click here to learn more about each question type and when to use it.
We also offer advanced questionnaire design features, such as screening questions, skip logic branching, shuffling and randomization, and much more.
Click here to learn about 19+ advanced survey features we offer.
The Benefits of Market Research Surveys
Market research surveys reveal what your target audience actually thinks, enabling you to make data-driven decisions that align with real consumer needs and drive better business results.
Let’s break down some of the key benefits and use cases in more detail:
❇️ Evaluate new product ideas
Market research surveys let you test how consumers respond to new concepts before investing in production or marketing.
Example: You can run a concept testing survey that shows consumers a description or image of a new smartphone feature, and then measure their interest level.
❇️ Test the effectiveness of your advertising
Surveys can measure how well your ads capture attention, communicate key messages, or influence purchase intent.
Example: You could utilize an ad testing survey to show respondents two ad variations and identify which ad copy performs better.
❇️ Understand awareness and usage
Awareness and usage surveys can help measure how well consumers know your brand, how frequently they use it, and where you rank against your competitors.
Example: You could run a survey asking consumers whether they’ve heard of your cereal brand and how often they purchase it at the grocery store, and then ask the same questions about competitors.
❇️ Track customer satisfaction
Ongoing customer satisfaction surveys help you monitor how happy customers are and identify what drives loyalty or churn.
Example: You could use an NPS (Net Promoter Score) survey to ask existing customers how likely they are to recommend your brand to a friend, followed by a series of questions about why they gave that score.
Note: These are just some of the common use cases and benefits you can achieve with market research surveys. To learn more, read why surveys are the best market research tool.
How Do Surveys Compare to Other Research Methods?
- The benefit: A significant advantage of surveys over qualitative research methods is that they are a much faster way to collect insights from a large group of people at scale.
- The downside: In comparison with qualitative research methods (e.g., focus groups, IDIs, etc.), surveys have traditionally focused on the “what” more than the “why.”
- Bridging the gap: Pollfish’s Conversational AI feature bridges this gap by collecting qualitative insights at scale. It engages respondents through real-time, AI-powered chat with dynamic follow-up questions.
This interactive approach encourages participants to share additional details they might not have provided in a static survey, helping you discover insights that weren’t immediately apparent.
Note: To learn more about Pollfish’s AI-powered survey features, including our AI survey builder, we invite you to read our article on the best AI survey tools.
What Is Primary vs. Secondary Market Research?
Primary market research is information collected directly from consumers or users through methods such as surveys, focus groups, and interviews.
The key to reliable primary research is ensuring data quality and accuracy. At Pollfish, we utilize first-party audience panels (through parent company Prodege) to implement rigorous data quality measures, as we discuss in our article on the 3 Survey Data Quality Issues Sabotaging Your Research (& How We Fix Them).
Unlike primary research (which is tailored to your precise needs), secondary market research is collected from sources that are typically syndicated. This can include sales data, journals, online articles, and industry reports from sources like Mintel, Statista, Nielsen, Circana, and others.
What Are the Common Types of Market Research Surveys You Can Run?
Pollfish offers several pre-built survey templates for common survey types, saving you significant time and effort in the questionnaire design process.
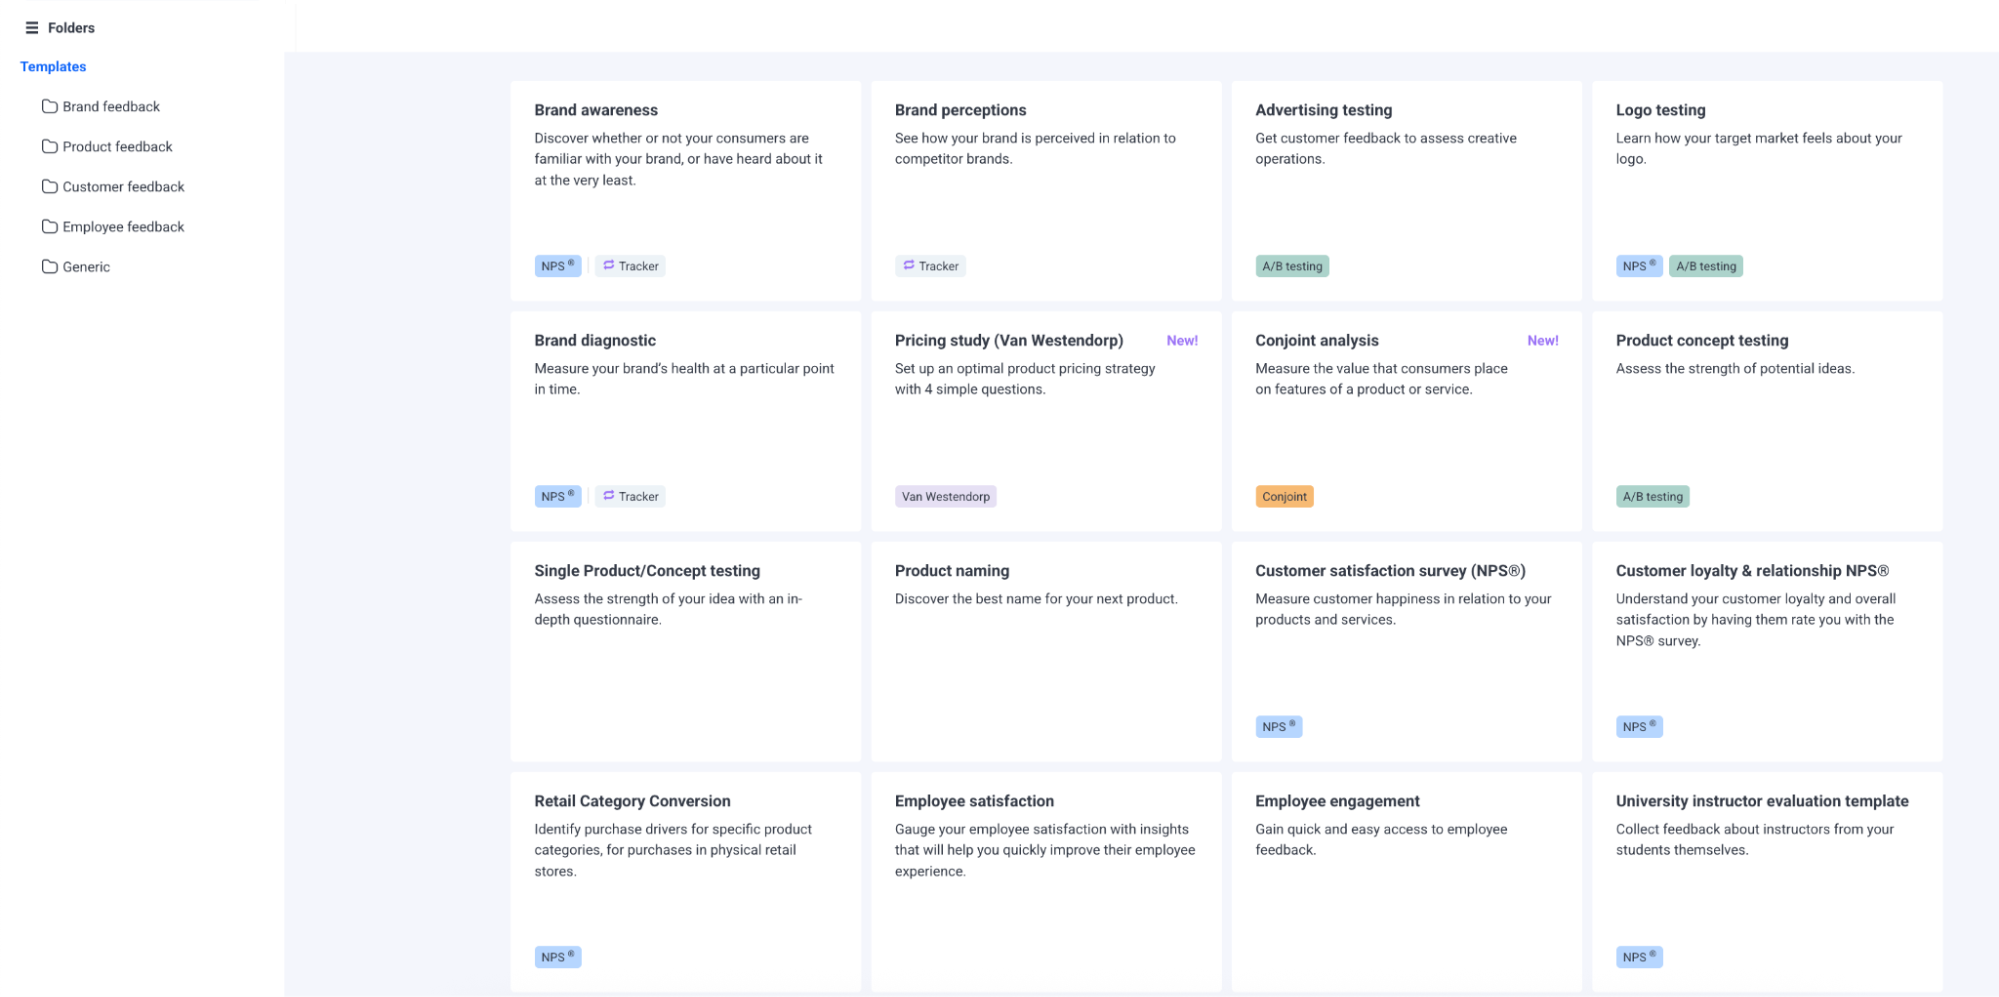
Our templates are grouped into 5 categories:
❇️ Brand feedback
Within Brand feedback, templates include:
- Brand awareness: Discover whether or not your consumers are familiar with your brand, or have heard about it at the very least.
- Brand perceptions: See how your brand is perceived in relation to competitor brands.
- Advertising testing: Get customer feedback to assess creative operations.
- Logo testing: A great marketing survey to learn how your target market feels about your logo.
- Brand diagnostic: Measure your brand’s health at a particular point in time.
❇️ Product feedback
Within this, templates include:
- Pricing study (Van Westendorp): Set up an optimal product pricing strategy with four simple questions.
- Conjoint analysis: A great market research study to measure the value that consumers place on features or functionality of a product or service.
- Product concept testing: Assess the strength of potential ideas and understand market trends.
- Single product/concept testing: Assess the strength of your idea with an in-depth questionnaire and optimize based on these findings.
- Product naming: Discover the best name for your brand or future products.
- MaxDiff analysis: A survey-based market research technique for quantifying customer preferences.
- CPG brand awareness and perceptions: Discover the familiarity and perceptions that target customers have with Consumer Packaged Goods (CPG) brands.
- CPG store choice drivers: Focus on shoppers’ choice of store for Consumer Packaged Goods (CPG) and their experience.
- CPG path to purchase: Discover shoppers’ path to purchase Consumer Packaged Goods (CPG), and their decision-making process when buying various products.
❇️ Customer feedback
Templates include:
- Customer satisfaction survey (NPS®): Measure customer happiness in relation to your products and services, allowing you to meet customer needs better.
- Customer loyalty & relationship NPS®: Understand your customer loyalty and overall satisfaction by having them rate you with the NPS® survey.
- Retail category conversion: Identify purchase drivers for specific product categories, for purchases via in-person physical retail stores.
❇️ Employee feedback
Templates include:
- Employee satisfaction: Gauge employee satisfaction with insights that will help you quickly improve employee experience.
- Employee engagement: Gain quick and easy access to employee feedback.
❇️ Generic
Templates include:
- University instructor evaluation template: Collect feedback about instructors from students themselves, and help answer questions you may have about improving the curriculum.
- General event feedback: Measure customer satisfaction with the events that you held.
- Website feedback: Gain feedback on your website’s appearance, design, and layout. (You can also run surveys to get feedback about your social media pages and other key assets.)
- Purchase feedback: Run product feedback surveys to gather information about recent purchases. This is an excellent consumer research tool.
- Online retailer perceptions: Gather feedback and customer experiences about your online retail website.
Note: Click here to learn more on how to best utilize Pollfish’s survey templates.
What Are the Best Practices for Running a Market Research Survey?
❇️ Start with Clear Objectives
Every good survey starts with a clear goal. It’s important to know exactly what you want to learn and design your questions around that objective.
- Bad example: “I want to know if people will use my app.”
- Good example: “I want to identify which factors matter most when customers choose a food delivery app.”
❇️ Define and Screen Your Audience
Targeting the right people is critical for accurate results. You can use demographic and behavioral filters to make sure you’re reaching the right respondents and add screening questions and quotas to balance your sample.
- Example: If you’re studying pet ownership habits, screen for people who currently own a pet and specify the type (e.g., dog or cat).
❇️ Avoid Leading or Biased Questions
Biased questions skew your results. It’s important to make sure every question is neutral and offers balanced response options.
- Bad example: “How much do you love shopping at our store?”
- Good example: “How satisfied are you with your recent shopping experience?”
❇️ Use a Variety of Question Types
Mixing question formats keeps respondents engaged and improves data quality. Using a combination of single-select, multi-select, sliders, star ratings, and multimedia questions makes your survey more dynamic.
You can see a full list of the question types Pollfish offers here.
❇️ Keep Surveys Short and Focused
Aim to keep your survey under 15 minutes. Longer surveys lead to fatigue, rushed answers, and poor data quality.
It’s best to eliminate filler questions and always circle back to your objective. If a question doesn’t help answer the objective, consider cutting it.
You can also implement logic and conditional branching to ensure survey takers see only the questions relevant to them.
For example, let’s say you’re running a travel habits survey. You can add skip logic so that respondents who answered “No” to the question “Have you taken an international trip in the past year?” aren’t shown follow-up questions about specific international destinations.
❇️ Use Simple, Clear Language
Write questions that are easy for anyone to understand, and avoid jargon and complicated phrasing.
To test if your question is simple enough, apply the “grandma test”: if your grandma wouldn’t understand it, rewrite it.
- Bad example: “Thinking of your habitual purchasing behavior, which coffee brands are most representative of your consumption patterns?”
- Good example: “Which of these coffee brands do you buy most often?”
❇️ Plan for Analysis from the Start
Think ahead about how you’ll interpret results. We recommend you define your hypotheses early and identify which data points will help you test them.
Don’t assume all respondents are the same. Look for differences between segments such as age, income, or region so you can find relevant insights within the total audience.
For example, if you’re running a coffee brand survey, you might find that younger respondents prioritize flavor variety, while older respondents care more about price or brand loyalty. Segmenting your data helps reveal these distinctions so you can tailor decisions to each audience group.
As we discussed in a recent article, you can use advanced data filters and cross-tab analysis directly within the Pollfish platform to segment results by gender, age, brand usage, etc.
❇️ Run a Pilot Before Launch
The best way to know you are on the right track is to run a pilot first. A pilot study is conducted prior to launch to help you check the survey’s flow, duration, and dropout rate before collecting full-scale data. It will help fine-tune your questionnaire and provide the reassurance you need to move forward.
What Are Some Common Market Research Pitfalls to Avoid?
🚫 Unclear abbreviations
Don’t assume respondents understand industry terms or acronyms. If a question requires interpretation, your data may be inaccurate. Always spell out abbreviations the first time you use them.
- Bad example: “How would you assess the CSR initiatives of Company X?”
- Good example: “How would you assess the corporate social responsibility (CSR) initiatives of Company X?”
🚫 Double-barreled questions (asking about two things at once)
Even if two variables seem closely related, respondents may interpret them differently. Keep each question focused on a single idea to avoid confusion.
- Bad example: “How would you rate our Customer Support Team’s politeness and ability to resolve your issues?”
- The solution: Split it into two separate questions: one about politeness and another about problem resolution.
🚫 Overly complex or “chatty” questions
Survey respondents prefer concise, straightforward questions that get directly to the point.
- Bad example: “Thinking about all the different types of stores you’ve visited in the past six months for groceries, household items, and personal care products, which would you say offered the most satisfactory shopping experience overall?”
- Good example: “Which store gave you the best shopping experience in the past six months?”
🚫 Poor question order and flow
A survey with good flow keeps respondents engaged, reduces dropout rates, and minimizes low-quality responses. You’ll know your survey has good flow if it feels like a natural conversation. To achieve this, group related questions together, start with general topics before moving to specifics, and avoid repeating yourself.
Bad example: This sequence of questions demonstrates poor flow:
- How likely are you to recommend our brand to a friend?
- What first made you aware of our brand?
- Have you purchased from us before?
- How satisfied are you with your most recent purchase?
This question order doesn’t make sense. It asks about recommendations before establishing whether the respondent has even made a purchase.
A better approach: A logical flow would start with awareness, move to experience, and then ask about satisfaction and loyalty.
What Are the Best Software & Tools for Running Market Research Surveys?
We dive deep into this question in our comprehensive article, 11 best survey software for market research, comparing Pollfish with other market research providers to help you choose the right solution.
Some of Pollfish’s key differentiators include:
- Reliable survey data: Access to high-quality respondents through our parent company Prodege’s first-party audience panels.
- Flexible, transparent pricing: Pay only for the responses you need, with no long-term contracts or unused credits going to waste.
- Fast turnaround time: Get responses in hours for general audiences or within days for specialized demographics, so you can move quickly on insights.
- Expert support: Get guidance from seasoned market researchers on survey design, audience targeting, and data analysis — not just basic technical troubleshooting.
Interested in Learning More About Pollfish?
- Create a free account, no credit card required.
- Inquire about our end-to-end market research services, where our team takes care of the entire process, including survey design, audience targeting, data analysis, reporting, and more.