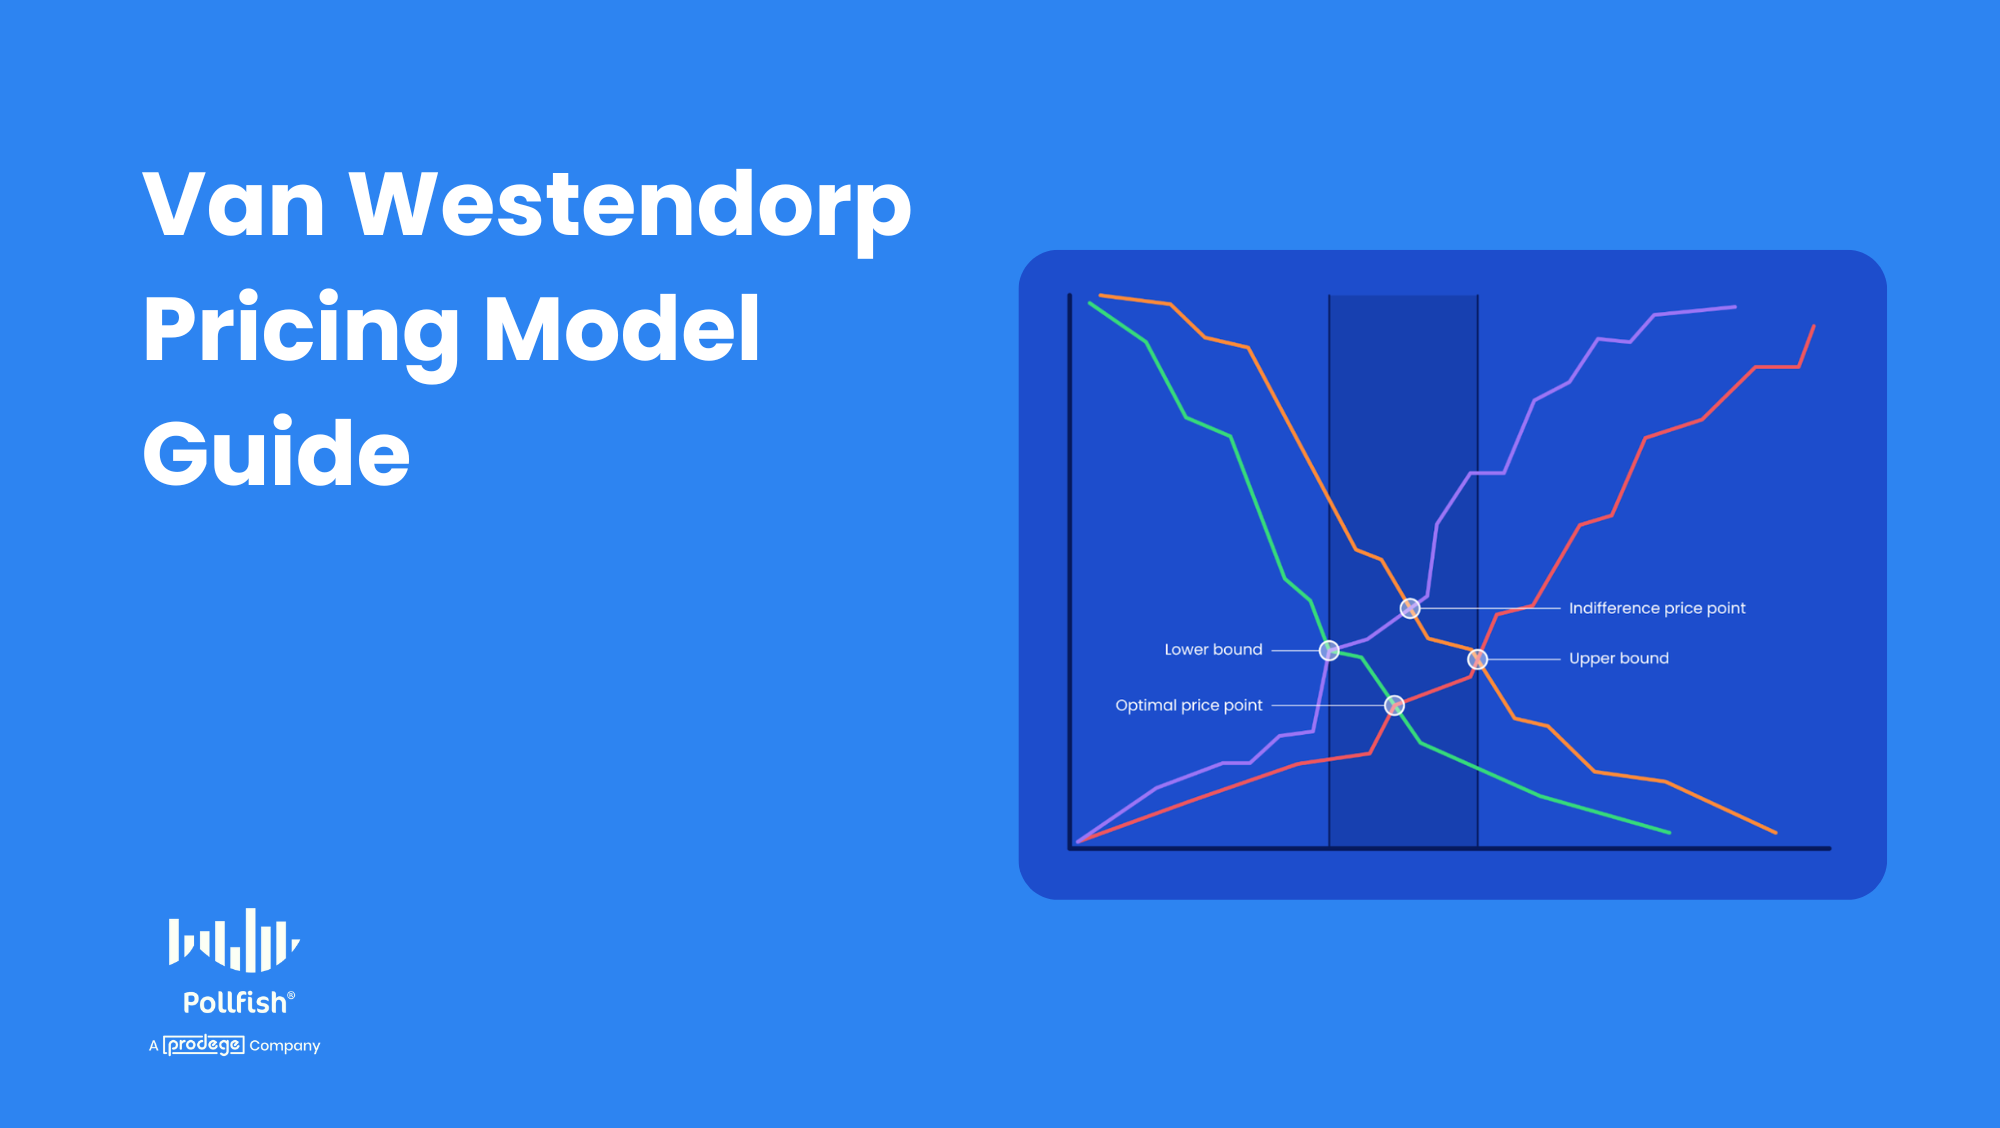
Van Westendorp Pricing Model: In-Depth Guide & How It Works
Pricing is one of the most critical decisions a business can make, yet many companies still rely on cost-plus formulas, competitor benchmarking, or gut instinct. These approaches amount to educated guessing and often lead to prices that miss what the market will actually accept.
The Van Westendorp model addresses this problem by offering a scientific approach to pricing. It aims to identify a psychologically acceptable price range, helping businesses make data-driven decisions that maximize revenue.
Based on our experience helping clients use the Van Westendorp model through our DIY survey tool, Pollfish, and our full-service offering fulfilled by our parent company, Prodege, we’ve heard several main questions come up again and again, so we created a guide on the topic.
In this article, we’ll cover:
- What is the Van Westendorp Price Sensitivity Meter?
- How the Van Westendorp model works
- Benefits of the Van Westendorp model
- Common use cases of Van Westendorp analysis
- Our Van Westendorp analysis offerings: DIY and full-service options
- How to use Pollfish (our platform) to conduct Van Westendorp analysis
Note: Sign up for a free Pollfish account, no credit card required, and launch your first Van Westendorp survey today. Or, if you’d prefer a hands-off approach, inquire about our full-service research offering. We’ll handle everything from survey design to analysis and reporting.
What is the Van Westendorp Price Sensitivity Meter?
The Van Westendorp model, also called the Price Sensitivity Meter (PSM), is a form of pricing research that asks respondents to state the prices they feel are too cheap, a bargain, expensive, and too expensive, revealing crucial psychological thresholds.
It is designed to identify a range of acceptable prices for a product. Its goal is not to pinpoint a single revenue-maximizing price, but rather to understand consumer perceptions of value and quality based on price.
The PSM model was originally introduced in 1976 by Dutch economist Peter Van Westendorp and is still a common market research tool to help with product pricing and development strategy.
How the Van Westendorp Model Works
Van Westendorp research begins by presenting the product or service to respondents through video, images, audio, or text description.
Next, respondents answer four survey questions:
- Too Cheap: “At what price would you consider the product to be priced so low that you would question its quality?” (This sets the price floor.)
- A Bargain: “At what price would you consider the product to be a bargain — a great buy for the money?” (This indicates a strong value proposition.)
- Getting Expensive: “At what price would you consider the product to be getting expensive, but you would still consider buying it?” (This signals the upper end of the acceptable range.)
- Too Expensive: “At what price would you consider the product to be so expensive that you would not consider buying it?” (This sets the price ceiling.)
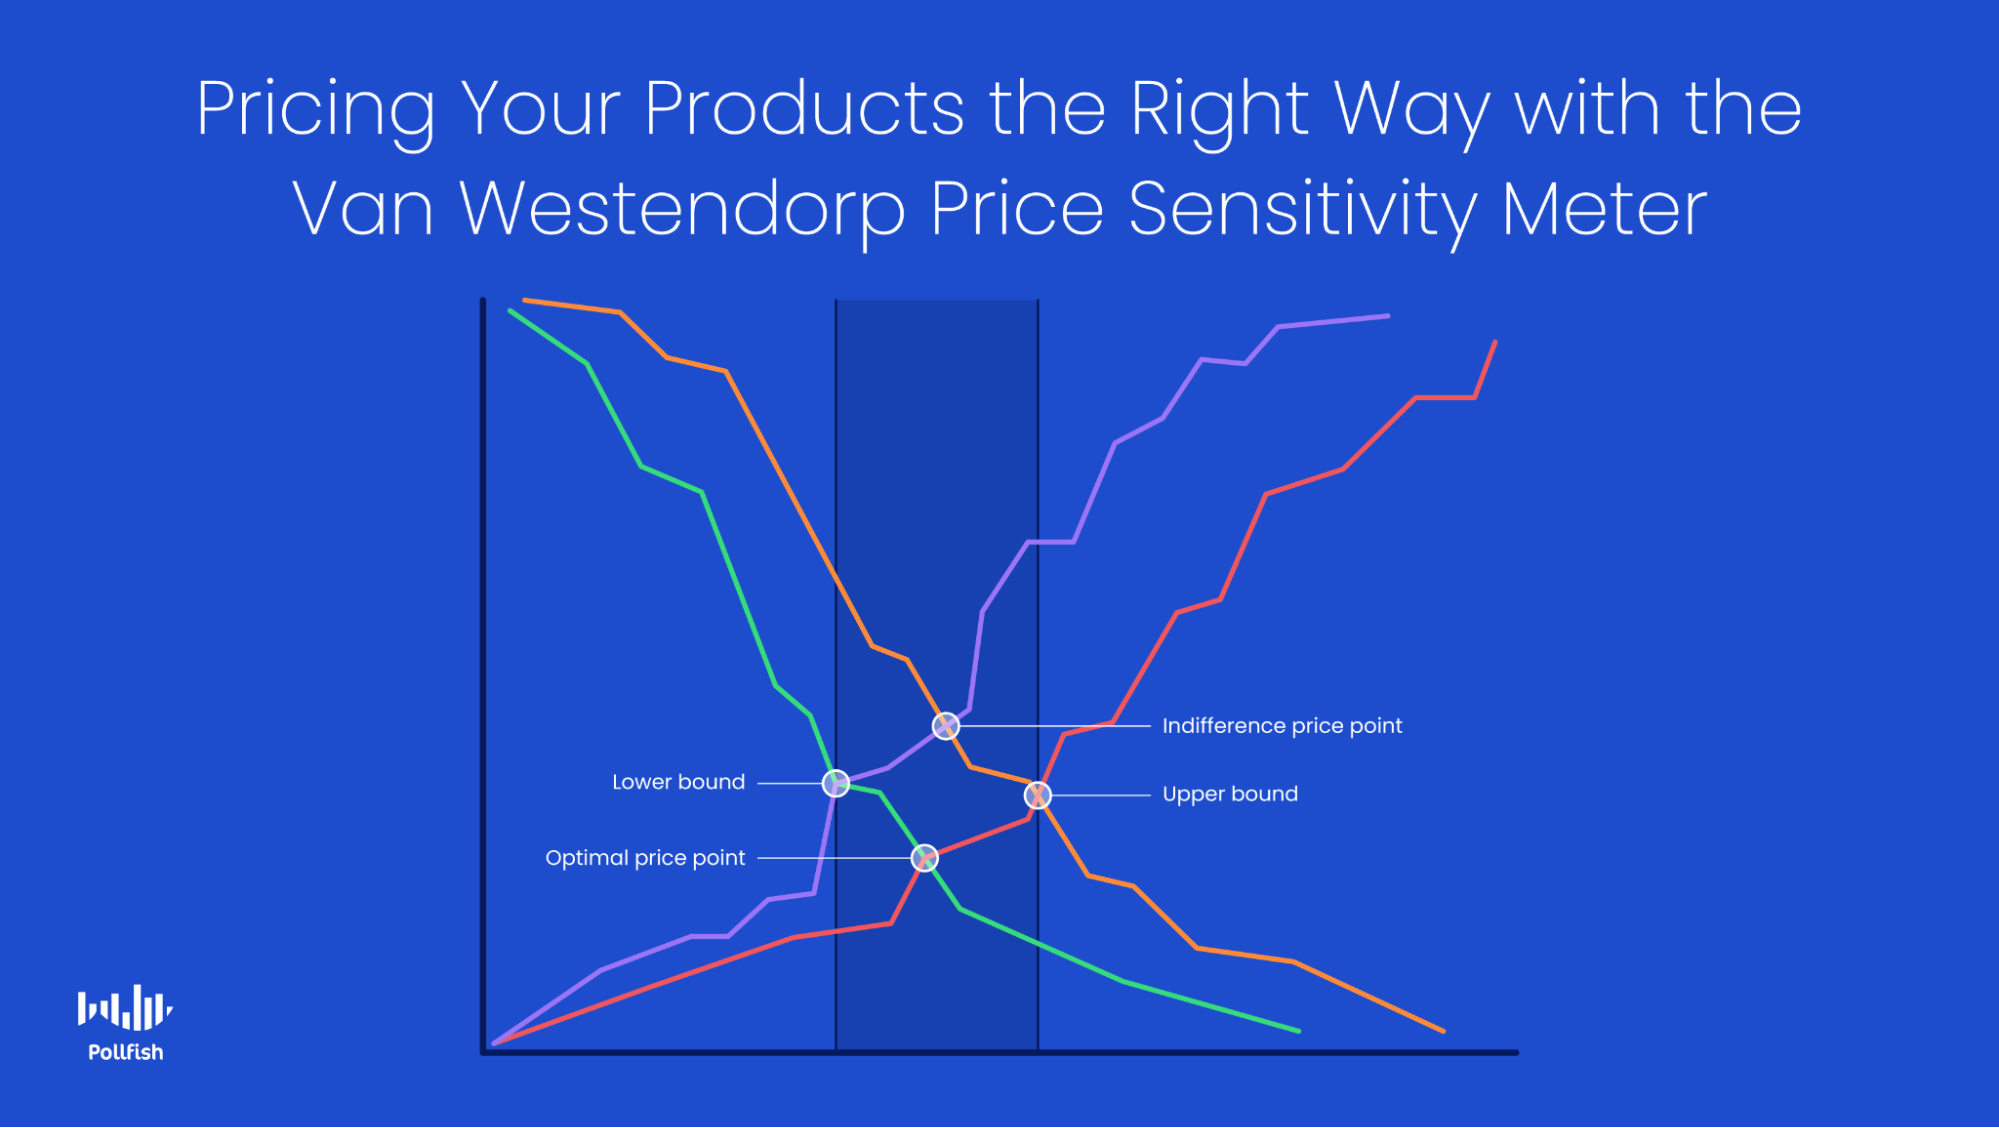
The cumulative frequencies for these four answers are plotted on a graph. Here’s an example:
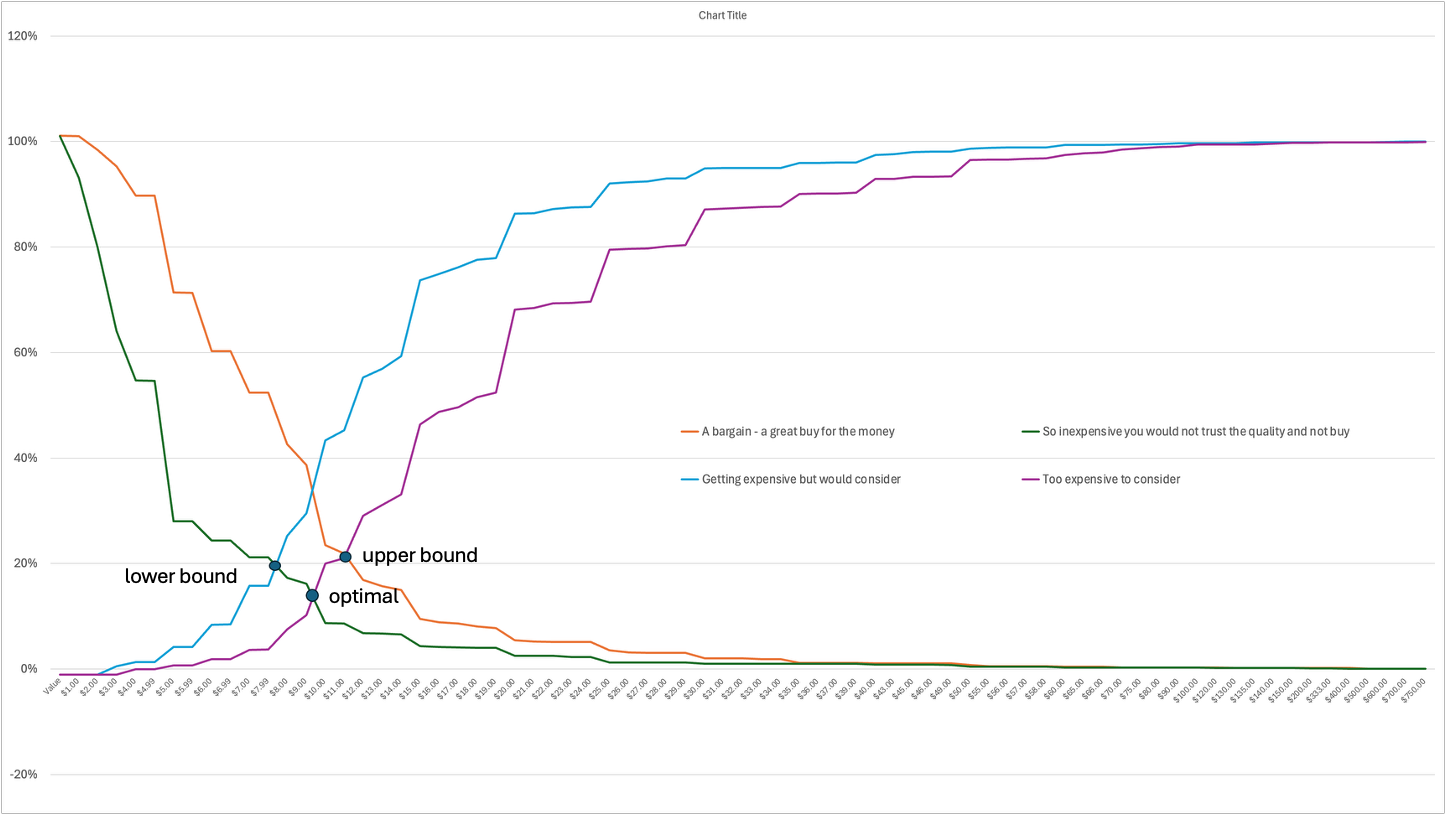
In this chart:
- The x-axis represents potential price points from low to high.
- The y-axis shows the percentage of respondents who associate each price with specific perceptions.
Highlighted are 4 intersection points, where lines cross. Analyzing each intersection point, we have:
- The lower bound price point: The intersection of the percentage of responses who believe that the product is so inexpensive that one could question the quality, and the percentage of those who believe that the product is getting expensive but they still might consider it (expensive). This is also called the Point of Marginal Cheapness (PMC).
- The upper bound price point: The point of intersection between the percentage of respondents who believe that the product is getting too expensive to consider and those who believe it is a bargain. This is the Point of Marginal Expensiveness (PME).
The price range between these 2 points is the acceptable price range.
- The optimal price point (OPP): Lies in the intersection of too cheap and too expensive. In other words, it is the price point where an equal number of respondents consider the price as exceeding either their upper or lower limits.
- The indifference price point (IPP): It lies in the intersection of cheap and too expensive. This is the price where an equal number of respondents consider this price point as either cheap or expensive.
Together, these data points give researchers a data-driven framework for setting prices that maximize perceived value while avoiding the pitfalls of pricing too high or too low.
Benefits of the Van Westendorp Model
✅ Identifying an acceptable price range
The Van Westendorp model’s output is a range of prices that the market will accept (not a single price). This gives you flexibility when choosing the final price of your product or service.
✅ Uncovering psychological perceptions
The Van Westendorp helps you understand your current and prospective customers’ thoughts and opinions on pricing and quality, so you can choose a pricing strategy that best aligns with them. This lets you:
- Avoid pricing your product too low (cheapening the brand) or too high (alienating the market).
- Maintain and increase your customer retention rate without raising your customer acquisition costs.
✅ Reliable primary research
The Van Westendorp model is a primary research method. It gathers direct customer input rather than relying on secondary data like competitor pricing — an approach that, while useful, often falls short in accuracy.
Common Use Cases for the Van Westendorp Model
✅ Launching brand-new, innovative products
If you’re launching a new product with no clear competitors or price benchmarks, the Van Westendorp model can help you determine a target price range instead of guessing.
✅ Entering a new market
When you’re unsure what customers in a new market will pay, the Van Westendorp model provides data-driven pricing guidance.
✅ Avoiding cheapening your brand by pricing too low
In industries like CPG and fashion, where low prices can signal poor quality, the VW model identifies the price floor below which customers question product quality.
This can help you make more confident pricing decisions.
✅ Establishing a baseline price range
Van Westendorp analysis works well as a first step in pricing research, establishing a baseline acceptable price range before conducting more detailed studies.
✅ Repositioning a product
When rebranding a product or adding new features, the Van Westendorp pricing method helps determine whether pricing adjustments are warranted and what the new acceptable range should be.
Our Van Westendorp Offerings: Full-Service and DIY Options
We offer two flexible ways for clients to perform Van Westendorp pricing research, each suited for different needs and budgets.
Option 1: Full-Service
Through our parent company, Prodege, we offer a full-service option for companies that benefit from hands-on support and expert guidance throughout the process, ensuring they get the most out of their Van Westendorp pricing analysis.
Flexible offering: We can handle the entire research process for you or just the specific stages where you need support, including survey programming, sample and fielding, data processing and analysis, and reporting.
What you’ll receive:
Our Van Westendorp deliverables typically include:
- A PowerPoint with a Van Westendorp price Elasticity Curve showing the four intersecting points:
- The Point of Marginal Cheapness (PMC)
- The Point of Marginal Expensiveness (PME)
- The Indifference Price Point (IPP)
- The Optimal Price Point (OPP)
- A separate slide with an explanation of the terms and a summary of the basic implications of the analysis.
- Additional deliverables tailored to your specific needs.
Why Prodege?
- Our team brings decades of collective market research experience, with members from firms like Hall & Partners, Ipsos, Kantar, Lieberman Research, Nielsen, and NPD.
- We give each project the attention it deserves. Every project includes both a dedicated sample manager and project manager, with additional specialists added based on your needs. This stands in stark contrast to other providers who spread their teams thin across dozens of accounts, leaving you to chase down answers and manage the details yourself.
- We’re deeply committed to data quality. Our in-house, 40-person Panel Support, Security, and Compliance department works to ensure the integrity of your survey data. To learn more, read our article on the 3 Survey Data Quality Issues Sabotaging Your Research (& How We Fix Them).
- We can help with other pricing research, too. Depending on your goals, the Gabor-Granger model or other pricing methodologies may complement your Van Westendorp analysis. Our team can help you determine which approaches best fit your needs.
Note: Visit our pricing page to learn more and inquire about our full-service market research option.
Option 2: DIY Survey Platform
The second option is to run your Van Westendorp pricing research through Pollfish, our DIY survey platform. Pollfish is renowned for:
- Exceptional survey data quality: We prioritize data quality above all else, employing rigorous safeguards to ensure your research reaches real audiences and delivers reliable insights.
- Transparent, pay-per-response pricing: Pricing starts at $0.95 per response, updating in real-time as you build your survey for full transparency. No subscriptions or hidden fees.
- Fast turnaround time: Survey results consistently come in faster than most competitors, typically in several hours for general audiences (e.g., U.S. grocery shoppers over 18 years old) or several days for more niche audiences (e.g., organic baby food buyers in New York City).
- Complimentary 24/7 support from seasoned market researchers: Our team is available to help you at any time with survey design, audience targeting, analysis, and more — at no cost.
We’ll explore these benefits further later on in the article (with customer quotes). In the next section, we’ll dive deeper into how to use Pollfish for Van Westendorp research.
Using Pollfish to Conduct Van Westendorp Analysis
Below is a brief overview of how you can conduct Van Westendorp pricing research with Pollfish.
❇️ Step 1: Open the Pollfish dashboard and hit “Create project” → “From template” on the upper-right side:

❇️ Step 2: Apply our Pricing study (Van Westendorp) template, which is pre-populated with the four Van Westendorp pricing questions, and optionally add any relevant multimedia (e.g., images)
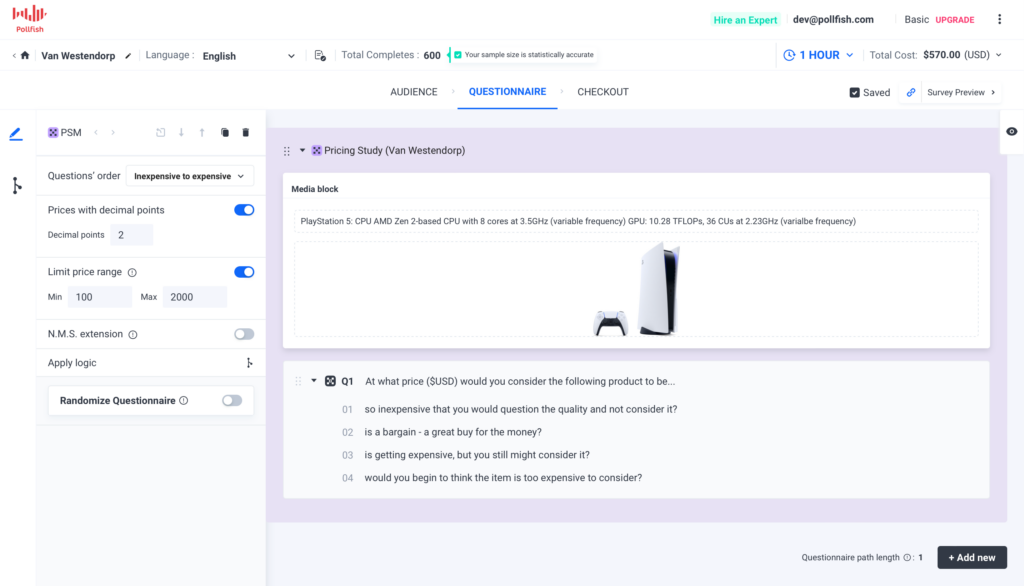
❇️ Step 3: Optionally, apply the Newton-Miller-Smith extension.
Optionally, you can add additional Newton-Miller-Smith questions, which ask about the likelihood of customers purchasing the products or services they were shown (and help determine whether there’s genuine purchase intent).
These questions will appear after the four Van Westendorp questions, and they work on a rating scale (e.g., “On a scale of 1–5, how likely are you to buy this product?”).
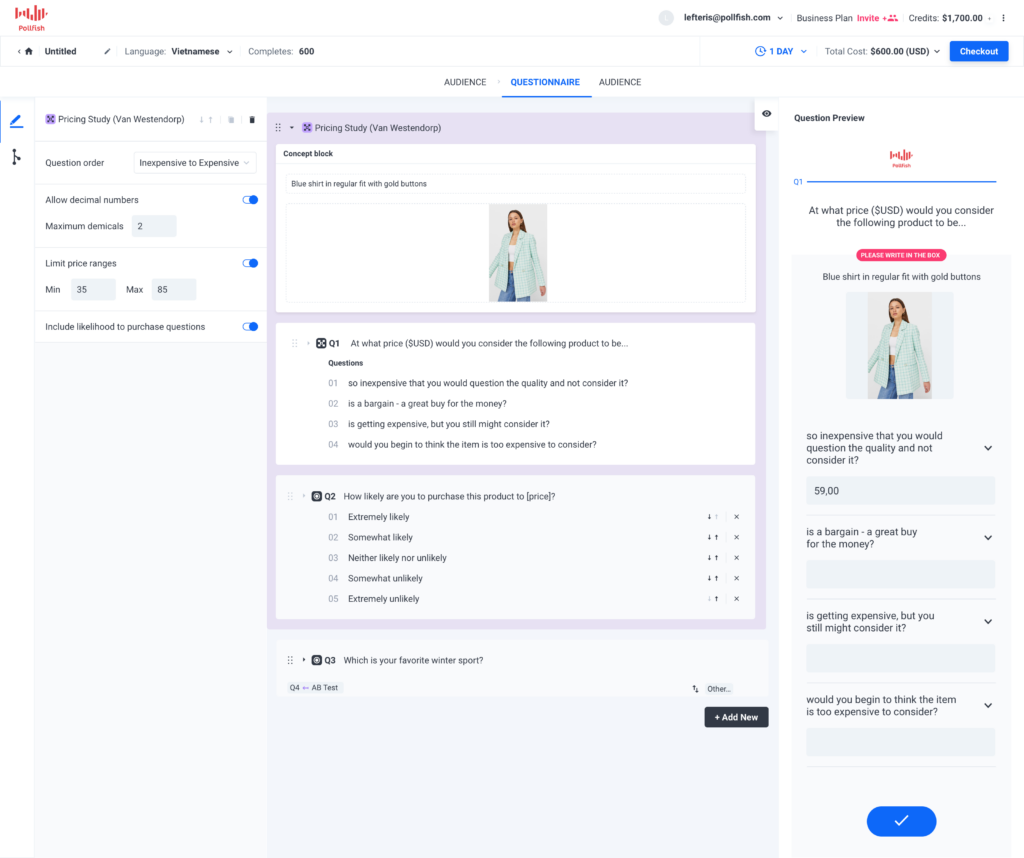
This optional extension is easy to apply and allows you not only to understand customers’ sentiments toward price points, but also to determine if they will actually buy the products.
❇️ Step 4: Optionally, employ conditional branching & other advanced survey design elements
By applying conditional branching, you can route respondents to relevant follow-up questions based on their previous answers, helping make your pricing study more relevant and personalized.
For example, respondents who indicated they would not be likely to buy your product at a specific price can be routed to an open-ended question asking for their reasoning.
Note: Learn more in our article on the best survey software with skip logic (and what makes Pollfish stand out).
Pollfish also supports other advanced survey design elements, including:
- Setting quotas
- Screening questions
- Shuffling answers
- Randomizing questions
- Multimedia questions (e.g., images or videos)
These are just a few examples. Whatever your Van Westendorp study requires, Pollfish has the features to support it. And if you have questions, you can always reach us 24/7 via live chat or phone.
❇️ Step 5: Choose your target audience
 Pollfish offers extensive audience targeting options:
- Targeting filters: Choose from 50+ targeting filters in 6 categories, including Demographics, Geographic Criteria, Consumer Lifestyle, Employment & Occupation, Behavioral Data, and Media.
- Audience templates: Speed up the setup process with pre-configured audience templates for common segments, including Adults 18+, Expecting Mothers, Gamers, Moms, Pet Owners, and more.
- Audience quotas: Define exactly how many respondents you need from each demographic group — age brackets, regions, income levels, and more — to ensure your sample reflects your target market.
- Behavioral filtering: Target based on verified shopping behavior, including specific retailers visited (e.g., Walmart, Costco, Target) or products purchased (e.g., Ruffles, Dr. Pepper, Angel Soft, Tabasco). Pollfish panelists upload purchase receipts, providing verified behavioral data for accurate targeting and reliable research outcomes.
❇️ Step 6: Analyze your results
Here’s what the Van Westendorp Price Sensitivity Meter looks like within Pollfish:

You can easily filter by demographic or custom groups to slice your dataset exactly how you need it.
With Insights Builder (available for high-volume users), you can create custom multi-variable charts, run statistical tests, and export report-ready visuals in your brand colors, all without leaving the platform (and far faster than wrestling with Excel).
You can utilize Insights Builder for Van Westendorp analysis or other survey types:
Benefits of Pollfish, Backed by Customer Quotes
As we’ve explored, Pollfish lets you run sophisticated Van Westendorp studies without sacrificing survey design flexibility or advanced features. Setup is intuitive regardless of research complexity.
Beyond robust Van Westendorp capabilities, Pollfish also offers additional advantages for pricing research, which we explore below, backed by customer feedback.
Rigorous Data Quality Measures
At Pollfish, data quality is our top priority. We’ve built our reputation on delivering reliable insights you can trust. Learn more about our approach in our article on 3 Survey Data Quality Issues Sabotaging Your Research (& How We Fix Them)
As several customers shared on Trustpilot:
“The most important point to make is that I trust the responses of my survey. My target audience was very specific and I could tell that the responses were legitimately coming [from] subjects in my target audience.”
– Read the full review here
“Each time I use this service I am blown away by the speed with which the responses come in and with the detail which most of them include. You can tell that the respondents take this very seriously. They must really enjoy doing it.”
– Read the full review here
Transparent Pay-per-Response Pricing Model
Our pay-per-response pricing is refreshingly simple: you only pay for completed responses, with no monthly subscriptions or hidden fees. Before you even sign up, you’ll know exactly what your survey will cost. Our real-time pricing calculator updates as you build, so there are zero surprises.
Want to learn more? Check out our pricing page for details.
As several customers shared on Trustpilot:
“They charge based on the completed response. It is very fair and transparent. As a researcher, I have used many survey platforms, but they are the best so far.”
– Read the full review here
“The dollar amount they quote you in their cost calculator tool, and the number they show when you’re developing the survey, is the number you pay. I was burned multiple times by [competitor] charging me unexpected amounts and making it difficult to quit an expensive subscription. I’m so happy to have found Pollfish as an alternative. Their support team also responds VERY quickly to chat messages and has been tremendously helpful the few times I had questions.”
– Read the full review here
“The pricing is clear and transparent from the beginning. The results come quickly and can be downloaded in different formats and with different filters. What we like most is the ability to filter the results and analyze them separately for each segment. We highly recommend this platform.”
– Read the full review here
Fast Turnaround Time
Because we operate our own first-party audience panels, we deliver incredibly fast turnaround times. General population surveys (e.g, U.S. adults 18+) can be completed in just a few hours, while more niche audiences (e.g, Households with an income of over $100,000 and children under 5 years old) naturally take several days or longer.
Review for a general population survey:
“I needed a 25 question survey answered, and was able to get 500 completed surveys in 8 hours with Pollfish. The presentation of the results is very impressive and the demographics information Pollfish provided is invaluable.”
– Read the full review here
Review for a specialized niche:
“I’m amazed at how quickly the platform was able to deliver rich, segmentable data from over 500 respondents. I had feature-ready insights in only 3 days.”
– Read the full review here
Complimentary Customer Service From Seasoned Market Researchers
Beyond basic technical support, our team offers complimentary advanced guidance on survey design, audience targeting, and data analysis — all available 24/7 via chat or phone, including evenings and weekends.
As some of our customers mentioned on Trustpilot:
“The customer service team is super responsive too for those more complex enquiries about the tool and criteria. All in all this experience has been way easier (and cheaper) than any other ‘big players’ out there.”
– Read the full review here
“I love this product. I feel like it gives me enterprise grade market survey tech at a consumer price. Highly recommend. I love how responsive the customer support team is.”
– Read the full review here
“The customer service I received was fantastic. Brilliant guidance that helped get high-quality results. I was really pleased with the outcome and highly recommend using them.”
– Read the full review here
Intuitive, Easy-to-Use Platform
Pollfish is incredibly easy to use, whether you are a total beginner or a seasoned researcher. In addition to our flagship intuitive, step-by-step survey builder, we offer a number of features to make market research faster and easier, including:
- A library of survey templates for Van Westendorp methodology and other common use cases. (Learn more.)
- AI Survey Builder that lets you build and customize a complete survey in minutes through a conversational chat. (Learn more.)
- AI Reports, which auto-generate stakeholder-ready analysis of your survey results in minutes. (Learn more.)
As several of our customers noted:
“Pollfish is probably the single easiest software I’ve ever used. The drag and drop builder is great itself, but the template library also has anything we ever need, so you rarely have to design anything from scratch. The templates are also designed very well, we usually pick one, do a couple edits, and deploy. The whole thing takes less than 10 minutes.”
– Read the full review here
“The surveys were easy to set up, allowed me to select my very specific target and launched right away. Within a couple of days I had my results in an easy to interpret, actionable format well within my budget.”
– Read the full review here
“I have used this platform ~10x over time and find the process easy, their review process helpful, and the insights I get from people valuable as I work through different product concepts in market research. Their pricing is more reasonable than other competitors I’ve looked into, and am happily going to continue using Pollfish.”
– Read the full review here
Learn More About Our Van Westendorp Analysis Offerings
We invite you to:
- Create a free Pollfish account to explore our DIY survey tool.
- Inquire about our full-service offering, fulfilled through parent company Prodege.