
River Sampling Versus RDE Sampling: Which is Superior for Market Research
River Sampling Versus RDE Sampling: Which is Superior for Market Research

River sampling versus RDE (Random Device Engagement) sampling: it’s a showdown for the ages. As two of the foremost players in survey sampling methods, these two always appear to compete head-to-head for the attention and execution of market researchers.
As prominent players in the survey research sector, both the RDE and river sampling methods are considered superior to using survey panels for market research.
As the two dominant means of obtaining a survey sample, which forms the core of any market research campaign, it is crucial to be diligent when deliberating over which method to use for your survey sampling.
This article posits river sampling and RDE sampling in a showdown, so that market researchers and general researchers comprehend which is more fitting for their market research needs.
Defining River Sampling
River sampling is an online survey sampling method — the earliest and simplest of its kind. This non-probability sampling method obtains survey respondents by requesting online visitors to take a survey via clicking on a link that routes them to the survey.
The link is placed somewhere in a webpage, email or another area in the digital space. Typically, respondents are scouted through web elements such as banners, ads, promotions and offers.
When site or app users click on the link used in river sampling, they are first routed to the screener portion of the survey and if they fit the requirements set in the screener, they are then routed to the questionnaire portion.
River sampling derives its name from the metaphorical idea that researchers net their study subjects by catching them in the river that is the internet, specifically the flow of traffic in a website.
Also called intercept sampling and real‐time sampling, this method extracts respondents by engaging them while they take part in some other digital activity.
The Two Types of River Sampling
River sampling exists in two forms. While they may appear to be vaguely interchangeable, each form includes a unique method for procuring respondents. In the showdown of river sampling versus RDE sampling, it’s important to understand the workings of each.

Stratified River Sampling
This kind of river sampling involves drawing samples in real-time from online promotions, those that are disseminated through banners, ads, pop-ups and hyperlinks. Market researchers would choose the websites for survey deployment based on statistics on such websites’ traffic.
Convenience River Sampling
This submethod of river sampling involves the placement of promotions and hyperlinks across websites without previously analyzing the websites’ traffic numbers and types of visitors. As such, market researchers deploy surveys in a completely blind manner. The point of this form of sampling is to derive maximum data at a minimum cost.
The Pros and Cons of River Sampling
A commonly used method of sampling respondents, river sampling has several advantages and disadvantages. Understanding them is important for researchers, should they consider using this method, or learning how it differs from other sampling methods, such as RDE sampling.
The Advantages
- Serves as a powerful replacement for survey panels by providing new respondents, those that have not been influenced or conditioned to take part in a survey.
- Engages users in their natural digital environments.
- Its survey callouts/ links exist in easily noticeable digital properties.
- Creates a faster alternative to the focus group, which involves a group discussion where dominant participants can take charge and make it difficult for more demure participants.
- Ensures complete anonymity of respondents.
- Exists as a simple method of data gathering, since all researchers need to do is wait for the data to be aggregated.
- An inexpensive source of sampling.
- A flexible method that collects respondents in the moment, rather than being profiled prior to the survey and recruited manually.
The Disadvantages
- The devices used by potential and opted-in respondents are completely unknown.
- There is no access to an advertisement’s ID.
- Fraudsters can therefore take the same survey twice or more to increase their incentives or the chance to win a prize.
- No degree of demographic, geographic or individual targeting is possible.
- Banner ads generally have insufficient response rates.
- Banners are pushed through ad networks, diminishing the user experience.
- Ad-networks optimize their delivery by fighting against random sampling.
- As such, users are picked due to a higher likelihood of responding, from unobserved variables (to the researcher) correlated with how they will respond. At any rate, none of the data is shared, so it is impossible to correct.
- It is difficult to reach an acceptable level of representation, as respondents are not tracked.
- Surveyors have no inkling of who will participate in the surveys due to the lack of tracking and profiling.
- This method is prone to receive straight-lining from the respondents.
Defining RDE Sampling
RDE sampling, also known as Random Device Engagement is an advanced method of non-probability sampling, one that falls in diametrical opposition with survey panels. It is completely random and organic, with no pre-recruitment and no website monitoring.
RDE sampling refers to the sampling practice of engaging online users on all the devices they are already using, be it within advertising networks, mobile apps and other portals on various devices.
This involves the careful placement of surveys in gaming interfaces and virtual reality, allowing market researchers to offer non-monetary incentives to respondents. These include coins or points in a game, or the ability to win a major virtual in-game prize.
RDE sampling can be disseminated through digital elements similar to the ones used in river sampling, such as banners, ads and other positions on a webpages, such as buttons. These survey callouts e.t. al., must be placed strategically, so that respondents can easily spot them. They must also be created in a way that sparks the curiosity or interest of the webpage’s visitors to click on them in the first place.

RDE engages potential respondents in their natural digital environments and respondents enter the survey voluntarily. This method also ensures complete randomization, as no pre-recruiting efforts are involved.
Respondents are also completely anonymous, in terms of their identities, thus, there is no pressure to answer questions in a particular way, such as one that adheres to societal norms and expectations.
The Key Differences Between River Sampling and RDE Sampling
Many of the traits in RDE sampling render this method to seemingly mimic river sampling, with no apparent distinguishing features. But this is false — there are several ways in which RDE sampling diverges from the river sampling method.
Unlike river sampling, RDE sampling offers a monitoring functionality, which tracks the unique identifier of respondents’ devices. The survey software that carries out RDE sampling works natively with the device when it is optimized correctly. For example, a strong example of this would be a mobile-first survey platform.
Furthermore, unlike river sampling, in which respondents are not tracked or identified by demographics, etc., RDE tracks respondents through a unique ID, one that notifies the researchers when the same respondents are changing devices.
RDE also relies on artificial intelligence to weed out poor quality responses, such as gibberish answers and users who are on a VPN.
The Pros and Cons of RDE Sampling
Random Device Engagement sampling carries various benefits and drawbacks that all market researchers should be aware of, even if they do not choose this sampling method. That is because it is critical to weigh these advantages and disadvantages against those of river sampling for a true comparison.
The Advantages
- A higher quality of data due to AI functionality and automatic quality checks.
- Respondents are not conditioned through pre recruiting tactics or pressured to answer questions in a certain way due to being in their natural digital environments.
- Offers various telemetry data prone to bias correction, involving location history and application usage.
- Has a high coverage due to the heavy usage of mobile phones; phones carry a high penetration of about 70% and decent response rates.
- Avoids fraud from SUMAs (single users on multiple accounts); respondents can only answer once and therefore VPN respondents are disqualified.
- Tracks different devices that respondents use, important given the uncertainty of the future use of phones.
- RDE is fast and cost-effective.
- Able to supplement attitudinal data with a vast array of para or telemetry data.
- For example, those who partake in surveys are rather different than those who don’t. As such, it is necessary to get roughly 30 more demographic, attitudinal, and lifestyle questions to understand social trust and how survey respondents are unusual.
The Disadvantages
- Given that this method involves tracking location and application usage, it is not as anonymous.
- In reference to Point 1, the researchers will have to add the necessary disclaimers to their surveys.
- Surveys on RDE networks may not exist in as diverse a set as they do in river sampling.
- Is still prone to several kinds of survey bias.
- Does not offer perfect coverage or known probabilities for every respondent.
- Respondents may be subject to survey fatigue if the survey is too long and not built with best practices.
The Verdict of the River Sampling Vs. RDE Sampling Showdown
In conclusion, who comes up victorious in the showdown between river sampling and Random Device Engagement sampling? In the spirit of remaining unbiased, the true victor is up to the market researcher, the business owner, or the marketing department of a business.
This is because each business and operation will envision their market research campaigns differently and thus will have different requirements and standards for their campaigns. This includes how they will execute survey sampling.
Both methods secure the privacy of respondents, as respondents are never matched with their identities. However, the major point of difference between these two methods is that river sampling does not capture the devices and app usage of the respondents, while RDE does, given that it tracks respondents through unique IDs.
Thus, when using either of these sampling methods, they will have to be dealt with differently.
In regards to this, market researchers can make the judgment of which sampling method is best. We believe that based on the better data quality and representativeness of the sample, RDE is the superior survey sampling method.
With river sampling, researchers must assess the stability, span and relevance of the promotions used in tandem with the surveys. Additionally, market researchers will need to check security and quota controls during the sampling process. SIngle users participating multiple times must be thwarted with specialized software.
With RDE sampling, the online survey platform must cooperate with the publishers and their networks, so that market researchers can design a native experience with surveys on their platforms. (In river sampling, banner ads are pushed through the ad network instead). Thus, RDE sampling is objectively the stronger sampling method, given that it seamlessly prevents fraud and poor data from its capabilities of tracking down device usage and fending off VPNs, users take part more than once and other nefarious behaviors that mar the data and sample collection process.
[wp-faq-schema accordion=1]

How Surveys Improve Content Marketing Strategy
How Surveys Improve Content Marketing Strategy

To survive in the modern age, your business needs a solid content marketing strategy. Content speaks volumes about a business — and not solely about business offerings. Rather, it gives marketers the chance to posit their business as a thought leader in their space.
Surveys help businesses on a variety of matters, one of which is enhancing content strategy, proving the vast extent of the aptitude of survey research. This is largely due to the ability to extract unique and concrete insights from your target market.
This article explains how surveys improve a business’s content marketing strategy and the various times most apt for using surveys.
Defining Content Marketing Strategy
Many marketers believe that content marketing strategy involves posting a blog every week — and that is where they are regrettably mistaken.
While blogs are key content components, they are far from the requirements of a content marketing strategy.
As its name indicates, content marketing strategy is a strategy designed for the subdiscipline known as content marketing.
Content marketing must always be strategic in its approach in order to yield any results. As such, the basis of its strategy includes creating and delivering valuable content. Moreover, the content must be relevant, timely, consistent and interesting to attract and maintain an audience.
After all, when your content allures your target market, its members are more likely to view your content, i.e., give you impressions. The more impressions you gain, the more likely you are to produce conversions.
But businesses shouldn’t focus on one-time conversions, as customer retention is more valuable than customer acquisition. For example, there is a 60-70% greater success rate in selling to existing customers than new ones.
A strong content marketing strategy allows brands to increase customer retention and surveys contribute to this. This is because it is favorable to use surveys for customer loyalty.
How Surveys Improve Content Marketing Strategy
As aforementioned, putting surveys to use can help businesses develop the highly sought-after objective of customer loyalty. But before you create enough campaigns and measure customer satisfaction with surveys, you need to build customer loyalty from the ground up (or enhance it if you are a seasoned business).
Surveys can help you do just that.
There are several ways surveys help aid your content marketing strategy. The foremost benefit of surveys is granting your business with customer data, the kind that comes directly from them, rather than being based on trends and other data you would extract from secondary research.
While the latter is useful and can help you form aspects of your content strategy, it is only a small aspect of building effective survey studies for valuable market research.
Surveys, on the other hand, empower your market research and by extension, your content marketing strategy, as they provide insight at virtually any stage in your overall market research campaign.
Although survey research is conducted following secondary research, it can be the starting point of your research campaign as well. For example, exploratory and descriptive research are conducted to lay out a problem and situation along with its hypotheses and details, before studying correlations, causes and solutions.
These early research surveys are useful in setting up your content marketing campaigns, as they provide you with the key problems and settings of your target market and niche.
Let’s pore over the specifics of survey benefits for content marketing strategy.
What Surveys Measure for a Content Marketing Strategy
Surveys are NOT the end all be all when it comes to market research for your content marketing strategy. They do, however, offer several benefits. These manifest in the kind of data you can extract for your content marketing needs.
The following lists the things that surveys help businesses measure:
- Key demographic, behavioral and geographic information of respondents. These help you perform market segmentation to understand the precise makeup of your target market and its individual segments.

- Opinions about your business. This is an encompassing topic that covers everything from their customer experience (CX), to perceptions about your ads and communications, to feelings about your customer support.
- Thoughts on your industry and niche. This helps you form content ideas. For example, let’s say you sell apartments in a particular area. A community survey can reveal the biggest qualms and desires your target market has about a particular neighborhood or real estate business (in relation to apartments) in general.
- Impact of your content: You can create surveys about particular content assets and content elements. This helps you learn which assets are resonating, which are lackluster and what kind your target market is most interested in reading/consuming.
- Reactions to competitor content: You can be discrete in these surveys, i.e., not mention competitors by name. Instead, you can create surveys that ask about specific content aspects, including comparisons with your own.
- Insights into customer pain points: Understanding the pain points of your target market is ideal for all business practices, especially for products/services, as you can market your offerings as anecdotes to customers’ problems. Additionally, you can use customer pain points as the foundation for various content assets.
- Ex: blogs, case studies, reports, etc. can all address pain points but their value lies in positing your business/product/service as the solution to those pain points.
- Social media reactions: Surveys allow you to inquire into the sentiment around your social media experience. You can be upfront in your questionnaire by asking respondents which posts are boring, which provide the least amount of value and which they enjoyed reading or viewing.
- Customer expectations: These can waver, especially as customers come and go. Surveys grant you direct insights into what customers desire, which you can later use in your content marketing efforts. Content that speaks to customer needs and feedback generally reaps positive results.
What Surveys Help You Discover for Content Marketing
Aside from the above section, which delineates the customer insights surveys can provide from your content marketing strategy, surveys can do so much more. Surveys animate your content, as they can provide you with original content, the kind your competitors won’t be able to reproduce.
Here are several ways surveys enliven your content marketing efforts:
- Building brand awareness: As aforementioned, when more people view your content, i.e, when you generate more impressions, the likelihood of netting converting customers rises. Additionally, the more content you create, the more you have to update your social accounts with.
- Branding: Branding is all about your reputation, brand image and presentation. As such, it is almost always present in content (think logos, company colors, taglines, etc.). Surveys provide market research for branding, so you can make any necessary tweaks to your branding based on customer feedback. These will thus naturally bleed into your content.
- Data-driven content: Surveys don’t necessarily have to be about customer feedback in relation to your business. Survey campaigns foster exploring a variety of topics within your niche. The best part is that no one can copy the data you extract for this content and claim it as theirs — they’ll have to give you credit and link to your content.
- SEO Benefits: Piggybacking off of point 2, when other companies, blogs and websites link their content back to yours as their reference, it is fruitful for your SEO. Gaining backlinks is difficult, but when you release original, data-driven content, others will reference your work and link back to your website or webpage that contains the insights.
- Additionally, search engines like Google admire long, insightful content pieces.
- Establishing thought leadership: Posting content with original insights is invaluable for establishing thought leadership and credibility for your company. Brands with thought leadership are fostering a strong sense of trust with their target market. It also keeps a company fresh in the minds of its target market.
When and Where to Use Surveys in Your Content

In order to master a content marketing strategy, businesses need to deploy them, well… strategically. You don’t want to bombard your respondents with surveys left and right; that will damage your digital CX. In order to sustain high survey response rates, you need to release surveys at appropriate times and places.
The following lists when and where to use surveys in your content to boost your strategy:
- Blogs, webzines, evergreen posts
- When: On a weekly basis
- On the homepage or first page a special user lands on
- When a user returns to your website after several visits OR
- When a user bounces but returns some other time or day.
- Landing pages
- When: On a weekly basis, so long as the landing page is live OR
- Once, if a user converts, i.e., signs up for a service, or joins a content list.
- Reports, whitepapers and other gated and downloadable content
- Just once for authorized respondents, those that leave their real names and emails.
- Publisher sites
- Daily
- This helps expose random users to your brand who may have otherwise not known about it.
Positioning Your Brand in the Way You Intend With Surveys
Your content marketing strategy is an opportune way to not only nurture your leads further down the sales funnel and grow brand awareness. Instead, it sets the tone and style of your brand, allowing you to position it in the way you seek.
Surveys are an apt means to support this end, as surveys allow your content to posit you in a desirable light, one that differentiates you from your competitors.
They show your customer base that you care and value their feedback, not just about delivering good products/ services, but for a productive content experience, one that offers value instead of thinly valued brand propaganda.
A strong content marketing strategy will ensure your brand is considered a trusted resource, the kind that draws continual interest and impressions from your target market. Surveys are auspicious tools to help you reach this end. The key to using surveys as a content marketing strategy conduit is to use the most robust online survey platform.
[wp-faq-schema accordion=1]

How to Conduct Exploratory Research for Your Early Research Needs
How to Conduct Exploratory Research for Your Early Research Needs

Exploratory research is one of the main types of general and survey research. It works to investigate an issue, occurrence or phenomenon that is not clearly defined.
The most preliminary form of research, exploratory precedes descriptive research, another early survey research campaign.
As such, market researchers and virtually all other researchers need to incorporate exploratory research in their market research campaigns, as they would be remiss to not fully comprehend a problem before probing further into it or attempting to fix it.
This article examines exploratory research, what makes it up, how to conduct it, how it differs from the other main forms of research and the kinds of surveys to use to carry out this research.
Defining Exploratory Research
Exploratory research is defined as an initial form of research that studies a hypothetical or theoretical idea, that is, one which has not yet been fully developed, let alone proven.
As such, this research begins with a researcher’s idea about something within their sphere of study; for example, they’ve noticed interest around their brand has fallen in a particular quarter.
The researcher will thus use exploratory research to gain a better understanding of this unexplored idea, prove that it exists in significant ways/amounts and study other issues surrounding it.
The issues and other details that they discover can be carried over as the focus for future research campaigns, namely descriptive research, as the next logical type of research.
Exploratory research is defined as a research used to investigate a problem which is not clearly defined. It is conducted to have a better understanding of the existing problem, but will not provide conclusive results.
Also called grounded theory approach or interpretive research, exploratory research helps answer questions like the “what,” “why” and “how.”
The Key Aspects of Exploratory Research
Now that we have established the core meaning and function of exploratory research, it is critical to understand its makeup. This form of research has various qualities researchers ought to look into, to better understand its characteristics.
The following enumerates the key features of this research:

- The initial form of research around a particular subject of study.
- Lays the groundwork about a study for future research.
- Investigates an issue that is not fully defined.
- Gathers information that can be explored in more depth in descriptive research.
- Exists in two forms: Via a new topic or via a new angle
- A new topic is usually unexpected and provides startling findings.
- A new angle arises from different ways of looking at things, either from a theoretical perspective or a new way of measuring something.
- Enables a researcher to answer foundational questions such as: What is the problem? What is the purpose of the research? What topics should be studied?
- Exploratory research uses unstructured studies.
- Involves forming a few theories which can support its findings to make it easier for the researcher to assess them.
- Typically involves yielding qualitative research.
- Can produce quantitative research that can be used to generalize larger samples in certain cases, such as through the use of experiments and quantitative surveys.
Why Your Business Needs Exploratory Research
Businesses need exploratory research for a variety of reasons. Firstly, this research method uncovers details and facts about a murky subject — the kinds that a business hasn’t previously known about.
It sets the foundation for understanding a problem, occurrence or phenomenon by finding its basic properties. This ensures that a business finds the right information (such as the variables) which can be further studied in descriptive, correlational and experimental research.
Although it rarely provides enough insights to make conclusive business decisions, it forms the basis of a research issue on which businesses can set up objectives and requirements for continual studies.
After all, a company cannot conduct further research around a topic, without assuredly knowing about its existence and certain characteristics that warrant further exploration.

With exploratory research, businesses extract:
- The groundwork for other types of research
- Key facts about matters critical to their business
- Opinions from their target market
- The existence of specific market segments (via market segmentation)
- An understanding what is worth pursuing for survey studies and other research
Exploratory Research Survey Examples
- The qualitative survey
- Helps answer the what, why and how with open-ended questions.
- Extracts key high-level information in depth.
- The cross-sectional survey
- Studies a particular population at one particular point in time.
- Can help form a hypothesis of for example, shopping behavior during a seasonal campaign.
- The customer experience (CX) survey
- Finds foundational insights on customers’ CX.
- Finds glitches and other issues in a customer journey that a business was not aware of.
- The employee feedback survey
- Finds unknown employee sentiment around various areas of business.
- Useful during mergers, acquisitions, growth spurts or simple quarterly reviews.
- The business survey
- For general inquiries, understanding the high level details.
- Although it can be used for other forms of research, this survey can help identify a problem.
How Exploratory Research Differs from Correlational, Exploratory and Experimental Research
Exploratory research differs significantly from the other main types of research methods such as correlational research and experimental research.
However, exploratory research is often conflated with descriptive research. Although both forms of research are conducted in the early stages of the entire research process, they are not the same, as they bear key differing qualities.
Exploratory research provides the foundation, hypothesis or discovery about a problem the researcher suspects is present. Thus, it is the very first form of research required to conduct over an unstudied or unknown topic.
Descriptive research, on the other hand, is predicated on describing something already established, discovered or suspected in exploratory research. Thus descriptive research follows exploratory research in the overall research process. It describes characteristics, functions, occurrences, frequencies and other required key facts before the researcher moves to correlational or experimental research.
Descriptive research, as opposed to exploratory research, is conclusive. It is predominantly quantitative and fixed on creating statistics. It is also rigid and structured, while exploratory research is flexible and unstructured.
Correlational research differs from exploratory research in that it is one of the latter forms or research, whereas exploratory is the most preliminary kind.
It processes well-established information that exploratory and descriptive research have found. Its primary function is to uncover relationships among variables to see how one may affect another or others.
The results of correlational research can be used to make predictions of future events from present insights.
Experimental research contrasts with exploratory research, in that it is also one of the latter forms of research, if not the very final. Unlike exploratory research, experimental research is far less observational or passive. Rather, as its name hints at, it is highly experimental, as it uses a scientific approach on two sets of variables.
Using a scientific research design, it forms experiments to find cause-and-effect relationships between defined variables. Also called hypothesis testing or a deductive research method, itis conducted in a controlled environment so that variables can be measured, calculated and then compared. .
Experimental research involves manipulating variables to come to a conclusion or finding. It helps find conclusions to an original subject of research or answers to a previously discovered problem in exploratory research.
The Advantages and Disadvantages of Exploratory Research
Exploratory research offers several benefits for researchers and businesses. However, as with all other research methods, there are a few setbacks to this type of research.
The Advantages
- Enables further research on an established issue.
- Unstructured, allowing the researcher to be flexible in their study.
- A low-cost form of research.
- Allows researchers to decide whether a topic is worth studying further or not.
- Can save valuable time, money and resources, if a discovered topic is deemed unnecessary for further research.
- Helps researchers in the early stages of discovering the cause of a problem.
- Points researchers to an objective or signals researchers to avoid some.
The Disadvantages
- Qualitative data, the main kind of data derived from exploratory research, can be easy to misinterpret when generalizing a population.
- Although it steers further research, it is inconclusive.
- Although it can be used in different survey sampling methods, it usually involves using a smaller sampling pool, making it inept at generalizing populations.
- When collected via secondary sources, the data may be outdated and thus not fully accurate with the present.
How to Conduct Exploratory Research
This form of research is known to be unstructured, so there are no hard and fast rules on how to conduct it, as long as it adheres to its key aspects. The following explains the basic universal approach for conducting exploratory research.
- Identify the problem: The core of the research, this may take a few brainstorming sessions.
- Accrue secondary research that relates to your suspected problem, issue or phenomenon.
- Conduct a basic survey to see if there is any truth to your identified issue.
- Create the hypothesis: If there are no prior studies or the problem is not fully under control or has a workaround form a hypothesis based on research from the previous step.
- Conduct further research: Continue researching to see if there is any truth to the existence of the problem and its possible solution/hypothesis.
- Conduct surveys, focus groups, interviews and more secondary research.
- Decide whether the subject at large and its hypothesis are worth delving into further in descriptive research.
Excelling in Exploratory Research
Exploratory research forms the building blocks of an overall research project, as it constructs the groundwork of a research subject that will later be explored (in descriptive research), tested (in correlational research) and manipulated in (experimental research).
As a researcher, perhaps there will be times that you won’t need to conduct much exploratory research. This is true in cases where you have some familiarity with a subject or are certain of its existence in your business, in which case, you can proceed to descriptive or experimental research.
In any case, you need to be fully aware of a problem or other phenomenon before conducting any further research on it. This is where exploratory research excels.
In order to be skillful in exploratory research, you need to turn to several resources, such as secondary research, case studies, literature within your industry/niche and finally, surveys. Although surveys ask for specifics, they too are invaluable for conducting exploratory research, as they help uncover the what, giving credence to any suspicions you may have had prior to endeavoring in research.
As such, using a potent online survey platform will assist, guide and launch the key tool in your exploratory research.
[wp-faq-schema accordion=1]

Using Artificial Intelligence Software to Build Relentless Quality
Using Artificial Intelligence Software to Build Relentless Quality

Summarize this article with AI:
![]()
![]()
![]()
![]()
![]()
Artificial intelligence software is on the rise, both in terms of usage, availability and amount of products — and for good reason, as AI can increase business efficiency by 40%.
Productivity is especially important in the realm of market research, as it makes up but one chamber of marketing to maintain a business. With so many funds being allocated to marketing — from hiring freelancers, to SEO tools, to marketing automation and so on — it is especially important for market research to be of high quality.
Machine learning, one of the four main subsets of artificial intelligence, can be used to provide above-par data quality — with the correct capabilities and when consolidated with the proper software.
This article explains how artificial intelligence software forms high-quality data, the kind that market researchers can objectively label as being of relentless quality in the Pollfish online survey platform.
Understanding Artificial Intelligence Software in Market Research
As market research projects demand hard and fast data available at speed and at scale, there is a need to access top-tier quality — that is, data that is not merely accurate, but exists in a system that provides human levels of accuracy, with machine levels of delivery.
Artificial intelligence software is the answer to the necessity of having access to the highest quality of data. This kind of software runs largely on AI, as its name implies, which is a kind of technology that simulates human intelligence and applies it to computer systems.
Artificial intelligence creates intelligent systems so that they perform tasks as a human would. As a technology, it is used to pair human capabilities with the speed of machinery, thus empowering systems with the capacity of both.
AI is used to improve efficiency and productivity and many businesses have been adopting it. However, although nine out of ten leading companies invest in AI, less than 15% use AI in their business. As such, not all businesses, including those who claim to be AI-run are using AI capabilities to their full advantage.
Market research software must fully incorporate its AI system aside from only its key functionalities, otherwise, the artificial intelligence software does not fully tap into its abilities.
The Importance of Artificial Intelligence Software in Market Research
This kind of software has revolutionized the market research industry, allowing market researchers to gain all the benefits of digital innovations, such as agile data creation and much more.
Firstly, it allowed the use of automation to enter the field of market research, liberating researchers from labor-intensive hours applied to each project just to garner respondents.
Instead, the artificial intelligence software would assume various roles which would otherwise make the process laborious and difficult to fulfill. These roles include the following:
- Screener creation
- Questionnaire creation
- Deployment
- Reaching the correct respondents
- Fulfilling a set amount of quotas
Not only has artificial intelligence software assured that these tasks would be completed from the platform itself, but done so in a fast and relatively inexpensive manner. Additionally, apart from carrying out these applications, AI has instilled a system of quality checks in market research software.
But not within each market research platform. These platforms are not all built with the same levels of AI prowess. As aforementioned in the previous section, market research software must fully implement its AI capabilities, that is, apply them to as many aspects of the data aggregation aspects as possible.
In turn, it augments the quality of the data, thus boosting the veracity of the market research campaign.
The Importance of Applying Machine Learning in Artificial Intelligence Software
The value of artificial intelligence software in market research goes far beyond the utility of automated surveys. The proper market research platform will use machine learning as part of its AI capabilities.
As one of the main four types of AI software, machine learning allows the software to learn just as a human would, that is without assistance or programming. This is because this subfield of AI allows the software to learn from past experiences dealing with data.
Thus, machine learning permits a computer system to make decisions and predictions by way of extracting historical data, rather than being programmed to take such actions.
This frees up a lot of time for software developers and those on the tech support team, as the AI software itself learns how to deal with different issues so that it can produce better output as time progresses.

The learning process in machine learning occurs through a massive sweep of structured and semi-structured data, which the AI software uses to create accurate results and make predictions based on that data. Thus, artificial intelligence software itself can be taught to perform a particular task and yield an accurate result.
This is of the essence for maintaining quality data, in that many respondents may provide faulty answers such as flatlining, gibberish answers and the like, in order to quickly finish a survey and gain survey incentives.
The Pollfish platform uses machine learning to avoid this kind of low-quality data. Instead of merely automating the survey distribution and collection process, it works in real-time to filter out inaccurate information, so that only the highest quality of data is delivered to the researchers.
How the Pollfish Artificial Intelligence Software Provides Relentless Quality
The Pollfish online survey platform uses artificial intelligence software to its fullest potential, which in turn allows it to deliver relentless quality in all of its functions.
As aforesaid, it employs machine learning during the data aggregation process, so that low-quality data never makes it to the results of the survey. Thus, rather than having to comb through hundreds or even thousands of responses as a means of spot-checking for issues, the Pollfish artificial intelligence software performs quality checks, as it is deploying surveys and collecting responses.
Thus, it does not merely automate the process of retrieving the correct survey respondents based on the criteria entered in the screening section. Instead, it also automates the process of quality checks and the elimination of low-quality data.
This means that the Pollfish software does not stop iterating until it reaches the preset amount of survey completes, concurrently filtering out the low quality and inaccurate responses. Therefore, market researchers do not have to wait until after all the completed surveys are received to then check for accuracy and quality answers.
As such, they avoid having to run another survey, as they won’t need to remove answers from the results and fill in those missing quotas afterward.
The following explains all the other ways in which the Pollfish artificial intelligence software provides relentless quality to any market research campaign.
Survey Fraud Detection and Prevention
Survey fraud refers to the phenomenon of respondents submitting fraudulent or inaccurate responses. Also called market research fraud, this adverse effect strikes the largest blow on a survey campaign, as it adds another issue, on top of the margin of error, a metric that gauges the magnitude of error in a random sample.
When researchers acquire fraudulent answers, they are in a worse-off position than they were had they not run a survey. The opposite should be true as fraudulent data only tarnishes a research campaign, defeating the purpose of using survey software in the first place.
Pollfish detects a wide variety of survey fraud. It prevents fraudulent responses in the results automatically, i.e., in real-time. Thus, market researchers do not have to be concerned with low-quality answers.
Additionally, this artificial intelligence capability cancels out the need to outsource technical support. Researchers can delight in the fact that once the survey results are ready, they are as close to accuracy as possible.
Bot Removal
Market researchers can rest assured that the survey sample will be bot-free, as our machine learning staves off any respondents suspected of being fake users. This means that respondents on a VPN are strictly prohibited from gaining access to the surveys.

Virtual private networks (VPNs) do not simply forge bot-friendly connections, but they also skew geolocation statistics and quotas. They are thus forbidden from taking part in Pollfish surveys. Additionally, a respondent is disqualified if the same user is detected attempting to sign in from multiple countries at once.
Strict Adherence to Layers of Quality Checks
The Pollfish platform adheres to multiple layers of quality checks. As such, the machine learning function in this artificial intelligence software sorts through various issues concurrently.
It disqualifies respondents on various criteria — virtually any behavior or activity that constitutes poor data quality bars respondents from the final count of the surveys. Only the highest quality of responses are collected and added towards the result of the survey.
These quality checks are fully automated and ongoing; thus market researchers are assured that only accurate and relevant data will land in the results of the survey. Our machine learning approach incorporates several layers of technical quality checks.
These quality check layers include detecting and stamping out:
- Hasty answers
- Gibberish/ nonsensical answers
- Ex: sdjnf jfgid idjvf
- Same respondents attempting to take the same survey
- Long survey-taking times
- Carrier inconsistencies
- VPNs
- Flatlining (providing the same multiple-choice answer consecutively)
Respondent Verification
The Pollfish AI software assigns each respondent an ID, a method to track respondents without giving away their identities. This function prevents duplicate IDs, whether they come from IP addresses or MAC addresses.
Additionally, the software tracks and checks Google Advertising and mobile device identifiers to fend off those attempting to take a survey more than once, those who spend too much time on a survey or attempt to take any nefarious action.
In-survey questions are formed as yet another layer of security against survey fraud, by requesting an answer to a simple math problem or including identical questions in a survey with re-ordered response options to verify answer consistency.
Reputation Ranking
An offshoot of respondent verification, reputation ranking is the newest vision in Pollfish, one that our developers are presently striving towards. This will work by filtering out every last one of questionable respondents who attempt to take a Pollfish survey, to ensure that only the highest quality of data is extracted.
This approach will work much like a credit system for market research, as only those deemed reputable will be able to take the survey and have their responses qualified to the final results allotted into the Pollfish dashboard. Based on machine learning, this process will be the final layer of quality checking, assuring researchers that Pollfish delivers data that is truly relentless in quality.
Propelling Market Research with AI Software
The grandest indicator of the success or failure of a market research campaign is the online survey provider market researchers opt for.
A potent system will employ artificial intelligence software to remove the burden of various tasks from the researchers, instead of having the platform perform it just as a human would and in a streamlined manner.
With machine learning, such a platform can create efficiency in processes as it acquires more data. A strong online survey platform can apply machine learning to carry out numerous quality checks, so that the results are of the finest quality, assuaging researchers of this arduous task of spot-checking through massive quantities of data.
The Pollfish platform includes these capabilities, thereby allowing it to provide relentless quality for any market research endeavor.
[wp-faq-schema accordion=1]
How to Avoid Survey Attrition and Keep Sought-After Respondents
How to Avoid Survey Attrition and Keep Sought-After Respondents

Survey attrition affects many research projects, whether they deal with market research or other varieties. A detriment to survey research, attrition creates a challenge that concerns retaining sought-after survey respondents, the kinds that provide the most value for your study.
As such, researchers ought to understand survey attrition, where and how it occurs, along with heeding best practices to weed it out. This will ensure that they form effective survey studies for valuable research.
This article expounds on survey attrition in its dominant forms, in addition to the methods researchers should adopt to reduce and avoid it altogether.
Defining Survey Attrition
Attrition is a term denoting the weakening or tearing away of something through sustained means. In survey and market research, the latter part of the definition usually occurs inadvertently, as no researcher would purposefully want to debilitate their research campaigns.
In more specific terms, survey attrition involves the decrease of the sample size, number, or strength and can occur intermittently or permanently.
Survey attrition occurs through several adverse phenomena, since in simple terms, it refers to the act of leaving a survey study. As such, there is no single form of survey attrition; however, survey attrition has typically focused on two kinds of attrition.
The Two Main Types of Survey Attrition
Although plenty of factors can fuel attrition, as most researchers have experienced survey respondents leaving a survey study, there are two main categories of survey attrition. As such, survey attrition research is committed to understanding these two predominant forms, along with the methods to increase participation.
Nonresponse Attrition

Also called nonusage attrition, nonresponse attrition refers to when those invited to complete a survey opt out of participating, thus rendering the loss of these respondents. This form of attrition occurs within systems that involve researchers reaching out to respondents and recruiting them, such as in survey panels and focus groups.
Another form of nonresponse attrition is more difficult to tract; it involves those who were reached via automated survey means. Since these users never entered the survey by the nature of nonresponse attrition, they are virtually impossible to monitor.
Dropout Attrition

Dropout attrition refers to respondents who have already begun a survey and dropped out, as the name suggests. This attrition can occur in any kind of survey distribution method, from targeted outreach such as emails and survey panels, along with automated surveys and prompts on landing pages, etc.
This kind of attrition can be tracked through certain online survey platforms, although not all will offer this capability. Often, studying dropout attrition involves studying the completion rate.
How to Avoid Non-Response Attrition
Researchers should bear in mind that there are going to be targeted members of your survey research that won’t even open your survey. There are, however, several practices that can reduce non-response attrition. Here are a few examples:
- Create highly targeted surveys. Solicit respondents via a survey that somehow relates to respondents or their market segment. No one likes receiving junk mail or being spammed with survey requests.
- Reach those who interacted with a CX you can confirm. Ex: a purchase, a browsing session with no conversions (usually can be tracked with signed-in users), a phone interaction, etc.
- This will stamp out the feeling of randomness, so that the respondent doesn’t feel they are randomly selected, i.e., being spammed.
- Use incentives. Survey incentives grant respondents with a motivation to spend time out of their busy schedules on a survey.
- Don’t over-survey. Even if a respondent has taken part in a survey, there is no guarantee they won’t ignore a second request (or others). If you need to follow up, consider using other individuals in your target market.
- Be upfront with the purpose and the survey’s importance. Respondents should not feel they are randomly selected — or that they’re selected for something of little importance. Thus, make the purpose of the survey clear, highlighting its need and usefulness, for example, to improve their customer experience.
- Display the time required to take the survey. For transparency, make the estimated completion time clear so respondents will know if they are able to take it based on the time they have.
- Consider instances most relevant to the target population. Send the surveys around those instances. Certain market segments have key dates that you can base your surveys around. For example, if you are looking to conduct a real estate survey and your target market is college grads, send the survey around graduation time, when the grads move out of their dorms and into their post-college life.
How to Avoid Dropout Attrition
Avoiding dropout attrition involves optimizing the in-survey experience, i.e., the survey itself. Researchers can encourage respondents to complete their survey in a number of ways. Here are a few critical methods to avoid dropout attrition.
-
- Keep survey size commensurate with the survey incentive. If you’re not granting any incentives for taking the survey, keep your surveys short, at no more than 5 questions. However, if you provide incentives, then the survey length should be proportional to the incentives. If a survey takes longer than 10 minutes to complete, consider offering a more substantial incentive.
- Optimize it across devices. We are no longer living in a digital-only, i.e., desktop-only world. Instead, many devices are used on the go like mobile phones and tablets. Assure that your survey can be easily seen, accessed and used across all devices. This includes checking for loading times, for content fits on the screen and no points of friction.
- Keep questions on-topic. Irrelevant surveys or surveys that seem to veer from the topic they initially presented the respondents with, will easily deter the respondents from completing the surveys. These stir up confusion, boredom and sometimes, even stress.
- Customize follow-up questions. Each respondent answers differently; as such not all respondents should be taken to the same questions. Instead, route respondents to questions based on the answers they provided via advanced skip logic.
- Avoid ambiguity in your questions. If they have to overthink a question or feel as though they’re unable to answer it, chances are, the respondents won’t complete the survey. Assure you provide all possible answers in your multiple-choice questions. If this is not practical, include an option for “other,” and allow it to be open-ended.
- Create engaging experiences with multi-media. These elements include photos, videos, GIFs and the like. Aside from embellishing the questionnaire, they create engaging experiences that stimulate your respondents beyond a text-only survey.
- Check your completion rates. Check your completion rate regularly. These should be available in the online survey platform you use for your survey campaigns.
Maintaining a Steady Flow of Survey Participation
Since survey attrition cannot be fully avoided, so researchers ought to maintain steady response and completion rates. Additionally, they ought to keep optimizing their surveys, so that they are providing both the respondents and the researchers a smooth, glitch-free experience.
Aside from the technical function of the survey, its success largely hinges on its questionnaire, which should always be kept relevant to the sampling pool. As such, market segmentation comes into play. As a marketer or market researcher, you ought to be in tune with the makeup of your target market — or target population if you are a general researcher.
This requires conducting preliminary market research. A potent online survey tool will help you achieve this with no hassle, allowing you to retain your most sought-after responders.
[wp-faq-schema accordion=1]
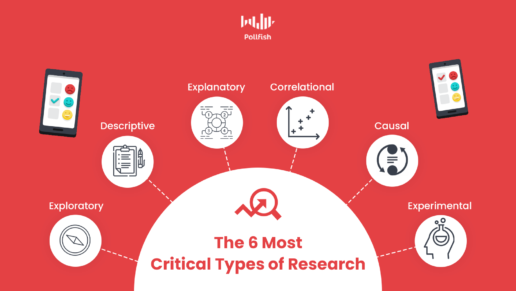
The Complete Guide to Mastering the 6 Most Critical Types of Research for Any Research Endeavor
The Complete Guide to Mastering the 6 Most Critical Types of Research for Any Research Endeavor

Understanding the six most critical types of research is an absolute must for market researchers and general researchers alike.
The world of research is ever-expanding as new technologies evolve, new techniques for obtaining data arise and more secondary sources become available to the public.
However, the six chief types of research remain as the foremost processes for conducting investigations. They refer to specific types of research which include more than merely using a method of study.
This guide explains the six prominent types of research, when to use each, how they benefit business and more.
Defining the Major Types of Research
For the purpose of general research, a major type of research does not refer to conducting studies on a designated topic of choice (for example, sales research).
So what defines a “major” type of research?
When categorizing research into several key varieties, a “type of research'' refers to a particular form of research that can examine virtually any topic and its variables, thorough particular means and approaches. These approaches involve using distinct components such as methods, processes and frequencies particular to one kind of research.
These components form the core of the research type, making it feasible to differentiate from others. Each variety of research is also bound by a unique purpose. This purpose is not thematic, as it can be applied to all kinds of subjects of study.
Despite operating through different approaches and methods, some forms of research share several features, including the purpose of the study/ the kind of results it seeks to some extent.
The Need to Understand the Different Types of Research
Whether you operate under a B2C or a B2B business, either as a business owner or market researcher, you ought to verse yourself in the different types of research. This includes being able to distinguish between them and not confusing one for another.
Before you tackle any area of concern to investigate for your research needs, you need to assure you’re setting your research project up for success. In order to form an effective research campaign, you’ll need to be methodical.
This means you’ll need to tend to several concerns to build a successful campaign. This involves organizing your topic of study and inquiries into a particular variety of research.
Doing so will ensure you apply the correct market research techniques and methods, the kinds that best suit the inquiries and needs of your topic of research, thus, best tending to your concerns.
When you use the correct type of research for your study, you’ll be able to understand it more thoroughly and thereby find more fitting changes and solutions. This is especially true when your area of study is a problem you would like to minimize or reverse.
Using the correct form of research will also ensure that you are measuring and observing the correct elements and by way of a frequency best suited towards your research issue.
Moreover, when you employ the proper type of research, it is far less likely to come upon errors and gaps that require answers. Thus, there is less of a need to start again or switch to a different type of research.
All of these areas of importance would be impossible to fulfill if you do not become familiar with them and are not able to tell them apart.
The following explains the six most critical types of research.
Exploratory Research
What it is: Used to reveal facts and details around a topic with little to no research, exploratory research forms the foundation of the research process. It identifies a topic, be it an issue or a phenomenon with scant details and seeks to find its basic properties.
As such, it finds the correct variables the researcher needs in order to begin the study, understand its basic elements and form a hypothesis. The key issue at hand, its variables and its hypothesis are used for further research.
Essentially, this kind of research forms the premise of a research campaign, assuring that the variables and other components are indeed what the researcher needs to study in the next steps (other types of research).
Stage in the research process: The very first
Conclusive? No
How it benefits a business: Before a business can explore an issue in-depth, it needs to decide on a specific topic, the existing problem within the topic and its key variables. This ensures the business is equipped to enter the next research stage (type) and that it does not have any extraneous variables or concerns that do not contribute to solving the problem.
Descriptive Research
What it is: This type of research is premised on describing a phenomenon, behavior or problem discovered in an earlier stage of research, usually in exploratory research, although it can also be focused around that which was discovered in explanatory research.
Descriptive research describes the nuances of a population, a variable or occurrence that a researcher requires further study on. Its objective centers on finding previously unknown facts or extracting more details on facets with fewer details.
It focuses on the what, how, when and where of a study rather than on the why.
Stage in the research process: The early portion of the middle stage
Conclusive? Yes
How it benefits a business: It is crucial for a business to understand a phenomenon and its variables in a full or close-to-full context. This type of research helps a business do just that, as it finds all the key details about a phenomenon that a business may not have known about before conducting the research.
What’s more is that, as a primarily quantitative form of research, it is apt for creating statistics. Being statistically-oriented allows this form of research to be conclusive, although it is considered to be in the early mid-stages of an entire research project.
These statistics are not simply key for internal resource purposes, but they provide a differentiating ingredient for your content. A strong content marketing strategy relies on putting out original insights; the data you derive from descriptive research is as original as it gets. This can be accomplished when you opt for a primary method (such as survey research).
Explanatory Research

What it is: Explanatory research is based on research that explains the already established aspects in a research campaign. It fills in the gaps and connects the dots from exploratory and descriptive research.
This type of research is unique in that it can be conducted either prior to or after descriptive research. As such, it rests in the early to mid-stages of the overall research process.
Like descriptive research, it works to shine a light on the various details that make up a research subject of study. However, contrary to descriptive research, it does not simply seek to describe, but rather to explain.
Thus, this research category falls under qualitative research. It helps find the why of a problem or phenomenon. It is not conclusive.
Stage in the research process: Early to mid-stages (can be performed before or after descriptive research, depending on a business’s needs).
Conclusive? No
How it benefits a business: It benefits a business in that it seeks to go beyond describing a subject of study. Rather, it plunges into a subject in greater depth, finding the kinds of insights that descriptive research cannot.
Additionally, it is flexible. It can be conducted following exploratory research and either before or after descriptive research, the only research of its kind to offer this benefit.
This research involves studying an important aspect that is studied in the later stages of the entire process, that of cause and effect. Explanatory research studies cause and effect relationships so as to explain their scope and nature, a critical precursor for correlational and causal research.
Correlational Research
What it is: Correlational research is a study into the relationship between two variables. Inspecting precisely two variables, this type of research seeks to discover and render the relationship between variables suspected of relating in some way.
This research seeks to make sense out of the variables identified in earlier stages of research. Although correlational research is not sufficient to conclude on cause and effect relationships, it is necessary to conduct to find whether a relationship between variables exists to begin with.
An observational form of research, it is non-experimental; there is no controlling or manipulation of the variables involved.
The relationship between the variables can be either positive, negative or zero (nonexistent).
Stage in the research process: Middle stage
Conclusive? No
How it benefits a business: Being able to determine if there is a positive, negative or zero correlation between two variables allows researchers to know how to move on to the next step: finding a cause and effect relationship between the variables.
A zero correlation informs a business that there's no need to further study the relationship between two particular variables, saving the business money and time. A negative or positive correlation dictates that further research is needed to discover whether there is cause and effect relationship.
Either way, the results derived from this type of research are highly influential on the next steps a business decides to take in their research process: whether to end it, continue and how.
Above all, it reveals how two variables relate to one other, giving a business a clearer picture of the environment they operate within, whether the variables concern sales figures, impressions or something more abstract like customer loyalty.
Causal Research
What it is: Causal research is founded on the undertaking of determining cause and effect relationships. As such, it involves conducting experiments and testing markets in a controlled setting. It is more scientific than any of the previous types of research.
This kind of research uses the findings from correlational and explanatory research in an attempt to unearth causal relationships. Since correlation does not equal causation, causal research studies whether the variables with a negative or positive correlation have any effect on the other variable(s) in the study.
Causal research has two objectives: finding which variable forms the cause and which makes up the effect, and understanding the relationship of the causal variables after the effect occurs.
Stage in the research process: Late-final stage
Conclusive? Yes
How it benefits a business: Often the final form of research, causal research is critical to complete the entire process. It involves conducting both secondary and primary research, the latter of which is experimental.
As such, this research type does not only observe, rather it investigates the variables themselves, manipulating them and controlling them as needed. This is crucial for a business in that it not only analyzes, but proves the existence of a causal relationship, along with how the effect manifests.
Thus, this research is not only conclusive, as it finds the most important result that a business or market researcher seeks: a proven answer to their hypothesis. This allows researchers to close off the research process, or conduct further experimental research if they so choose.
Experimental Research

What it is: Experimental research vigorously follows a scientific research design. It is entirely scientific, more so than causal research, as it nearly, if not fully implements the scientific method towards finding a solution.
The final stage of the research process, this kind of research uses all the information from the previous stages to conduct an experiment to test a hypothesis. It can also follow causal research; causal research itself is a kind of experimental research.
Researchers can conduct further experiments on the variables they found causal relationships for, in that they can test how to reverse an unwanted correlation, or minimize it to some degree. Or, further experiments can show a business how to reap more benefits from a desired correlation.
Stage in the research process: Final stage
Conclusive? Yes
How it benefits a business: Experimental research proves or disproves a hypothesis; as such, it is the final stage in the research process. It is the most scientific kind, leaving little to no room for errors, intuition or bias.
It can be used to accommodate causal research, digging further into a discovered cause and effect relationship. This is especially important for a business, as while it is critical to know whether a causal relationship exists, understanding how to move forward with this knowledge is of the essence.
Experimental research allows brands to test discovered causal relationships further, finding much-needed solutions. For example, a brand may want to learn how to reduce an unwanted correlation or to increase a needed correlation. Moreover, conducting further experiments can show brands how to gain a desired causal relationship sooner.
Complementing Your Research
In summary, there are six major types of research. A market researcher must consider these carefully before setting up their market research campaign. In order to build a comprehensive and effective study, you need to be able to organize your research.
To begin this endeavor, you need to classify your research topic(s) under a particular campaign, such as advertising, for example. Following this, you need to create a smooth and educated process. Thus, you need to follow the research process by way of the 6 dominant forms of research that this guide explains.
Doing so will ensure you conduct a comprehensive research campaign, one that leaves little to discover, except for possible future events, In order to complement your research, you need to conduct effective surveys for research campaigns. These allow you to understand your target market or target population. Even in experimental research, conducting surveys helps fill in the cracks and find answers to the unknown. Understanding your respondents, i.e., customers is paramount for a business. The proper online survey tool does not solely compliment a business or research endeavor, it completes it.
[wp-faq-schema accordion=1]

How to Achieve Agile Market Research by Filtering Data
How to Achieve Agile Market Research by Filtering Data

Achieving agile market research is a feat, even for the most technically savvy market researchers. This is due to the vast pools of data that researchers of companies big and small often confront.
Filtering data is both an effective and efficient means of gaining agile market research. This method helps sort out the chaos that bombards even the most powerful of market research tools.
A tool that leaves out critical data categories is bound to increase the presence of survey sampling errors plaguing a market research campaign. Concurrently, a tool that offers a vast amount of data categories and inputs is inclined to tarnish a survey campaign.
Filtering data is the solution, but it must have all the necessary functionalities in order to buttress agile data — and therefore agile market research.
This article explains agile data, how the correct filtering data interface can help you sustain agile market research and how the Pollfish platform offers advanced and granular filtering data functionalities.
Making Sense out of Agile Data
Primarily used in the IT sector and designed particularly for its professionals, agile data is a concept that can significantly improve the market research process.
This is due to the vast reliance on data in market research — be it through secondary means or through the set up of effective survey studies.
IT professionals have founded different methods to accompany the larger catch-all phrase known as agile data. This refers to all the strategies that IT workers can apply to work more in tandem and more effectively on the data facets of software systems.
By fostering the means to work together more constructively, they reap several benefits, such as speed to insight, less waiting on higher-ups for making forthcoming decisions and smoother collaborations.
Agile market research is also borne out of the concept of agile data, to bring such benefits and more into the sphere of research.
The Importance of Achieving Agile Market Research
Achieving agile market research is a necessity in the current information age, in which various digital elements are jockeying for users’ attention, in spite of short attention spans. This ties in directly with survey attrition, along with site and app users avoiding a survey in the first place.
A major deterrent to the survey process, this issue mars the ability to build up an agile system of data collection, analysis and the yielding of results. Some market researchers may create various survey campaigns on similar subject matters as a way to remedy this.
After all, with more surveys on similar subjects, it appears to be more conducive to creating shorter surveys, a common best practice.
However, this runs contrary to agile market research, as it requires more time to create the correct surveys, launch them, cross-reference them and acquire quick results.

Instead, the online survey platform itself must be built on the premise of agile data, so that market researchers can tackle any topic quickly and without the need to implement many surveys and related survey campaigns.
One such way to form agile data and reap its benefits is through an advanced system of filtering data.
How Filtering Data Attains Agile Market Research
Almost every market research SaaS platform offers the filtering functionality, be it for determining the qualified respondents, forming the questionnaire questions and those of the screener.
While the different filtering data systems you’ll come upon in online survey platforms may appear to be carbon copies of one another, a closer look will reveal that they are not. Thus, they do not offer the same prowess of agile data — if any at all.
This is because agile data is not just about streamlining operations, but doing so while providing all the necessary functions and pieces of information.
A potent system of filtering data ensures that market researchers do not forgo using all the necessary categories of data, be it in screening questions, questionnaire questions or the demographics input.
In addition, a strong presence of data filtering allows researchers to organize parse through a large collection of data. This is especially useful in ambitious surveys, i.e., those that are longer or use more skip logic.
When data is neatly filtered, it is much easier to analyze it, make decisions on the next steps and complete a research project in a well-timed manner, thus forging agile data and maintaining agile market research.
How the Pollfish Platform Offers a Top Tier Filtering Data System
Pollfish clients secure agile data on a daily basis through the use of our advanced filtering data system, which is implemented throughout our dashboard, allowing us to divide it into just two sections: the audience and the questionnaire.
This minimalist approach saves researchers the headache and eyesore of rifling through various pages as part of building a survey from the ground up.
Instead, the platform offers multiple categories in our filtering system, permitting each aspect of the survey to be comprehensive and well-organized.
The following explains just how granularly researchers can define both their audience and set up their questionnaire through our filtering data functionalities.

Data Filtering in the Audience Section
First off, our filtering data function allows researchers to reach the correct respondents, with demographics categories that filter through common categories such as age, gender and geo-location. Each category allows researchers to assign quotas, so you receive the exact number of your selected respondents.
Although geolocation appears to be an ordinary demographic option, our filtering system is granular and manifold, so that researchers can filter the geolocation by 9 categories, such as postal code, US Census Region, city, state and more.
There are also 9 categories of demographic criteria, all of which can also be assigned quotas. These include marital status, education, ethnicity, career type and others. Researchers can even filter respondents based on mobile usage criteria and an advertising ID.
To augment all of these advanced filtering options, the Pollfish platform has recently introduced the Multiple Audiences capability, in which researchers can create one survey, with the audience requirements of multiple surveys.
This is because you can create blocks, that is, groups of specific audience requirements and quotas, with each block representing a different audience.
All this smart filtering forms agile data for researchers, so that they won’t need help at every turn, given how intuitive the filtering data system is — and that is just in the audience section.
Data Filtering in the Questionnaire Section
The questionnaire section includes multi-pronged filtering data capabilities. The filtering options span various categories so that researchers can cover all bases in their studies. This also opens up the opportunity to use just one survey per campaign.
Firstly, researchers can select the kind of question they seek to use, with 8 options of question types available (single selection, multiple selection, ranking, etc). These form the core of the survey type, in that they can take the survey in various stylistic and thematic directions.
For example, there is an option for an NPS question, the heart of the NPS survey. Or, you can use a ranking question to create the CSAT survey. The ratings stars question option allows you to create a visual ratings survey, specifically one that uses stars and so on.
After you choose the question type, there are 7 categories you can use to filter the answers. For example, you can add media to an answer, such as an MOV file, a GIF, an audio file, etc. Or you can apply logic, which routes respondents to appropriate questions based on their answer to a question of origin.
When researchers are at a stumbling block in terms of answer options, they can use the predetermined answers filtering option. This filtering data function is rich in categories, offering 46 scaled answer options. For example, researchers can use answers using a scale of disagree to agree, satisfied to dissatisfied, far exceeding expectations to falling short of expectations, the days of the week and many more.
The magnitude of filtering options will prevent any researcher-based writing block when it comes to crafting answers.
There is also a category of “none of the above,” which can be accompanied with an image. There is an “other option,” in which you can have responders specify their answer. This too can be paired with an image.
Instead of manually changing the order of answers, you can use the “shuffle answers” filtering data option. Or, you can implement “batch answers,” a function that allows you to paste all of your answers into the answer portion at once, should you decide to use them from an external document.
A smart system driven by AI, Pollfish divides the pasted content into separate answers. This allows you to avoid copy/pasting each one manually, as they are all inserted automatically.
All in all, the Pollfish system of filtering data is an advanced system of granular categories and selections, which facilitate the survey creation process, in turn providing agile data that is feasible to interpret.
Filtering Data in the Results Dashboard
Finally, and perhaps most importantly, data filtering is applied in the post-survey results in the Pollfish dashboard. There, researchers have the option of filtering data to their liking for all of their analysis needs.
When filtering data in the results dashboard, researchers have filtering options on the left panel of the page. They can sort their results by selecting their desired filters and deselecting the rest.
They can also filter by question and answer to see how respondents answered a certain question, by clicking on their desired question or answer. They also have the option to export the filtered results by clicking on “exports” and then instead of “all data” selecting “current view.”
There is also a “time range” filter on the left panel, which can also give them a grasp of the survey distribution in real-time.
Additionally, there is a post-stratification filter; this filter weighs the age and gender demographics to match the census data of the targeted region.
The results are adjusted to reflect this change. This is why the filter on each response counts differently (hence the number/ percentage discrepancy when the filter is enabled). This data is a more accurate representation of the targeted audience.
The platform also allows researchers to download various documents for analyzing post-survey data — data that has already been extracted by Pollfish. Researchers can download this data in four different kinds of report types for all kinds of analyses.
The following explains the 4 kinds of data exports available for data filtering:
- PDF: A visual document that can easily be shared with stakeholders and saved as reference docs. A Pollfish PDF is laid out similarly to a PowerPoint presentation.
- Excel Spreadsheet: Recognizable to most businesses, with a Pollfish spreadsheet export, researchers have full access to all Pollfish survey results. They can add pivot tables, graphs and get deeper insights.
- Crosstabs Report: Crosstabs are a matrix-style data visualization format and one of the most useful ways that market researchers analyze data. This kind of report allows researchers to look into individual insights and organize the data in different ways, opening different consumer insights that wouldn’t be readily available from the initial results.
- SPSS Report: SPSS is a set of software programs combined in a single package. It allows you to add your Pollfish results to various kinds of complex data analyses. It’s good at combining varied, complex data sets. Researchers use it to make connections, find correlations and graph results from various data exports at once. SPSS has several tools to analyze data for predictions and spotting patterns, increasing its use for brands and marketers looking for buying behavior trends or to vet the viability of a new product.
The Gateway to Nurturing Agile Market Research
Obtaining agile market research is never an easy task — that is, if you’re using a below-par online survey platform. There are several ways such a platform can spur agile data, such as via a mobile-first approach and with powerful SaaS integrations.
Additionally, filtering data is a critical component of nurturing agile data for market research. As one of the main elements of a market research tool, it is not universally equivalent across platforms. This function tends to differ from platform to platform, as such it is not always conducive to agile data.
On the contrary, the Pollfish filtering data system encompasses all aspects of the survey creation process. It is built as a means of providing comprehensive coverage of all categories, whether they pertain to the screening section, aka, the audience section, or the questionnaire.
It is also very intuitive, thus molding agile data by its very structure.
[wp-faq-schema accordion=1]
Diving Into the Customer Satisfaction Score Survey (CSAT) Survey
Diving Into the Customer Satisfaction Score Survey (CSAT) Survey

The Customer Satisfaction Score (CSAT) survey is an effective tool to measure customer satisfaction. Customer satisfaction has always been the chief performance goal for businesses, as customers are the lifeblood of any business.
The need to satisfy customers is at an all-time high, as a third of customers will leave a brand they love after just one bad experience, proving that companies need satisfaction upkeep of even their loyal customers. Nearly 60% of US consumers will abandon a brand after a few bad experiences.
Businesses, therefore, need a solid strategy that prioritizes customer satisfaction. A customer satisfaction survey, the CSAT survey is one of the foremost methods of gauging this crucial concept. This article delves into the customer satisfaction score survey and all that it entails and provides.
Defining the CSAT Survey
The Customer Satisfaction Score (CSAT) survey evaluates customer satisfaction based on a specific touchpoint in their customer journey, whether that’s in a website’s navigation menu, at checkout or while using a product they’ve already purchased (post-sales).
Another key differentiating factor of the CSAT survey is that this customer satisfaction survey is based on its eponymous score. This score signifies the percentage of satisfaction that customers endure and therefore, rate some point(s) in their customer experience (CX). Higher percentages reflect higher degrees of customer satisfaction.
Understanding this score helps businesses determine how segments of their target market assess their satisfaction in relation to their business. The CSAT survey comprises more than just the question used to calculate the score. Since it is a survey, it uses follow-up questions based on the respondents' answers. These can include open-ended questions so that respondents can elaborate on their CSAT rating.
How to Calculate the CSAT Score
The CSAT score is the heart of this survey. It uses a specific formula for its calculation. Although the CSAT survey measures a specific customer experience, market researchers can use it for general customer satisfaction assessments.
The CSAT score is measured with a Likert scale question type. The scale is between 1 and 5, in which 1 represents “highly unsatisfied” and 5 represents “highly satisfied.” 4 also represents predominantly satisfied customers.
The CSAT score is the most flexible type of customer satisfaction score, as it is not limited to the numbered scale. You can use various in-survey tools to exhibit the same sentiments as the 1-5 scale, such as emoticons, stars and other visual elements.
Here is an example of a general CSAT survey question, which responders answer with the aforesaid scale: How would you rate your overall satisfaction with our company?
Here is how you measure the CSAT score after you receive this critical variable:
CSAT= (Number of satisfied customers (4 and 5) / Number of survey responses) x 100
Round the result to the nearest whole number.
An example of the CSAT Calculation:
Number of satisfied customers (those who answered with a 4 or 5) = 32
Number of survey responses = 84
CSAT= (32/84) X 100
CSAT= 0.38 X 100
CSAT= 38%
As such, only 38% of respondents were satisfied.
How the CSAT Survey Differs from the Customer Effort Score (CES) & Other Surveys

There are several other key customer satisfaction survey types. The two other main surveys are the Customer Effort Score (CES) survey and the Net Promoter Score (NPS) survey. Additionally, researchers can experiment with other customer satisfaction surveys, like ratings scale and custom surveys.
While it measures the same business aspect of customer satisfaction, the CSAT survey differs from the other such survey types, in that it studies particular things and thus has a discrete formula.
The Key Differentiators of the CSAT Survey
The following lays out the key facets of the CSAT survey. These distinguish it from other customer satisfaction surveys.
- Measures how satisfied or dissatisfied customers are at a particular time, with a particular service, procedure, interaction, product or any single CX moment.
- Uses a Likert scale question, with a scale of 1-5.
- Has two key outcomes: the score (whether its low (1-3) or high (4-5)) and the percentage of the high scores.
- Focuses on the latter, i.e., the percentage of satisfied (high) scores.
- Should be launched after a specific occurrence in the CX, such as:
- A technical support call
- A product demo
- A purchase
- Visiting a store
- Interaction with a UI element
The Customer Effort Score (CES) Survey DIfferences
The Customer Effort Score (CES) survey studies a completely different aspect of customer satisfaction. This survey measures the ease of service experience customers undergo with a business. Thus, it asks respondents to rate the ease of using a product or service via a Matrix-like question, on a scale ranging between “very difficult” and “very easy.”
Also a Likert scale question, the scale is usually between 1 and 5, in which 1 represents very low effort and 5 represents a very high effort. This can cause some ambiguity since the scale is inverted (1= good, as it’s low-effort/easy, 5= bad, as it’s high effort/difficult). 3 represents a neutral degree of effort in doing business with a company.
The Customer Effort Score formula:
(Very easy + easy answers) — (very difficult + difficult answers) = CES
Another way to calculate the CES: (sum of all individual scores) / all the respondents = CES
Following suit to the first calculation, the lower the score, the easier and thus more satisfying the experience is.
The Net Promoter Score (NPS) Survey DIfferences
The NPS survey differs from the CSAT survey in that it measures the likelihood of a customer to recommend a product or business to others. This survey is intended to understand customers’ outlook on a business, particularly their positive CX.
This is because the NPS question doesn’t merely question customer satisfaction — it asks whether customers reached a satisfaction high enough that would spur them into advocating for the business.
Respondents answer the NPS question on a scale of 0-10. The scale is divided into 3 sections of responders based on their scores.
- Detractors: Scores 0-6, they represent the low end/ negative sentiment
- Passives: 7-8 is the mid-range; their name denotes more of a neutral sentiment
- Promoters: 9-10 represents high customer satisfaction
The Net Promoter Score formula:
(Number of Promoter Scores/Total Number of Respondents) - (Number of Detractor Scores/Total Number of Respondents) = NPS score
The Customer Satisfaction Score survey is therefore divergent in its calculation along with the aspect it measures.
The Advantages and Disadvantages of the CSAT Survey
The CSAT survey is a nimble tool for tracking and measuring customer satisfaction. But as any survey tool, it too has a few limitations. It’s key to learn both its benefits and snags when deciding whether this survey type is the right one for your market research needs. The following posits the pros and cons, so that you can weigh them against each other during your deliberation.
The Pros
- Versatile measurements: It can be used across a wide range of interactions and experiences.
- Extremely flexible formatting: The grading scale is not limited to numbers. For a simple rating, researchers can use emoticons, stars, etc.

- Specific: Brands can spot-check different components of their CX, whether it’s digital or in-store and make precise improvements.
- Provides regular, up-to-date info: This survey can regularly be deployed as a check-up on your customer satisfaction, thus providing up-to-date customer feedback.
- Positive for your brand’s perception: Customers like it when their feedback is considered. When you specifically tie their opinions to your brand, you’re positing it in a good light.
- Can build benchmark data: By administering the same type of survey from time to time, you’ll be gaining continued insight that you can compare over time, allowing you to benchmark the data over several years.
- Simplicity in design: Although the question can pertain to all kinds of CX components, it is simple and requires few follow-up questions, unless you need a deep read of customer interactions.
The Cons
- Limits with specificity: Since it zeroes in a specific touchpoint, the feedback is limited to that experience only. It doesn’t provide a wider view of the overall customer relationship.
- Can overwhelm respondents: Although a simple survey, the CSAT warrants constant check-ups for updated info and benchmarking. This can irritate repeat customers or even first-time buyers.
- Privacy concerns: Not all interactions are private. A purchase, for example, isn’t private in that customers provide their names, addresses and credit/debit card details. As such, their identities are tied to their CSAT survey responses. This can be concerning for customers that value their privacy and want to maximize it.
When to Use the CSAT Survey
The capability of being used to survey everything can mean nothing for market researchers and business owners who want to narrow down the most expedient opportunities for measuring customer satisfaction.
As such, here are some of the most opportune moments and occurrences in your customers’ CX for you to employ the CSAT survey.
- Customer support interactions
- Chatboxes, emails and all other digital communications
- On the phone
- In-store and at a support center
- Sales interactions
- In-store
- During a meeting whether it’s via Zoom or in-person
- Over the phone
- During a marketing event, tradeshow, etc.
- Customer onboarding
- Particular to SaaS companies
- Includes products/services that require training (mainly for professionals)
- Event feedback
- Digital events like webinars, company introductions, etc.
- In-person events from grand openings, to sales weeks, etc.
- Site Navigation
- Homepage
- Landing pages
- Product pages
- Banners
- Ads
- Checkout
- Search bar
- Product Satisfaction
- Newly purchased products
- Products owned for a period of time (from weeks to a year)
There is virtually no limit to testing customer satisfaction with the CSAT survey, as it can be adapted to test all customer experiences.
Taking Your Customer Satisfaction Above and Beyond
The CSAT is but one consumer survey, but it has a major takeaway: the importance of keeping your customers happy. With customer expectations at an all-time high, it is integral to provide them with experiences that raise their customer satisfaction.
In essence, customer satisfaction measures a consolidation of customer perceptions and expectations. While it is impossible to meet every expectation, achieving a good perception is doable. In order to meet this end, you need to constantly study your customers in relation to their satisfaction with your business.
Online surveys are the most effective measures in this regard, in that they catch customers in their natural environments. Regarding the CSAT score, online surveys empower it, as market researchers can place and launch surveys during various customer interactions. The more you study your customer satisfaction, the better you can perfect it.
[wp-faq-schema accordion=1]

B2B Survey Questions to Turn MQLs into Customers and Scale Your Business
B2B Survey Questions to Turn MQLs into Customers and Scale Your Business

B2B survey questions provide a powerful and versatile opportunity for marketers to optimize their efforts. Yet, the concept of using surveys to better understand prospects is often overlooked by marketers.
If you’re looking for an innovative way to glean additional information about leads in your sales funnels, a B2B survey may be the perfect solution.
Don’t let inexperience with this research methodology stop you from launching your first B2B survey. This guide from Pollfish will provide you with a variety of B2B survey questions that you start using today to enhance your marketing strategy and turn more leads into sales.
How B2B Survey Questions Improve Your Sales Funnel
B2B survey questions can serve as the ideal follow-up to prospects after they have made initial contact with your company.
When a prospect completes a form, i.e., to ask a question or gain access to gated marketing content such as an eBook, your business will be in possession of key demographic information about your prospect and, most importantly, their contact details.
At this point, your marketing campaigns are already yielding B2B engagement, so it is the perfect time to engage with the prospect.
This is an opportunity to learn more about your prospect. B2B survey questions are a viable means to engage with your prospects at several points in their CX. For example, you can survey them prior to their gaining access to a gated content asset or follow up after they’ve seen/downloaded your content.
This will gain you valuable information about their role in their company (to see whether they are responsible for conducting business or report to someone who does), their nurture needs, buyer readiness and other factors that build their business relationship with your company.
Questions to Identify MQLs
Marketing qualified leads (MQLs) are leads from marketing campaigns that are the most likely to convert; however, it is difficult to identify these leads from basic demographic data alone. B2B survey questions can provide you with the information you need to determine whether to pass the lead along to the sales team, whether they need to be nurtured further or whether they aren’t qualified MQLs. These questions will help you make that decision:
- What is your job title?
-
-
- Multiple choice: COO, Director of Operations, Manager, Sales Manager, Marketing Manager, Etc.
-
- Who do you report to?
-
-
- Multiple choice: Board of Directors, CTO, Director of Technology, Other.
-
- How large is your company?
-
-
- Multiple choice: 1 - 10, 10 - 100, 100 - 1,000, 1,000+.
-
- What is your purchasing authority?
-
-
- Multiple choice: I have the authority to make purchases, I can make purchases with the authority of my manager, I can influence purchasing decisions but I can’t make them.
-
- On a scale of 1 - 10, how likely are you to download and read a free marketing report on changes in [industry name]?
-
-
- A scaled response, with 10 being “extremely likely.”
-
Questions that Explore B2B Pain Points
If a lead is familiar with your company (e.g. from spending time on your website or by reading content from your organization), but still hasn’t made a purchase, it is important to understand what stands in their way.
This is the opportune time to gain information about their pain points by asking the following survey questions:
- What is the biggest challenge you face in your line of operation?
-
-
- Text entry field
-
- Of the following, what is your business lacking?
-
-
- Multiple-choice answers with multiple selections allowed: lead generation tool, an effective customer communication tool, better user testing capabilities, etc.
-
- What types of assets would help your business grow?
-
-
- Multiple-choice answer with multiple selections allowed: i, benchmark data, content on how [your product name] can improve processes, industry reports, etc.
-
- What are you hoping to accomplish by setting up a [enter your product/solution here]?
-
-
- Multiple-choice answer: Improve internal processes, Save money, Find efficiencies, Scale my organization.
- Text entry field
-
- What is holding you back from purchasing today?
-
- Multiple-choice answer: Cost, Unsure if features suit our needs, Ease of use, Not sure we need it.
Questions to Nurture MQLs Further Down the Sales Funnel

B2B survey questions can provide invaluable insight to your marketing team as you plan and create content to further nurture MQLs down the sales funnel.
This info can be used to personalize various marketing literature and ancillary marketing functions such as ABM campaigns, marketing events and non-textual video content., These can make the difference between your MQL going cold or moving to the next step in their journey. The following questions provide insight for further MQL nurturing :
- Where do you go to learn more about what’s happening in your industry? Check all that apply.
-
-
- Multiple-choice response with the ability to select multiple answers: Industry blogs, benchmark reports, Podcasts, News sites, Competitors’ websites, consultants
-
- What kind of digital assets would most help your organization? Check all that apply.
-
-
- Multiple-choice response with the ability to select multiple answers: benchmark data, verticalized reports, webinars, blog posts, guides, eBooks, etc.
-
- Which terms do you use to search for more information about [product/service name]?
-
-
- Text entry field.
-
- What is your preferred communication method?
-
- Multiple-choice answers: phone, email, video conference
Questions about Satisfaction with an Existing B2B Relationship

Customer retention is essential to your organization’s bottom line, as loyal customers engage in prolonged business relationships, bringing a longer customer lifetime value (CLV. Once your B2B customers have chosen you as their supplier, or B2C customers have chosen you as their partner, you can use B2B survey questions to check-in with them to understand and adapt to their needs. Here are some customer satisfaction questions you should plan to ask:
- How satisfied are you with our company?
- Multiple-choice answer: Very satisfied, Satisfied, Neither, Dissatisfied, Very dissatisfied.
- On a scale of 1 - 10, how would you rate the ease of doing business with us?
- Scaled response, with 10 being “extremely easy to do business with.”
- Please rank the following state: I would purchase products or services from your business again.
- Likert scale: Strongly agree, Agree, Neutral, Disagree, Strongly disagree.
- How likely are you to recommend our organization to a friend or colleague?
- If Net Promoter Score is used, the response should be provided on a scale of 1- 10, with 10 being “highly likely to recommend.”
- A multiple-choice response can also be used: I have already or will recommend, I may recommend, I am not sure if I’ll recommend, I would not recommend.
- On a scale of 1 - 10, how well do we handle concerns when they arise?
- Scaled response, with 10 indicating “concerns are handled very well.”
- What can our company do better?
- Open text entry form.
Questions to Spur Cross-Sells and Upsells
You can continue to enhance your relationship with your B2B customers with additional offerings by encouraging cross-sells and upsells. Not only does this increase your company’s sales, but it also ensures they won’t leave you for a competitor who offers more.
- Is your organization considering additional technology purchases this year?
- Multiple-choice answer: yes, yes, but it’s not a top priority, unsure, unlikely, a definite no.
- Use skip logic to send “yes” answers to additional questions about the technology they may purchase.
- How much do you know about the following services/products that our business offers?
- Use a matrix to list out the services and products you offer. Then offer responses across the top row:, I’m interested in this, I know you offer this, but I am not interested, I did not know you offer this, I don’t need this.
- What other services would you like us to provide?
- Multiple-choice answers, with multiple selections allowed (list out features or services that your competitors offer or that you plan to develop)
- Text entry field
- If we offered X, would you consider purchasing from us?
- If asking about a single product or service, you can use a binary response.
- If asking about multiple items, use a matrix to understand the interest level in each.
B2B Success Is in the Details
We have provided you with a number of B2B survey questions that you can leverage to power your sales funnel, increase conversions, elongate contractual relationships, maintain partnerships and improve customer retention.
In order to get the information you need from prospects and existing customers, you will have to pay careful attention to your approach.
Consider the wording of early emails to your customers. Remind them about why you are reaching out: i.e., “You filled out a form on our website. We’d like to know how we can better meet your needs. Do you have 2 minutes to complete a short survey?”.
Alternatively, consider offering an incentive to get prospects to engage (e.g. discount code or free gift. However, you decide to approach this, know that the information you receive will help improve your marketing and sales processes, as well as turn those MQLs into happy customers.
[wp-faq-schema accordion=1]

How SaaS Integrations Help Sustain Agile Data for Market Research
How SaaS Integrations Help Sustain Agile Data for Market Research

In today’s mobile-first digital age, market researchers would be hard-pressed not to find SaaS integrations and solutions designed to carry out market research campaigns.
Given the efficiency that SaaS brings organizations, a colossal 94% of businesses already use SaaS products. Sustaining a compound annual growth rate (CAGR) of 16.4% from 2017 to 2022, the SaaS industry is not at risk of undergoing a slowdown — on the contrary, it is slated for growth.
SaaS has also progressed into the market research space, with the prevalence of online survey tools, platforms and integrations.
While it is undoubtable that SaaS offers value to market researchers, not all SaaS solutions foster agile data.
In keeping with our stance on agile data for market research, this article explains how SaaS integrations can forge agile data, with a real use case example from one of our clients.
Defining Agile Data
Agile data refers to a variety of techniques traditionally used by IT professionals to ensure effective collaboration on the various data aspects of software systems.
As opposed to entailing a uniform approach, agile data employs several techniques and philosophies to allow for efficient and productive cooperation when dealing with software systems.
Although smooth collaboration appears to be a self-evident necessity — therefore not needing the concept of agile data — in reality, it is very difficult to achieve. This is due to the different role specializations, visions and priorities among IT and data professionals.

Thus, agile data is a crucial concept to incorporate into software systems so that teams have a stronger means of working collaboratively and quicker speed to insights.
The same notion applies to agile data in market research, given that it too relies on SaaS and copious amounts of data.
The Need for Agile Data in Market Research
Market research requires agile data solutions in order to keep up with business needs. This entails access to accurate data on target populations through efficient means.
In market research, such a population is often the target market, the group of consumers most likely to buy from a business and are thus the target of various business endeavors such as advertising, user testing, etc.
Businesses pour so many investments into their target market, thus, the stakes are much higher than a traditional research project, as there is a heightened requisite to acquire an ROI. Thus, the data that market researchers extract must be above par.
But agile data in market research does not merely represent the results that a market research campaign has yielded. Rather, it requires the means of extracting the data in the first place to be agile as well.
As such, SaaS solutions in market research must offer agile data aggregation and agile interfaces. Most market research SaaS exists in the form of an online survey platform, given that effective survey studies provide a vast array of insights for market research projects.
But not all of these survey platforms are optimized for agile data. There are several ways for a survey platform to provide agile solutions. The first was via the aforementioned mobile-first approach (link above).
You can also gain agile data through the use of SaaS integrations. That way, you are not limited to relying on a survey platform on its own.
How SaaS Integrations Build and Strengthen Agile Data
SaaS integrations buttress various business endeavors, including those of market research. This is because using SaaS integrations with a main solution or even in tandem with smaller solutions, strengthens your market research campaigns with an ecosystem instead of a lone wolf market research platform.
The addition of integrating your existing SaaS solutions in your market research certainly has its advantages. SaaS products are built to cultivate agile data and provide other advantages as add-ons to your main SaaS provider.

In order for an online survey tool to gain agile data, its SaaS integrations must advance the key efficiencies found within agile data. These include:
- Easing collaborations
- Enhancing the features of your online survey platform or other market research SaaS
- Using only the aspects of each software that you only need due to the presence of more than one SaaS
- Identifying course changes more quickly, and holding market research directly accountable for business results.
- Organizing data for practical survey data analysis
- Accessing information sooner
- Improving the quality of data
- Garnering further insights delivered at speed
SaaS Integrations Use Case with a Pollfish Client
There is a vast amount of available SaaS integrations for market research products, even if they are not all built the same and do not offer the same functionalities.
In order to generate agile data, market researchers, business owners and marketers need to employ the correct SaaS integrations, particularly those that help researchers gain the benefits laid out in the prior section.
To prove that SaaS integrations can build agile data for market research, the below explains how a Pollfish customer was able to do just that: use a SaaS integration to sustain agile data for their market research needs.
One of our clients in our vast clientele pool is an audio streaming and media services provider.
The audio streaming provider has multiple accounts on the Pollfish platform, including a main account, which runs surveys across the world, in over 15 countries. The main account is used for various market research needs, which include:
- creative testing
- ad testing
- push notification concepts
With 9 users on the account and various survey campaigns in the works, the streaming provider is in constant need of agile data. There is little room for error in the main account of such a major enterprise; it therefore has the necessities that only agile data can provide.
These exigencies include:
- speedy insights
- ease of collaborations
- enhanced data organization and displays
- quality data
- a smooth integration
The audio streaming client was able to fulfill these needs through an integration with BigQuery on the Pollfish platform. BigQuery is a serverless warehouse on which the client was able to build a massive dashboard.
This SaaS integration allowed the client to store, segment and view the data that it extracted from Pollfish in their BigQuery dashboard. It enabled the client to route all the Pollfish data into the BigQuery database in real-time. This includes survey demographics, respondent profiles and the questionnaire content itself.
Pollfish was able to provide agile data through its platform’s capabilities, along with the friction-free integration with BigQuery, which allowed the media client to view and segment their Pollfish data.
Additionally, the client was able to keep track of several performance metrics, receive translated responses from Pollfish and was able to benchmark their metrics on a rolling basis.
All in all, the media client was able to quickly and efficiently make use of their data via a SaaS integration on the Pollfish platform.
Striving for Agile Data in Market Research
The agile data (AD) concept is a method involving various strategies for IT professionals to implement in software systems. Used in different situations, agile data is used to improve collaborations and other kinds of productivity, while avoiding snafus.
Agile data is a must in market research and other data-heavy industries — and most industries must rely on consumer data in order to build customer loyalty and remain competitive. Thus, numerous sectors can stand to use agile data solutions.
In market research, the key is to choose an online survey platform that can provide agile data — in a proven way. SaaS integrations are one of the ways in which such a platform can remain agile, that is, if the integration itself and the integrated platform permit agility.
[wp-faq-schema accordion=1]