
How to Build Effective Survey Studies for Valuable Market Research
How to Build Effective Survey Studies for Valuable Market Research

Survey research is an invaluable approach to primary research for any market research campaign. Effective survey studies allow you to observe virtually any topic as it relates to your target market, including a specific segment of your target market.
But with so many types of survey research campaigns and survey studies, it can be challenging to decide on how to pursue and form a survey study. After all, the goal with any data collection campaign is to extract data that is as accurate and reliable for your research needs.
This article expounds on how to build effective surveys from the ground up so you can proceed with your survey research with knowledge and ease of mind.
Finding the Macro-Application for Survey Studies

Every survey needs a purpose. Say you have a burning curiosity about your customer base. When tackling survey research, connect this curiosity to a more general-purpose for your business or institution (if you are a market researcher outside the business sphere).
Surveys can be applied to a vast number of macro-applications, i.e., the applications dealing with some category in the business or research sectors. First, find the most important topics (or said curiosities) that you would like to see your survey address. Then, categorize them in one of the following macro-applications:
- General Marketing: Marketing involves all the activities needed to promote a business. Marketing market research exists to help businesses gauge their campaign efficacy and better understand their customers. If you choose this application, consider how you can gain insights more deeply by choosing a subdiscipline within marketing.
- Advertising: Deploying sponsored messages to grow demand and elicit purchases, advertising is used to influence customer behavior. This involves prompting existing customers to make further purchases or acquire new customers. Surveys can be used to see which advertising messages are the most resonant and which ads spawn the most interest. Researchers can ask questions centered on comparing full ads, or parts of an ad such as the imagery, a video snippet or the copy.
- Branding: This discipline involves creating a reputation, an image and a set of associations around a brand. Branding helps brands differentiate themselves from one another, along with establishing a style that a company is easily remembered by. Businesses can tie their surveys to branding by creating surveys to test new logos, slogans, a unique value proposition, content ideas (for example, if a company that sells electronics seeks to attach lifestyle content to its branding) and more.
- Market Segmentation: This macro-application refers to studying customers closely by dividing a target market into smaller segments. After all, a target market includes all the customers most likely to buy from a particular business, but it is not solely defined by one group. At their core, business surveys are designed to understand customers to a T. With this said, researchers can form personal questions about their target market’s habits, lifestyles, preferences and more to distill them into several segments. From there, marketers can adopt different marketing campaigns for each segment.
- PR: Public Relations, or PR, as it is commonly referred to, aims to control the distribution and spread of information about a company (or individual) and the public. Its goal is to control the narrative of a business or organization to gain positive public perception. Surveys can help on this front in that researchers can design questions on how well respondents know a business and their general thoughts on its operations, products, experiences, performance, etc. Researchers can also test out press release ideas and pitches through these surveys.
Turning to Secondary Research
After filtering your curiosities and questions into a specific macro-application, you need to find all the available information surrounding this application as it relates to your survey subject. This means, before setting up your survey, researchers ought to turn to secondary research.
This is because you wouldn’t want to forego key data already conducted and made available. If you do, you’ll ask redundant questions, wasting both time, money and your survey on matters you could have found from secondary sources.
There are various secondary resources available online. These include webzines, trade publications, news sites and statistics websites. Additionally, research departments in universities launch their results online, which is especially if they cover your sector. You will need to visit these but the ones that study your particular industry and niche. MarketResearch.com is an efficient secondary source, as it covers timely reports across a gamut of industries.
Scrutinizing your competitors' digital properties is also a useful way to understand your target market, as it is shared (otherwise they wouldn’t be your competitors). B2B businesses in particular often publish reports on their industry, which often covers customer insights.
Researchers should collate and carefully organize the key and auxiliary findings they’ve gathered. To do this, creating a document to store all the information is necessary. The insights in the document will help in putting together surveys.
Preparing Preliminary Questions
After you’ve chosen a macro-application and gathered secondary information on it in relation to your industry and target market, you can advance to the preliminary question stage.
In this stage of building effective surveys, you should revisit some of the original curiosities and questions you wished to inquire of your target market. The most practical way to move forward is to cross-reference these original questions with the document of secondary research information.
Here is what to consider when doing so:
- Does any of the information you’ve found from conducting secondary research answer any of your original inquiries? If so, you won’t need to use the same questions in your surveys, unless you would like to extend the information from those questions. Perhaps the information you gathered answers only part of your question, or only about one segment of your target market.
- In these cases, it is apt to use the original question in your survey planning as a preliminary question. You can also evolve questions to make them veer in a slightly different, but not altogether different direction.
- Continue cross-referencing until you’ve gathered at least 10 questions you would like to see answered by your target market.
- Do any of them intertwine or focus on a similar topic? If so, consider grouping questions together, to determine if they’ll require being used in one or multiple surveys.
- When you’ve put together your preliminary questions, it’s time to contemplate the kind of study you’ll need to employ.
Choosing a Methodical Form of Survey Studies
Survey research entails much more than simply launching surveys through an online survey provider and waiting for results to pile in. Rather, it requires a more methodical approach, one with a particular timeframe and pipeline.
There are several forms of survey studies that are time-dependent. The following explains them:
- Retrospective Studies: Also called historical research, a retrospective study gathers data on occurrences that have already happened. As such, respondents discuss their past opinions, happenings and other memories in these surveys.
- Cross-Sectional Studies: A study in which research that gathers research about a targeted population at one fixed point in time. This type of survey research method is known as being a snapshot of a studied population.
- Longitudinal Studies: A study that gathers data on the same set of respondents over a period of time. This kind of research grants researchers the ability to closely examine the trajectories of their subjects over time (weeks to decades).
- Prospective Studies: A longitudinal cohort survey study that gathers data from similar respondents with a few dissimilar factors to determine how those factors affect a particular outcome.
Identifying the Correct Survey Research Method
After choosing the most suitable time-based survey study method, you need to identify another research method to carry out your survey studies. This kind of method deals primarily with the observational style and type of analysis you’ll need to conduct from your survey studies.
There are many different forms of survey research in this regard. The following lists the chief three such methods.
- Descriptive Research: This form of survey research is planned in advance and designed to extract data that can then be used for making statistical inferences on a target market. Aa such, it is considered conclusive and requires conducting quantitative survey studies.

- Exploratory Research: This kind of survey study is critical for the marketing and strategy aspects of a business. As opposed to gathering quantitative research, it focuses on discovering new ideas and insights, especially those pertaining to a target market and industry demands. In online surveys, exploratory research is often conducted via open-ended questions. This research method is qualitative, seeking to further grow a business and define company goals.
- Causal Research: Also quantitative and planned beforehand like descriptive research, this form is therefore deemed conclusive. Casual research seeks to discover the cause and effect between variables. It isn’t a form of observational research, as descriptive research is, however, as it sets to determine causal relationships via experimenting.
Opting for the Proper Survey Type for Your Survey Studies
When you have a steady strategy of the research methods your survey studies will apply, it’s time to adopt the proper survey type(s) for your survey study needs. Various survey types can be applied to different survey research methods.
In this regard, you can opt for survey types with your chosen research methods in a mix and match fashion. This is because different survey types are flexible; they have the potential to satisfy a bevy of research methods, including both time-based and analysis-based methods. The deciding factor for the survey types you implement is dependent on the subject of your study.
The following lists the different types of surveys to use in your studies. Several have their own sub-types of surveys.
- Customer Satisfaction Surveys:
-
-
- Gauge customer satisfaction with products, services, experiences & more.
- Includes the following subtypes: Net Promoter Score (NPS) surveys, Customer Satisfaction Score (CSAT) surveys, Customer Effort Score (CES), Visual RAtings surveys and custom surveys.
-
- Event Evaluation Surveys:
-
- Evaluate the experience and performance of participants in an event within the eyes of attendees.
- Can exist in print form (distributed at the event) or in online surveys.
-
- Brand Awareness Surveys:
-
- Measure how well your target market knows about your brand, along with providing opinions on its key features (logos, reputation, efficiency,etc.)
- Ideal for branding campaigns and before employing survey studies on advertising.
-
- Lead Generation Surveys:
-
- Purposed to gain contact information from your target market and reveal the types of individuals who make up your target market.
- Great for market segmentation and early research (before other survey types).
-
- Job Satisfaction Surveys:
-
- Used to understand how members of your target market feel about their jobs, a critical force in their identities and whether they can afford your product/service.
- Helps you learn which respondents are more satisfied with work/ income, thereby revealing which segment is more likely to spend.
-
- Employee Feedback Surveys:
-
- Used in businesses for internal purposes surrounding their own employees.
- Helps understand current pain points, successful and poor management styles, best HR incentives and how to improve processes and communication.
-
- Consumer Loyalty Surveys:
- Calculates how many and if members of your target market are loyal to your brand and your competitors.
- Helps brands reap customer loyalty.

Crafting the Questions for Survey Studies
Once you’ve chosen the most fitting survey types to use in your studies, you can finally move on to the survey itself. A sturdy online survey platform will allow you to get creative, granular and analytical with your survey production.
First, create a specific list of demographics and behavioral characteristics you will need to examine in your survey studies. Preset these requirements in the screening section of your survey tool. You should set quotas to assure you’re obtaining the appropriate respondents in your survey.
Next, consolidate your preliminary questions with the new ones you’ve come up with while identifying the correct research methods. These oftentimes influence the kinds of questions you’ll need to ask. This also requires organization, as certain questions will belong on different surveys.
If you’re struggling to form relevant and useful questions, read our guide on writing survey questions. When you’ve come up with questions, considering adding layers to your survey. For example, a particular answer that one respondent answers with may require a different follow-up question than that which another respondent answers with.
Sometimes, this requires creating different question paths for different types of answers. You can achieve this by applying advanced skip logic into your survey. Your online survey tool of choice should allow you to add media files (images, GIFs, video snippets) to make your survey more engaging.
Remember to keep your surveys so as to avoid survey attrition. Now that you’ve come up with the questionnaire questions, review your entire survey. Make sure you’re asking the questions that will help flesh out your survey studies.
Once you do that, you’re ready to launch your survey.
Other Considerations for Survey Studies
There are several things you need to consider for your survey studies, most of which are dependent on the online survey platform you use. These involve ease of use, respondent capacity, publisher networks (where the surveys will be deployed) and many more user experience (UX) capabilities.
For example, in the aforementioned survey types section, there are dozens of surveys you can form for both research and business purposes. It is key to use a platform that can provide structures and elements for all, or at least for the kinds you need.
As for ease of use, assess the difficulty in using an online survey tool. A strong survey platform allows you to make a survey in three easy steps. When you thoroughly vet a survey platform, you can objectively decide which is best for your survey studies.
[wp-faq-schema accordion=1]

How to Avoid Survey Bias in Your Market Research
How to Avoid Survey Bias in Your Market Research

Survey bias is one of the biggest roadblocks in market research. Although online surveys are powerful agents in gathering primary research, they are susceptible to unreliable and sometimes inaccurate results. This is due to survey bias.
Unfortunately, survey bias is inevitable, as several aspects can contribute to inaccurate results, many of which are out of the researchers’ control. However, understanding the main types of biases that can arise is critical for avoiding them.
While no one can fully weed out bias from surveys, there are certain measures researchers can put into practice to fend them off. This article illustrates the makeup of survey biases and how to avoid them.
For more information on survey bias, read the Pollfish Ultimate Guide to Remove Sampling Bias and More. This article will cover certain biases not mentioned in the guide.
Defining Survey Bias
Survey bias is an encompassing term that does not simply refer to results that are unrepresentative of a studied population. Survey bias is a general term for a variety of biases that influence respondents to provide dishonest or inaccurate answers. These invalidate the findings of a survey.
There are two main types of biases that occur in survey research: survey errors and response bias.
Survey Error
This type of error is rendered when researchers use faulty means in creating a survey, i.e., its screeners, quotas, questions, etc. Referring to the survey-production process, this type of error can also occur in administering a survey and even in post-survey analysis.
The latter is known as researcher bias. (More on this in a few sections below).
The survey error is a type of bias that lies entirely on the researchers’ end, as they are responsible for producing the surveys and their processes. As such, it can be avoided via actions taken on the part of the in-house or external research side of the survey campaign.
Response Bias
Unlike the survey error, which comes from the researcher side, response bias occurs from the survey participants, i.e., the respondents. Response bias occurs when respondents are influenced into providing answers on a survey. A general term, this type of bias can result in a variety of inaccurate responses. This bias can appear either deliberately or subconsciously from the respondent.
Respondents can be influenced to answer questions in a particular way or they may exhibit reluctance to provide accurate answers themselves. In this regard, there are many types of survey respondents to look out for.
As a market researcher or survey maker, you ought to ensure you’re implementing efforts to reduce the many varieties of these two main survey biases.
Survey Errors
Construed from the research end of the survey research process, survey errors can occur in the questionnaire, the screener, the distribution/collection stage, or from the interpretation of the researchers themselves. Here are the key survey errors prone to occur on the research side and how to avoid them:
1. Sampling Bias:

This relates to a bias that occurs in the respondent selection process, specifically when a survey sample (group of respondents) is not chosen at random, or not completely at random. This leads to under or overrepresentation of a certain segment of your targeted population, as only certain types of respondents are taking part.
How to reduce sampling bias: Researchers need to employ several methods of distributing their surveys, so that respondents are as randomized as possible. This includes making mention of it on emails, websites, social media and even physical locations. Alternatively, researchers can use an online survey platform, one which features a large network of publishers. This will ensure that the survey is exposed to thousands, if not millions of people online.
2. Survey Scope Error:
This error occurs when researchers leave out critical questions needed to fully complete the research around a topic. This results in incomplete findings that require follow-up surveying, which is only possible if researchers use a survey panel. Otherwise, despite deploying surveys to the same market segment, you won’t receive answers from the same respondents due to the nature of random device sampling found in many online surveys. Survey error renders survey research to lack critical aspects of a topic or inquiry.
How to reduce the survey scope error: Create a list of questions and answers before setting up your survey. Consider the answer options you give, will any of them require further probing? If so, create question paths to send respondents to the appropriate question based on their previous answer. This allows you to probe deeper into a topic or subtopic. Follow-up questions can be open-ended. If you require too many questions, making for a long survey, consider breaking up the survey based on subtopics as online users are unwilling to answer lengthy surveys, no matter how well-built the survey platform you use.
3. Order Bias:
This refers to the bias that arises due to an ill-conceived order of questions and answer choices. This is to say that this bias occurs when questions asked early in the survey affect how respondents answer questions later on in the survey. Order bias can exist in two varieties. One is the assimilation effect, where the response to a concluding question is based on the former questions asked.
Ex: When conducting a customer satisfaction survey, researchers ask several questions on the CX of a brand, with the final question on the overall experience. The questions leading up to the final question all deal with similar aspects of the experience, therefore influencing the response to the final question. In this case, the response to the final question would be similar to the former questions. Asked on its own, however, it would likely receive a different response.
The second type of order bias is the contrast effect, wherein the response to a concluding question is not similar to prior questions, but more severe in comparison to them than it would be if it was asked earlier on or by itself.
Order bias can also occur due to the types of answers the researcher provides in multiple-choice questions, as respondents prefer to answer with the first few responses.
How to reduce order bias: Randomize question and answer options. It also is key to reduce the number of scale questions per survey. When too many such question types are used, you are bound to create the assimilation or contrast effect. Ask questions that better engage respondents; include multiple and single-selection answer questions, questions with visual elements and open-ended questions.
4. Purpose Creep Error:
This refers to the error that emerges when researchers include unnecessary items in a survey, typically for the sake of obtaining an exhaustive data collection. This action is called a purpose creep. Essentially, this kind of action creates superfluous data, the kind researchers won’t need to use when analyzing or presenting their findings.
Furthermore, in an attempt to avoid discarding data, researchers may study unneeded aspects of the survey, such as demographics that aren’t needed or tidbits about the target market that are not entirely relevant to examine. Asking unnecessary questions can also negatively affect the respondents’ experience, leading them to answer untruthfully or leave surveys incomplete.
How to reduce the purpose creep error: Consider the key demographics, screening questions and topics you need to base your survey on. When you prepare questions, look them over before launching the survey to see if there is anything redundant. While some aspects may seem interesting, they may not be entirely pertinent to the survey and overall study.
Survey Biases
Survey biases occur within the respondents themselves, commonly when they are influenced to answer or behave in a particular way. It can also exist from within, meaning that the respondents are inclined to misunderstand questions or easily get bored. Here are the key survey biases common on the respondents’ side of survey research and how to avoid them:
1. Acquiescence Bias:
Also called agreement bias, this bias occurs when respondents gravitate towards positive or agreeable answers. In this bias, respondents will exhibit the propensity of frequently choosing answers with positive associations. They do this as these answers feel like the correct choices. This kind of bias is more prevalent in Asian cultures, as a study found.
This bias also rears its ugly head when respondents feel tired and thus answer questions without applying any thought to them.
How to reduce the purpose creep error: Create questions with answers that don’t allow respondents to make positive or negative associations. As such, researchers should avoid using questions that ask if the respondent agrees with an idea. For example, instead of asking:
Do you agree with the following statement? "I found the new feature easy to use."
- Agree
- Disagree
Ask,
What do you think about the new features in terms of ease of use?
- I think the feature is easy to use.
- I think the feature has to be studied.
2. Prestige bias:
Prestige bias is tied to respondents’ social desirability, as it deals with responses made specifically to be seen positively. This can manifest in instances where respondents are asked about their income or their associations with notable actions. In these cases, respondents exaggerate to make their circumstances appear more socially desirable. Many times, this bias occurs indeliberately, as respondents may recall memories in a way that’s more favorable to them as a subconscious way to protect their reputation.
How to reduce prestige bias: Screen your survey participants for their knowledge of certain things relating to the study. Also, be sure to preset the audience with demographics that fit a certain level of education. Ask questions in a way that avoids cheating positive or negative associations. Also, it will help to add a disclaimer at the beginning of your survey, that claims it is a judgment-free study and solicits respondents to answer honestly.
3. Demand Characteristic bias:
This bias develops when a demand characteristic is present. This phenomenon denotes cues in the survey that unintentionally influence how responders answer questions. A demand characteristic can take place if the researcher gives away the purpose of the survey or study. As such, the main purpose of a survey should not be overt in the setup of a survey. When a respondent knows the purpose of a study, they may purposely provide answers to influence the study, especially if this will benefit them. Ex: if a survey is conducted to determine a municipal law, the respondent may provide answers that would make the outcome of the survey favorable to them.
How to reduce demand characteristic bias: Researchers should keep the main purpose of a survey private. As such, they can forgo a welcome page that respondents would otherwise see before taking the questionnaire or answering the screening questions. The wording of the questions should not make the purpose of the study too obvious; therefore, researchers can use analogies and keep certain topics vague.
4. Random Response bias:

This bias comes into being when a respondent does not know how to answer a question, but does so anyway, creating inaccurate results that are random at worst. In this scenario, respondents guess an answer rather than providing authentic information. This bias is also exhibited when respondents don’t read the questions, deliberately randomly answering them to quickly finish the survey. This is usually seen when there is an incentive that requires completing the survey.
How to reduce random response bias: When forming the questions, consider your target market with them. Will they understand your questions? Will they know how to respond accurately? Avoid asking questions that deal with how respondents perceive others to think or behave. To catch this bias in action, add trigger items, such as an item that is opposite to another, or reverse scoring to catch potential bias.
Staying Clear of Survey Bias with the Right Online Survey Platform
While providing a potent channel for primary research, surveys are bound to incur bias, whether it manifests in survey errors or survey bias. Often, survey errors — those which are made on the part of the researchers, generate and influence survey bias — which occurs on the part of the survey subjects, i.e., the respondents.
Therefore, researchers should always scrutinize their survey efforts, both in the screening and questionnaire portions of the survey they’re launching. An online survey platform can help minimize errors as a potent one provides randomization of respondents and many question-and-answer option setups.
While certain biases are unavoidable, researchers ought to carefully assess the online survey tool they intend to use for their survey research.
[wp-faq-schema accordion=1]

The History of Survey Platforms & Technology
The History of Survey Platforms & Technology

In the time since the first survey was conducted, surveys have evolved to become one of the most common methods of researching groups of people. Survey platforms have further revolutionized the way we collect and analyze data, making it easier for researchers to identify trends and draw conclusions more quickly and accurately.
Interestingly, the need to conduct surveys and manage the resulting data was one of the driving factors in the development of early computing technology. While survey platforms are a relatively recent concept, the development of computing technology to support survey data has been around much longer.
This article presents the history of survey platforms to show just how online survey tools have morphed into the market-research powerhouses of the digital age.
Well-Known Early Surveys
Surveys have not always been a standard component of research, in fact, they have been in use for less than 200 years. The earliest known survey was conducted in 1834, by the Statistical Society of London. It was a simple, door-to-door survey that sought to understand the occupations of people living in Manchester, England.
The American Community Survey (aka, the US Census), conducted every 10 years, is likely the most well-known American public survey. This massive undertaking seeks to obtain demographic data about every household in the United States via a survey. The manner in which it has been conducted has changed dramatically since its conception in 1790.
During the very first census, the count was performed via a physical visit to every household in the United States, but this gave way to phone, mail, and eventually online data collection.
Nielsen ratings are another example of prominent public surveys. Conducted every year since 1947, this survey collects information about how Americans of various demographics consume media. Media outlets, businesses and marketers rely upon these surveys to make decisions about how to evolve their products, choose the proper media advertising channel and run effective marketing campaigns.
You may wonder how these massive amounts of data were collected and analyzed before the existence of computers. Interestingly, it was the need to collect and organize exactly this type of data that led to the development of computing power.
The Punched Card Tabulator

The development of the punched card tabulator marked the first major breakthrough in the way we collect survey data. In the late 1800s, the United States experienced unprecedented population growth, due to the large number of immigrants migrating to the country. When it came time to conduct the 1890 census, government officials noted that it would take over 8 years to count the resulting data from the census.
An enterprising young engineer of the time, Herman Hollerith proposed a solution. He designed a system whereby a paper card with a series of punched holes would represent each individual’s census information. While the collection of this data was manual, the processing of the information could now be automated.
Thanks to Hollerith’s creation, the census count took just two years and saved the US government $5 million. Hollerith turned his machine into a business, which he named the Tabulating Machine Company.
His machine soon became commonplace in the back offices of a wide variety of industries throughout the world, including railroads, oil companies, drug manufacturers, utility companies, and large department stores.
His machine was later sold to the Computing-Tabulating-Recording company (C-T-R), which evolved into IBM in the 1920s. His design transformed data processing in nearly every industry in the world and paved the way for the development of the computing giant, IBM.
Punched Card Statistical Analysis & the Rise of IBM

The creation and subsequent development of IBM into a computing super-giant had its very roots in survey data collection.
In 1928, IBM introduced an evolution of Hollerith’s punched card tabulator and named it the “IBM Computer Card,” which was commonly referred to as the IBM card. Remarkably, this seemingly simple invention was one of IBM’s most important technological advances and was responsible for the rise of IBM as the data processing giant in the early 1900s.
Today, with the proliferation of data and computing systems, it seems hard to believe that IBM’s cards held nearly all of the world’s data for almost half a century. Not only did the cards advance data processing, but they created a steady profit stream that allowed IBM to develop into the company it is today.
The IBM card allowed customers to store a large amount of data, thanks to its 80-column format and character codes. The challenge then was to develop a system that could make sense of the huge amounts of data that were stored on these cards. The device used to process this information was known as a tabulator.
During World War II, IBM developed the earliest type of supercomputers in order to process data that was stored on these cards. While these computers looked and acted nothing like computers today, the concepts used to convert and process data stored on physical cards into a digital format set the foundation for the later development of modern computers.
Computer-Assisted Survey Information Collection (CASIC)
From the 1950s, the use of computers to assist in the collection and analysis of survey data became more frequent. The use of computers in any aspect of survey creation, distribution, or analysis, is referred to as computer-assisted survey information collection (CASIC).
CASIC made it easier and faster to compile, store, and analyze data, which increased both the popularity and reliability of surveys. Computers helped lower the cost of survey research, reduced errors during data entry, and improved data quality by eliminating interviewer bias.
Before the existence of the Internet, computers were utilized in various ways to support survey research.
Applications of the CASIC
Here are some of the many ways that computers were used to collect survey data:
- During phone or in-person interviews, the interviewer reads from a computerized questionnaire and enters the respondent’s answers.
- An individual sits at a portable computer to read and answer survey questions.
- Surveys are distributed to respondents via a floppy or optical disk, which is returned by mail.
- Touch-tone data entry (TDE) allows the respondents to answer questions by phone by pressing numeric keys.
- Respondents answer questions by phone, which are then recorded and automatically transcribed into text.
In each of these modes of collecting survey data, the information is digitized, making it easier to store, analyze, and update the data with subsequent survey iterations.
The Development of Online Survey Platforms
While surveys have been in existence for nearly 200 years, the relatively recent development of online survey platforms marked the most dramatic evolution in how surveys are conducted and analyzed. The ability to oversee the entire lifecycle of a survey from a computer represented a fundamental change in the world of market research.
Before the advent of online survey platforms, the process of creating a survey, distributing it, and then analyzing survey data was a cumbersome and time-consuming process, even with CASIC technology. With the development of online surveys, survey research has become a critical tool for a wider range of research fields, such as marketing, social studies, and official statistics.
Online survey research offers distinct advantages in comparison to pre-Internet CASIC methods. These include:
- More cost-effective
- Easier to design and develop
- Faster data collection and processing
- Option to include advanced skip logic
- Ability to provide inline support to respondents as needed
- Ability to respond to the survey on any device
Online Surveys for Businesses, Banks Government Entities & More
Today it is hard to fathom how surveys were conducted before online methods were available. It required a staggering amount of manpower and determination to collect data from populations and then make sense of that data.
Thanks to online survey platforms, surveys are widely used to collect information about any number of topics. Whether they contain one question or hundreds, surveys have become commonplace in our study of the world around us.
Surveys can be deployed in a matter of minutes, giving businesses an easy way to understand their customers in order to improve their products, services, and interactions.
[wp-faq-schema accordion=1]

The Best Survey Incentives to Increase Survey Participation
The Best Survey Incentives to Increase Survey Participation

Survey incentives are invaluable to the online survey experience; market researchers and business owners benefit by implementing them into their surveys to increase participation.
This is largely because taking part in a survey, brief as it may be, is not everyone’s cup of tea. In fact, survey response rates fall on the lower end of the scale, with online survey response rates totaling to roughly 26%, aka under one third.
It should come as no surprise that many online users simply have no interest in taking a survey, as they are exposed to so many other on-site elements that draw their attention.
In this way, having a survey distributed on a popular website or app can be a drawback, as users’ attention can easily be consumed by the contents of their digital environment.
Survey incentives are proven to increase survey response rates, thereby increasing target market respondents in your survey. Additionally, by adding more appeal to a survey, online survey platforms can accumulate more completes in a quicker time
This article will cover survey incentives, why they matter and the best kinds to use to increase survey participation.
Defining Survey Incentives
As its name suggests, a survey incentive incites survey participants (or targets) to complete a survey by gifting them with some kind of stimulus.
Incentives can take various forms, which is where marketers and market researchers can let their creativity take the wheel. This is useful as brands often reveal they are behind a survey when they provide incentives (unless their incentive strategy involves partnering with the publishing websites of their surveys, in which case, the publishers are attributed with the incentive).
Regardless of who gets credit for providing the incentive, it is necessary to draw in interest and truthful responses from online visitors. It is also a valuable way to thank survey respondents, as a thank you note alone will not suffice.
Monetary Vs Non-Monetary Survey Incentives
 Incentivizing respondents is divided into two major forms: monetary incentives and non-monetary incentives. Both are effective drivers of survey engagement and can drive repeat participation, the latter of which is critical for longitudinal studies.
The following expounds on both chief incentives.
Monetary Survey Incentives
These are money or currency-based gifts that researchers use to reel in survey respondents. The responders receive the incentives only after completing their surveys. A potent online survey tool ought to be able to distinguish between a fully completed survey and an invalid survey.
For example, it should be able to mark gibberish answers and identify flatliners and other types of suspicious survey respondents.
Here are a few useful monetary incentives to employ, including best practices on when and how to use them.

- Cash (Via direct deposit or a digital payments system, i.e., Paypal).
-
-
- How much? It depends on the length and audience of the survey. Ex:
- A five-minute survey for students should be incentivized by approx. $1-$10.
- A 20-minute survey for clinicians, scientists and other professionals should be $30-$100.
- How much? It depends on the length and audience of the survey. Ex:
-
- Gift cards
-
- Gift cards to your own business will not solely be an incentive but will draw attention to/promote your business. It will also not cost brands any money (as the card is redeemable at their business).
- Gift cards to popular retailers within your target market. This requires running primary and secondary market research to understand and segment your target market.
- The price range should correspond with the time required for the survey. Ex: $5-$15 for a survey taking about 15 minutes.
-
- Coupons
-
- Like gift cards, coupons can be offered to your business, or a popular one among your target market (NOT your competitors’).
- Coupons should offer markdowns and discounts on popular products and services.
- The offer should hover around 25% off.
-
- Checks/Money Orders
-
- Will require collecting more personal information from respondents, such as addresses. This can serve as proof of residence in a particular demographic area if you need residents of a specific geographic location.
- Keep the price ranges congruent with the amount of time/effort of a survey.
- Ex: $5-$15 for surveys taking 10-15 minutes.
-
- Donations to Charity
- These are donations you send to charities or causes for the better good when respondents complete a survey.
- Brands can give respondents the option of sending the donations on their behalf, i.e., with their names as the donors.
- This involves picking a charity that relates to your niche and is recognizable by your target market.
- The price range can be concrete — $1-$20, or it can be expressed as a percentage, i.e., 10% of profits will go to a charity.
Non-Monetary Survey Incentives

These incentives coax respondents to complete surveys through non-monetary offerings. They still offer something of value to the respondent. This is a more practical use for B2B brands, as small monetary incentives often won’t be enough for, let’s say a SaaS company. This opens the door for more types of incentives.
Below are some of the kinds to employ, along with their best practices.
- Product Samples
-
-
- These allow businesses to save money and resources. Plenty of people may send requests for product samples, but are they actually considering making a purchase? This answer may vary. But when you use samples as an incentive, you are guaranteed to gain something critical in return: customer data.
- These samples should correlate with the efforts required for the survey. As such, small surveys should call for small samples (think in terms of both size and type of product).
-
- Trial Subscription
-
-
- Much like samples, these offer a sampling of a service. If you offer media such as online magazines, news sources, trade publications or video content, consider offering a free or freemium trial.
- The trials should run no more than 4 days to a week.
-
- Loyalty Programs
-
-
- Both a practical non-monetary incentive and a method for building customer loyalty, this type of program will give respondents a taste of what your top customers gain when earning loyalty points, likely stoking their interest in your business.
- Loyalty programs work by offering points, which help customers earn freebies or other perks.
- Offer 1-2 loyalty rewards at most for survey completion.
-
- Company Literature
-
-
- Most useful for B2B respondents, who are intent on learning about a particular discipline that your brand offers in its marketing content.
- Examples include white papers, industry and consumer reports, webinars and video content.
- This is most ideal when studying professionals or hiring survey panels.
-
- Partnership Benefits
-
- This is a mutual incentive for companies that want to partner up for collaborative survey research. (Ideal for both B2C and B2B businesses, including SaaS companies)
- How it works: Your business grants small discounts to the partnering company’s customers; the partner business follows suit for your customers.
- Partnerships and other business affiliations provide more exposure for your business.
Hybrid Incentives
When brainstorming survey incentives, you need not rely on one of the chief, aforementioned methods. This is because you can merge these approaches by offering multiple incentives. This is especially useful when dividing surveys across market segments, as certain segments may be more receptive to one form of survey incentive over the other.
Additionally, there are methods that allow you to offer either monetary or nonmonetary incentives. Here is the following list of such means:
- Sweepstakes
-
-
- Also called a raffle or a drawing, sweepstakes provide an exciting opportunity for respondents to win a prize, when chosen at random.
- The prize can be monetary or a product, service, experience, etc.
- Every respondent taking part in the survey should have an equal chance of winning.
-
- Giveaways
-
-
- Similar to sweepstakes, giveaways allow respondents to win something either monetary or nonmonetary via a drawing.
- However, giveaways can give all survey respondents the assurance of winning something.
- The difference lies in what respondents can receive, not if they will receive something at all, as in with sweepstakes.
- Ex: One responder may win a magazine subscription, while the other may win a coupon.
-
- Games
-
- Following suit with sweepstakes and giveaways, games allow for a more creative way to incentivize respondents.
- Businesses can enter respondents to play a game, granting them the chance to win a prize.
- Only the winners will be sent a prize. This is ideal for those seeking something more than just receiving a reward.
When to Use Survey Incentives
Market researchers and business owners can best benefit from survey incentives to motivate a targeted audience they have less data about. For example, perhaps not all of your quotas on one demographic or psychographic population are being filled. A survey incentive can buttress this obtaining this objective.
Or — perhaps your survey response rates are low. Implementing survey incentives will boost this metric. No one wants to do anything for free, regardless of its simplicity and little timing.
Then there is the case of supply. Some businesses have plenty of leftover samples from a particular campaign, whether it was sending samples to those who requested them or sending goods to other businesses as part of an ABM campaign used in marketing. Rather than discard these items or let them collect dust, you can repurpose them for survey research.
The Online Survey Tool as the Survey Incentive
A robust online survey platform is a necessity for any marketer or market researcher, even with a steady survey incentive strategy in place. This is because an effective online survey tool won’t stop iterating surveys across a wide online ecosystem of websites and apps until it receives ALL the preset number of survey completions.
However, brands would be remiss to completely disregard the survey incentive approach, even with a strong survey platform in tow. This is because offering incentives will cast your business into the minds of your target market, i.e, the most valuable customers and prospects.
The experience of gaining something (the incentive) from a brand is far more memorable than simply taking a survey that mentions a brand.
Thus, by providing customers with a survey on matters relevant to them and offering them an incentive, which can be your company’s product, you are differentiating your brand from that of your competitors.
[wp-faq-schema accordion=1]
What to Expect from an Online Survey Tool: The Pros, Cons, Applications & More
What to Expect from an Online Survey Tool: The Pros, Cons, Applications & More

The online survey tool is the foremost tool for gaining customer intelligence for various business and research purposes.
As the digital landscape expands and competition stiffens, businesses are vying for online consumers more than ever. As a matter of fact, there are between 12 million – 24 million ecommerce websites worldwide and these figures continue to rise daily.
Tapping into the minds of customers is thus a necessity for businesses across verticals. As such, one of the most effective methods to conduct primary research on a target market is via an online survey tool.
This method systematically gathers data from respondents by inciting them to take part in various websites and mobile apps.
The internet in general is a sufficient tool for conducting secondary research. An online survey tool couples the internet as a means of distributing the survey, along with the traditional questionnaire.
This article explores what researchers and businesses alike can expect from the online survey tool.
Defining the Online Survey Tool
This tool merges the digital space with surveys, as it is a kind of software that allows researchers to form a questionnaire, set rules on respondent qualifications and deploy the full survey across partnering websites and apps.
The survey portion of the tool often incorporates two major components: the screener and the questionnaire. The screener portion allows researchers to set conditions on who to permit to move on to the questionnaire.
It collects demographic information, as market research and virtually all others aim to study particular demographics. It also has a section for screening questions, the answers of which determine whether the respondents are qualified to take part in the survey or not.
Researchers can input any question they wish to receive a particular response. Therefore, this portion allows researchers to take a granular approach to who takes the survey. The questions can delve further into demographics, or ask about psychographic or behavioral matters.
There are several things to look for in an online survey tool. There are also various business applications of this sort of tool. In this way, brands should consider it as more than merely a vehicle for collecting question-based data.
Instead, it can provide valuable feedback on critical business matters, such as for improving marketing efforts, advertising, branding and others.
Other Key Functions in a Survey Platform

An online survey tool doesn’t simply create and distribute surveys, not if it’s a potent one, that is. A valuable survey platform offers other functions.
For example, with so many survey software available, researchers often take a dual or even multi-pronged approach for their survey research. As such, a strong survey tool will allow integrations between survey tools. This can mean acting as the third-party survey distributor of a survey created in another platform.
Another function involves creating multiple paths in a single survey, so that respondents are only channeled to questions best suited towards their answers. This involves using advanced skip logic, which routes respondents to the appropriate question based on the answer they provided.
For example, if a question asks whether a respondent is familiar with a certain brand, they would need to be moved to a follow-up question about the brand — if they responded with “yes,” but not if they responded with “no.” The latter would require another question that better suits it logically, such as a one about awareness of a different brand.
A strong online survey will also allow researchers to create multiple audiences within one survey. This entails that each audience type can have completely different demographics and quotas for each demographic. The purpose of using multiple audiences per survey is to gain insight across as wide a target population as possible in one interface.
Some survey campaigns will require researchers to do just that.
How Data Is Stored & Presented
Dovetailing off additional functions, an online survey tool stores data and a robust tool can extract the data into multiple formats. The platform itself serves as a database for all the surveys conducted, along with their collected information.
Some platforms enable researchers to extract survey data into various file types. For example, researchers can export their data as cross-tabs (cross-tabulation). This data presentation format allows users to aggregate data and analyze the relationships between variables. The variables are displayed in a matrix, i.e., in rows and columns in a matrix for researchers to quickly find data in corresponding cells.
There are other formats that online survey tools support can export. These include PDFs, Excel sheets and SPSS. The latter is the statistical analysis and machine learning tool from IBM.
While these help create a more diverse survey research campaign, it is key to note that not all online survey tools include these kinds of data exports. Some may have fewer options, while others none at all.
Aside from different formats of exported files, the data displayed per each survey can also be viewed in different ways. These include tables, pie charts and column charts. These options grant researchers the ability to choose the visualizations they’re most comfortable with, or those that are best for a particular purpose. For example, presentations may require different displays than a research document.
A practical survey platform will offer several layouts to view and store data.
The Pros
Online survey tools offer a variety of advantages for market research and research for other sectors, such as medicine, psychology, other sciences and more. Here is a list of all the benefits you can obtain from an online survey tool.
- Ease of data collection: The online survey tool you use does all the heavy lifting for you in many ways, including collecting participants from your target market. That means no more worrying about how you’re going to get survey respondents to take your survey.
- Access to a wide pool of consumers: This kind of tool (the proper variety) deploys your surveys to a massive network of internet and mobile app users. Since millions of users frequent the web every day, you can rest assured that members of your target market will be exposed to your survey.
- Saving time and workload: Face-to-face interviews, focus groups, phone calls and the outdated mail-in surveys take too much effort to execute. Besides being more labor-intensive, these methods will also consume a great deal of time that you could be spending on other market research efforts, such as secondary methods, along with other business matters. Online surveys free up much of the time you would otherwise spend on the above methods.
- Insights into personal and sensitive topics: This does not include things like names, addresses and other identifying information. Rather, an online survey tool emboldens brands to ask more personal questions, the kinds that deal with politics, social issues and matters that are private to respondents. These kinds of questions would be discomfiting for respondents to answer face-to-face and even on the phone. But with online surveys, they are granted the confidentiality to give honest answers, including in-depth answers on sensitive matters (via open-ended questions).
- Easy set-up: An online survey tool makes it easy to create a survey and design it precisely to a researcher’s needs. This makes it easy to come up with question types, as this tool offers a variety of them, such as matrix questions, rating scale questions, Likert scale questions, single selection multiple-choice, multiple selection multiple-choice, open-ended questions and more. Additionally, this tool makes it easy to add media files for picture choice questions, or a picture-based question. It should make adding things like skip logic free from friction.
- Projected time to complete the survey: A well-built online survey platform will eliminate the guesswork that comes with having your target audience complete a survey. It grants researchers an estimated completion time, so that you will know the approximate time it takes for all your preset survey quotas to be completed by the intended respondent base.
- No cost-based geographic restrictions: This means you can send your survey across the world uninhibited. If your target market has internet access, then they can take part in your survey. Most survey tools don’t charge extra for deployment to specific geographic areas. A strong survey tool also gives you the option of setting up your survey in various languages.
The Cons
As with other market research tools, survey platforms aren’t free of flaws. As such, business owners, marketers and researchers should understand the drawbacks present in this kind of research method. The following lists some of the stumbling blocks of using an online survey tool.
- Ingenuine answers: No survey is foolproof. Sometimes, the respondents may become bored or tired when taking a survey. Thus, they provide answers that are not accurate to their real opinions and phenomena that occur around them. There are flatliners, those who answer with the same choice in a multiple-choice question consecutively across many questions. Then there are the self-explanatory rule-breakers, who break survey participation rules by lying. There are several more survey respondents to look out for.
- Some populations have limited availability: Not all members of your target market have quality internet access. Some market segments, such as those who live in particular geographic areas have restricted internet access. This is evident in rural parts of the USA and poorer regions across the world. This can be especially difficult if you run a nonprofit and would like to learn more about a needy population.
- Responses are not always representative of a population: Surveys provide valuable insights, but this data is not always representative of a targeted population. Sometimes, this will require running multiple surveys, or increasing quotas. Also, since certain consumers change their minds, a survey tool will not catch this unless there are follow-up surveys sent to the exact same users who took an initial survey. You will need to pay attention to the margin of error to avoid unrepresentative opinions.
- Repeated survey requests may annoy respondents: Depending on the publisher site or app that the survey is deployed in, and the survey tool itself, there may be repeated requests to take the survey. This is bound to irritate users, which carries the risk of their ignoring the survey, or at worst, leaving the site.

When to Use an Online Survey Tool in the Market Research Process
Researchers can employ this kind of tool at virtually any point in their research process. When conducting market research, it is best to begin with sources of information already made available, aka, secondary research. This will guide your business on the happenings, trends and innovations within your sector and niche.
Moreover, you can use secondary sources to study your direct and close competitors. This includes looking at statistics websites, along with blogs, news sites, forums and others that report and cater to your industry. It is also apt to study the websites of your competitors to see how their products, service and experiences compare with yours.
After you’ve gathered a suitable amount of secondary data, you can make certain inferences on your particular marketing plans or other business goals. At this point, you’ll find some unanswered matters arising, at which point you can generate specific questions you need from your target market. This is where the survey process begins.
During this point, it would be useful to design surveys for specific campaigns and aligning the surveys with the needs of a specific campaign.
The Verdict on the Online Survey Tool
Survey research requires surveys, as its name implies. An online survey tool is the most powerful source of primary information, because it allows researchers to ask any questions and get answers relatively quickly from their most sought-after target audience.
This tool supplies all the privacy a respondent needs to confidently and truthfully answer much-needed research questions. Researchers can rejoice in having their surveys distributed across a massive network of online publishers where their surveys will iterate until all the quotas are met and the preset survey amount is completed.
Also, since customers spend much of their time online anyway, why not approach them in their natural digital environment? Thus, despite any flaws or slight difficulties the researchers may encounter, our verdict is that an online survey tool is of the essence for a research campaign.
[wp-faq-schema accordion=1]

Building Effective Prospective Studies with Online Surveys
Building Effective Prospective Studies with Online Surveys

Prospective studies are a powerful form of research to understand how the behaviors, attitudes, feelings, and/or physical attributes of a population develop over time.
Particularly, researchers and marketers are using prospective studies to understand outcomes more broadly. For example, perhaps a brand needs to study how a customer or customer segment developed a certain habit, whether it is favorable or unfavorable to the business.
While researchers typically have a primary objective in conducting prospective studies, the data that is collected over time may reveal factors that were not considered when outlining the study’s original objectives.
Given the large amount of data that is gathered over time, prospective studies are a treasure trove of information for researchers. While it takes time and patience to collect the data, the results of a prospective study may yield completely new or unexpected insights.
Defining Prospective Studies
Once the territory of public health researchers, prospective studies have entered a wider area of study due to the application of survey research.
Prospective studies can help understand the factors that influence anything from consumer loyalty to employee retention to customer churn.
In prospective studies, data is gathered from individuals over a period of time. The data is then analyzed with the objective of identifying associations between variables. Traditionally, prospective studies have been most strongly associated with the fields of public health and medicine.
Prospective studies fall into the broader category of cohort studies, which are used to determine how often a phenomenon occurs within a specified population. Retrospective studies are another type of cohort study but differ from prospective studies in that they investigate an outcome that occurred in the past.
In research studies, the term “cohort” refers to a group of people who share common characteristics, which help define them as part of the sample group. The defining characteristic can be:
- demographic in nature, i.e., age or location
- behavioral i.e. where consumers purchase a product or how they use a certain digital property )
- psychographic, i.e., values, opinions and inclinations.

A unique aspect of prospective studies is that researchers fully plan and design the study, recruit participants, and collect initial information before any of the participants develop remarkable outcomes. Researchers must watch and wait for outcomes to develop before they draw any conclusions.
Prospective studies were previously cumbersome to conduct due to the need to follow a group of people and collect data over longer periods of time, but the use of prospective surveys has made this type of longitudinal research more accessible to a wider variety of organizations.
Examples of Prospective Studies
Some of the most famous prospective studies have been conducted within the field of medicine. The outcomes of the studies mentioned below have helped solidify our understanding of how certain factors influence our overall health.
- The Framingham Heart Study is an ongoing study that started in 1948 with an original cohort of 5,209 healthy individuals located in the town of Framingham, MA. With the objective of identifying major cardiovascular disease risk factors, this study has fundamentally changed our understanding of cardiovascular health.

- The Nurse’s Health Study refers to two of the largest investigations into the risk factors that contribute to chronic disease in women. The studies began in 1976 and have followed a total of 280,000+ participants over three generations.
While prospective studies are particularly useful in following medical developments, they are also used to reveal deep and sometimes unexpected insights in business subsectors and other verticals. Here are some examples of scenarios in which businesses can apply prospective studies:
- Researchers want to understand how early exposure to social media influences the feelings and attitudes of young adults. They plan a 10-year study to follow a cohort of children who are 9-11 years old at the outset of the study.
- A large company decides to investigate the link between certain hiring practices and long-term employee retention. This is done by following new hires over a period of 5 years, or until they leave the company.
- A large online retailer plans a study to understand how buying behavior changes with age. Their prospective study will follow a large sample of 20 - 30-year-old customers for a period of 20 years.
- A SaaS company wants to understand how consumer loyalty changes over time. They decide to conduct a prospective study that follows anyone who signs up for their software subscription during 2021.
- A global beverage company wants to understand how health and lifestyle choices influence customer behavior. They decide to conduct a prospective study following a cohort of Millenials over 10 years to better understand their decision-making process.
Use of Surveys in Prospective Studies
Since prospective studies are often conducted over a long period of time, an important aspect of planning a prospective study is to determine how to collect and organize data during the study. In the past, the enormity of this challenge was one of the reasons why prospective studies were rarely undertaken outside of the public health sector.
The advent of online survey platforms has made it easier to conduct prospective studies and analyze the resulting data. After establishing the cohort, researchers can easily design and distribute surveys at predetermined intervals and allow the respondents to complete the surveys within an allotted period of time.
In comparison to older methods of data collection, such as phone or in-person interviews, online surveys provide a flexible and cost-effective way to interact with the cohort where and when it suits them best.
In addition, data collection is seamless, with data being automatically compiled with each survey iteration. Whereas prospective studies previously required a team that was well-versed in survey data collection and analysis, online surveys have made it possible for marketers to use prospective studies without needing to engage an outside company.
The Pros and Cons of Using Surveys in Prospective Studies
While surveys are a relatively easy way to collect data from a cohort, especially over a longer period of time, there are pros and cons to consider before choosing to use this method.
Prospective surveys are typically more cost-effective than conducting in-person phone interviews over a period of time. You may also experience a higher survey response rate by allowing the respondents to complete the survey when and where it is convenient for them.
If you decide to use an online survey platform to conduct prospective surveys, you will benefit from the ability to more easily complete, export, organize, and analyze data. This is an important consideration if you think about the large volume of data that will be collected over several months, years, or decades.
Since prospective studies are often conducted over a long period of time, the cost of data collection may be a barrier for certain organizations. The use of online surveys can help minimize this cost by reducing the need to hire specialized personnel to design the study and gather feedback.
On the other hand, there are some benefits to conducting interviews or performing physical exams. During the repeated interactions with the interviewer, the respondent may come to form a relationship that helps them feel more comfortable about answering the questions. This may allow for more honest or unexpected responses, which may not occur with the use of a survey.
Similarly, the design of a survey can greatly affect the results. With a limited set of responses, there is less flexibility to uncover unexpected or new responses. This can be avoided by including open-ended questions or text entry fields to submit additional information.
Gaining Deeper Understanding with Prospective Studies
Thanks to online survey platforms, it is possible for more organizations to benefit from the ability to gather data from their respondents over a period of time. If you are looking for a way to gain a deeper understanding of how certain factors influence the thoughts and behaviors of your customers over time, consider conducting a prospective study.
There is no denying that prospective studies take a great deal of effort to plan and manage, but the results of this type of study can lead to completely new insights and understanding of your target market
This allows you to innovate on your offerings, personalize your customer experience (CX) and foster stronger marketing efforts, all of which will help scale your business.
[wp-faq-schema accordion=1]

The Product Satisfaction Survey Question Guide
The Product Satisfaction Survey Question Guide

Product satisfaction survey questions power their namesake survey, which allows businesses to quickly gain valuable information about their products directly from their paying customers.
Well-designed product satisfaction survey questions will not only measure how satisfied your customers are with your product(s), but also provide valuable information about how to improve your product or the product experience.
How you create your product satisfaction survey questions can make the difference between lackluster insights and those that can drive real change for the future of your product.
This article will help you understand how to create strong survey questions that will elicit useful responses that drive improvements, innovations and profitability.
Planning Your Product Satisfaction Survey Questions
The product satisfaction survey comes in a variety of formats and lengths. Your motivation for conducting a product satisfaction survey will influence the survey format that you decide to use.
In many cases, companies will conduct a variety of surveys over a period of time, with each survey type designed to fulfill a specific purpose.
Here are two principal considerations for these questions:
- If your company sells many different types of products, it may be useful to deploy a short product satisfaction survey on each product that customers bought. In order to ensure an optimal survey response rate, your survey questions should remain at just a few critical questions.
- On the other hand, if your company develops high-end products or ones that require a longer period of use before a customer could rate it, you may benefit from surveys that are distributed less frequently but ask more in-depth questions.
In the following section, we provide examples of different types of product satisfaction survey questions. These questions will help you get started, whether you choose to create a survey with 2 questions or 10!
Questions about Overall Product Satisfaction
At the outset of your survey, you should seek to understand your customers’ overall product satisfaction. To get a greater number of responses, consider having just 1 or 2 questions in this part of the survey, followed by an optional second part that dives deeper into the product.
Overall product satisfaction can be understood by asking one or more of the following questions:
- How satisfied are you with this product?
-
-
- If you wish to use the Customer Satisfaction Score survey (CSAT) format, the response should be provided on a 1 - 5 scale, with 5 indicating “highly satisfied.”
- Alternately, you could use a visual rating system using emoticons or create your own multiple-choice responses (e.g. “I love it!” / “It could be better.” / “I regret buying this product.”)
-
- How likely are you to recommend this product to a friend or colleague?
-
-
- This is the golden question asked in a Net Promoter Score (NPS) survey, which is popular because it can help companies quickly gauge overall product satisfaction. The response is provided on a scale of 1 - 10, with 10 being “most likely to recommend.”
- You could also use binary (yes/no) or multiple-choice responses for this question.
-
- How likely are you to purchase this product again?
-
-
- Responses can be scaled i.e.,. 1 - 10, with 1 being least likely, or multiple choice (“I would definitely buy this product again!” / “I might buy this product again.” / “I would not buy this product again.”.
-
- How easy is it to use this product?
-
- If your product has many features, consider using the Likert scale to get responses about each of its features.
Questions about Product Features
If your product has multiple features or uses, you may need to get a better understanding of how each feature contributes to product satisfaction or dissatisfaction. This can help you decide how to improve, create, or retire certain product features.
In this section, you may wish to include a combination of close-ended and open-ended questions to give your customers the opportunity to provide additional feedback.
- Where do you use this product?
-
-
- Multiple-choice response (e.g. “At home” / “At work” / “At home and at work”)
- A Matrix or Likert scale if you want to understand how frequently the product is used in certain situations.
- A text entry field
-
- Why did you purchase this product?
-
-
- Multiple-choice response
- A text entry field
-
- Which of the following features do you use and how often?
-
-
- To quickly gain information about various features, use a Matrix to gather information about the product features. The Matrix can have a list of product features in the first column, with responses along the top row, such “I use it every day.” / “I use it occasionally.” / “I rarely use it.”
-
- How would you rate each of the following features?
-
-
- A matrix with scaled responses is a good way to quickly assess satisfaction with each product feature.
-
- What can we do to improve this product for you?
-
- The response can be a text entry field to give customers the opportunity to provide spontaneous feedback, as you never know where the inspiration for your next product feature will come from.
- You could also use multiple-choice responses to prompt users to think about certain ways to improve the product, i.e., “Improve the on/off switch.” / “Include timer functionality.”
Questions about Price and Quality Balance

How your customers perceive the balance between the price and quality of your product can affect their overall satisfaction levels. These questions can help ensure that your pricing strategy is appropriate for your customer base.
- How would you rate the price of this product?
-
-
- The response may be scaled or multiple choice (i.e.e.g. “Too expensive” / “somewhat expensive” / “as expected” / “less expensive” / “much less expensive”).
-
- If this product was priced at [insert a lower value here], how would you describe your feelings?
-
-
- Multiple choice answers with responses such as: “I would start to doubt the quality of the product and might not purchase it. / “I would think it was a good deal and would consider purchasing.“ / “I think this is a better price for the product.”)
-
- How likely would you be to try this product if it were priced at [enter a value you wish to test here]?
-
- Scaled answer, with 1 being extremely unlikely and 5 being extremely likely.
Questions to Help with Product Innovation
One of the most exciting aspects of evaluating product satisfaction is the opportunity to learn how your customers would like to see your product evolve in the future. This is your opportunity to explore potential features and, potentially, uncover some unexpected ideas.
- Please rate how likely you are to use the following features:
-
-
- For this question, a matrix will allow you to understand how likely your customers would be to use any number of potential features. List out the features and allow users to select from options such as: “extremely likely” / “likely” / “unlikely” / extremely unlikely.”
-
- What is the one thing that you wish this product could do?
-
-
- Multiple choice (list out potential features that could be added)
- Text entry field to allow for free-form responses.
-
- What do you like least about this product?
-
-
- Text entry field
- Multiple choice (list out some of the potential flaws in your product).
-
- What do you like most about this product?
-
- Text entry field
- Multiple choice (list out some of the most important features of your product).
Questions about Product Retention

Finally, you may wish to explore how product retention affects satisfaction. Long-term company profitability has been linked to how long customers keep a product, so this is an important metric to explore. This information can also be used to segment your customers and understand how product retention affects satisfaction levels.
- Did you keep this product?
-
-
- Binary response.
- Those who answered “no” could be directed to the following questions.
-
- If you did not keep this product, what did you do with it?
-
-
- Multiple-choice answer (e.g. “Returned it for a refund.” / “Exchanged it for another similar product.” / “Gave it away.” / “Threw it in the trash.”
-
- Why didn’t you keep the product?
-
-
- Multiple-choice answer (e.g. “I wasn’t happy with the quality.” “It didn’t work properly.” “I found a better price.”)
- Provide an optional text entry field for additional information.
-
- How long did you use the product before you returned or discarded it?
-
- Multiple choice response (e.g. “1 day” / “3 days” / “1 week” / “Longer than a week”).
Tips for Creating Strong Product Satisfaction Survey Questions
Regardless of the type of survey you choose to conduct, it’s important that you give careful thought to each question. Here are some tips to keep in mind:
- Ask questions about overall product satisfaction first, before diving into more specific questions.
- This ensures that you have at least one strong metric to track over time.
- Keep the survey short and focused to ensure an optimal response rate. Aim for 3 - 6 well-written questions (less if you are using the NPS or CSAT format).
- Give participants the opportunity to provide additional feedback by including open-ended questions with text entry boxes.
- This type of question should be optional, so it doesn’t prevent other users from completing the survey.
- Consider using a combination of quantitative and qualitative survey questions to gain a 360-degree view of your product from the customer’s perspective.
- Ensure that each question has a single focus. Cramming two questions into one will confuse your respondent.
- Use clear language and avoid using industry jargon. This helps respondents understand each question and pick the appropriate answer accurately.
To learn more about creating powerful survey questions, visit our comprehensive guide about creating survey questions and responses.
Better Planning with Product Satisfaction Surveys
Product satisfaction surveys are essential tools for granting companies the ability to understand much more than just overall satisfaction levels. These tools can be used to help chart out the course of your product by learning how to improve it over time.
Whether you choose to deploy a short survey or a more comprehensive one, you will gain invaluable data that describes exactly how your customers feel about your product. By taking the time to plan out more detailed questions, you can also make smart decisions about adding new product features and improving or retiring existing ones.
Unlike many other survey types, your audience is preselected, which means you don't need to go hunting for people to take your survey. Once you take the time to create strong product satisfaction survey questions, simply distribute the survey to your customers and get ready to dig into the data.
[wp-faq-schema accordion=1]
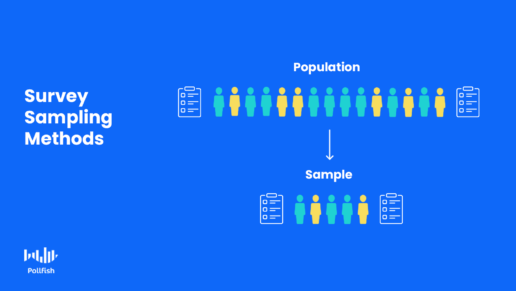
Mastering Survey Sampling Methods for Consumer Intelligence
Mastering Survey Sampling Methods for Consumer Intelligence

Survey sampling methods are a crucial part of the survey research process, as the aspect of sampling is more than just a data collection practice.
This is because in order to glean any valuable insight from surveying, the respondents must be as representative of the study’s target population as can be. The correct survey sampling method can make this possible.
When conducting survey research, there are several sampling methods researchers can leverage. In order to apply the correct method, there are certain things you need to establish. This article delves into survey sampling methods, including the considerations to take before settling on a sampling method for your research needs.
Defining Survey Sampling Methods
Survey sampling methods denote the types of techniques used to select participants from a target market (or any target population) to take part in a survey sampling pool.
In survey research, the sampling pool is the group, or “pool” of targeted respondents who participate in a survey study. This sampling pool must accurately represent the targeted subject population.
It is important to have a group of people who will participate in the survey and be able to represent the whole target population. This group is called a “sample".
Settling on the proper sampling pool is known as sampling, which is critical to surveys, as it makes up the foundation of the survey campaign.
Why Survey Sampling Methods are Necessary
The main goal of surveys is to gather accurate information about a particular population. As such, they would be futile if they insufficiently accounted for the participants that they’re set on studying.
Survey sampling is necessary, as sampling provides a potent means of extracting and analyzing a targeted subset of a population. Even when researchers zero in on a subset, it is still virtually impossible to study the entire population of a targeted group.
The reason is twofold and fairly straightforward: not all members of a particular population will be exposed to a survey, and out of those that do, most will not be willing to spend time filling out a survey.
As such, researchers turn to survey sampling methods, so that their sampling pool best represents the population of researchers’ interest. With the right method, researchers can make well-informed inferences about their targeted population.
Sampling reduces the sampled respondents, which lessens both the workload and costs associated with a particular survey study. However, researchers have to find the correct balance of participant involvement to accurately ascertain associations between variables.
Determining Your Target Population: The Precursor to Survey Sampling
Effective survey sampling occurs when the researchers have established the population subset which they intend to study. As such, you should begin any survey sampling campaign by defining your targeted population.
If you need to conduct surveys for a business, you should always aim your studies on your target market (when not observing your competitors). This is because the target market is the group of individuals most interested in your sector and most likely to buy from you.
In this regard, it is also important to conduct market segmentation of your target market, as your target market is made up of several consumer segments. Surveys are a powerful tool for segmenting your target market.
But again, you must properly sample your population before conducting any survey research. There are several ways to approach survey sampling.
Probability (Random) Sampling Vs. Non-Probability Sampling
There are various kinds of survey sampling methods, which fall under two main classifications: probability and non-probability sampling. Businesses, governments and other entities can apply either one or both of these methods for their research needs.
Before navigating the multitude of survey sampling methods, it is key to be able to differentiate the two main categories of sampling. This will put the subcategories, i.e., the specific sampling methods into sharper perspective.
The following explains the core aspects of the main types of sampling methods.

Probability Sampling:
Also called random sampling, this category initiates with a full sampling of all the individuals qualified to be in your sample. This main method grants all eligible participants the chance to be used in the sample. In this way, your sample will be able to allow you to make generalizations from your survey results.
The methods that fall under probability sampling can be more expensive and take up more time than their non-probability sampling counterparts.
The main advantage of using probability, or random sampling is that the chosen sample is more representative of the target population. As such, this kind of sampling fosters credible statistical conclusions.
There are five main types of probability sampling methods: simple random sampling, stratified sampling, cluster sampling, multistage sampling, and systematic random sampling.
- Simple Random Sampling: The most common form of probability sampling, random device sampling involves each member of the population receiving an equal chance of being selected in the sample pool. True to its name, the respondent is chosen by chance. This method reduces selection bias and allows you to calculate the sampling error.
- Stratified Sampling: This method involves dividing the population into subgroups. Known as strata, these groups are divided based on a shared characteristic. This method is used when there is reason to believe the variables will differ between each subgroup. Populations can be stratified by gender, age, location, interests, habits, etc. The study sample is acquired by taking either equal or unequal sample sizes from each stratum. This method enables all categories within the population to be represented in the sample.
- Cluster Sampling: This form of sampling assigns every member of the population to a single group called a cluster. Then, a sample of clusters is chosen, typically via simple random sampling. Contrary to stratified sampling, which includes elements from each stratum in the sample, cluster sampling uses a sample with elements only from the sampled clusters. As such, it is more exclusive. This method can be efficient when it comes to studying a wide geographical area, as it’s easier to contact many members of one area than a few members of various regions. The disadvantage includes an increased risk bias when chosen respondents are not representative of a population, which yields sampling errors.
- Multistage Sampling: This technique relies on selecting a sample by way of combining different sampling methods. As such, this method involves different stages, wherein Stage 1 may use random sampling, while Stage 2 may use stratified sampling. This method allows researchers to merge different styles of sampling, as a means to study various variables and draw conclusions through different focuses.
- Systematic Random Sampling: This method is used when a given population is logically homogenous. It involves enumerating all members of the given population on a list. When all members of the list are compiled, the researchers select the first sample element from the first several elements on the list at regular intervals. The advantage in using this method is its relative ease of use, in comparison to simple random sampling. Also, since simple random sampling may involve clusters, systematic random sampling offers a contrast: evenly sampling the population.
Non-Probability Sampling:
Also referred to as non-random sampling, this chief method does not start with a complete sampling pool, as some participants will not have a chance to be selected in the sample. Instead, it relies on the researcher's judgment.
As such, researchers can’t assess the effect of the sampling error. Additionally, there is a higher risk of using an unrepresentative sample, which harms the chances of reaping generalized results.
On the other hand, non-random sampling methods are less costly and are easier to conduct, making them conducive for exploratory research and formulating hypotheses.
There are four main types of non-probability sampling methods: convenience sampling, quota sampling, judgment (purposeful) sampling and snowball sampling.
-
- Convenience sampling: Known as the simpler non-random sampling method, convenience sampling selects respondents based on their own availability and willingness to participate in the sample. Although researchers can amass valuable information, this method carries a greater risk of volunteer bias, as those who wish to take part may be significantly different from those who don’t. Thus, the sample may not be representative of certain characteristics, such as habits, age or geographical location.
- Quota sampling: The most pertinent non-probability sampling method for market research, as respondents are chosen based on quotas. For example, a survey study may require 100 adult men, 100 adult women and 200 children. The quotas used would need to represent the characteristics of the studied population. The benefit in this method is the potential to be highly representative. However, respondents may not be representative of characteristics that were not considered, which is one of the general drawbacks in non-random sampling.
- Judgment Sampling: Also referred to as purposeful, selective or subjective sampling, this method involves exercising the researcher’s own judgment when choosing sample participants. Therefore, they may decide on a representative sample, one that exhibits certain characteristics. Oftentimes, media outlets use this method when surveying the public on qualitative research.
- Snowball sampling: This method is named based on the analogy its methodology puts into practice. Typically used in surveying groups that are difficult to reach, respondents are tasked with calling on more respondents (the ones they know) to take part in the sample. This is how the sample of an otherwise hard-to-recruit group increases, or snowballs, in size. This method is productive for bringing on individuals that can be difficult to study, but it risks selection bias, as is the case when choosing a large group of people with similar traits to the original respondent).

Survey Sampling Size, Bias & Other Considerations
When undertaking survey research, aside from understanding your target population and what kind of data to derive from them for your survey research, researchers need to decide on a sample size. This does not necessarily need to occur before deciding on the best survey sampling methods for an investigation.
Instead, it is apt to start with an approximate number of respondents in your sample, while identifying an exact size after you settled on a sampling method. This is because researchers may come upon factors that change the proper sample size for their studies. Additionally, facets such as budget and availability come into play.
Researchers also ought to note that both probability and non-probability sampling methods run the risk of developing a survey bias. These biases take place in various situations. These include omitting respondents from hard-to-recruit groups, straying from sampling rules, replacing already opted-in individuals with others, low response rates and others.
Another critical issue to consider is that your survey vehicle, the tool you will use to design and deploy your survey. A strong online survey platform can help you avoid biases and will offer a modern survey sampling method. One of the latest and most potent techniques is RDE (Random Device Engagement), which can reach a massive sample and incorporate several of the methods listed above.
Businesses and researchers in other industries should therefore consider using this survey sampling method.
[wp-faq-schema accordion=1]

How Surveys Help Reduce Customer Churn Rate
How Surveys Help Reduce Customer Churn Rate

The customer churn rate can be a disappointing metric that businesses must contend with — that is, it measures a negative behavior, but when the rate is low, it signifies a positive business attribute.
This is because churn rate quantifies an aspect of financial health by way of a customer behavior; a low churn rate is indicative of favorable customer relations. Companies should strive for a low churn rate as it helps pave the way for a strong financial standing.
On the contrary, a high customer churn rate is bad news; it points to poor consumer loyalty, which all brands should avoid like the plague. Implementing market research, particularly surveys can help reduce churn.
This article explains what the customer churn rate is and how surveys are a proven antidote.
Defining the Customer Churn Rate
This is a financial metric that measures customer churn, which is a behavior defined by customers who stopped using a business’s products or services within a certain time frame.
Also called customer attrition, this metric is especially relevant for businesses who offer subscriptions or contract-based services. In this case, the churn rate specifically refers to the number of subscribers who either cancel their subscription or don’t renew it.
Customer churn rate is expressed as a percentage, in which the percentage refers to churned customers within a given time period.
“Churn” also alludes to loss on a larger scale; this means it can describe losses beyond customers alone. Here are a few examples of matters that churn rate determines:
- The number of customers (the most common measurement)
- The value of lost recurring business
- The percentage of the loss of recurring value
How to Calculate the Customer Churn Rate

Calculating churn rate is fairly simple; all you need is to consider two variables: the number of customers you lost within a time period and the number of customers you started off with previously.
Divide the number of customers you lost, say, in the last quarter, as is the common variable, by the customers you started with in the last quarter. Move the decimal point twice to the right to get the percentage. This percent represents the churn rate.
Example:
Customers you lost last quarter: 50
Customers you started with at the beginning of last quarter: 900
50/900= 0.05555555
Churn rate = 5.55%
This standard calculation also represents the simplest kind, as there are 4 ways to calculate churn rate. You ought to consider which calculation is most needed for the unique situation of your business.
It’s important to note that the simple method of calculating churn does not take newly acquired customers into consideration. For example, say you gained 40 new customers during the last quarter — these are not part of the formula, therefore do not count towards your quarterly churn rate.
It’s also critical to remember that the time period used above is just an example; you can quantify customer churn on a monthly or yearly basis if you so choose.
Why Churn Rate is Significant to Consider

You should be regularly checking your churn rate as it helps you gauge your customer loyalty. Loyal customers are unlikely to churn, so the ones that do are significantly less loyal.
By understanding the disloyal customers, you can craft better experiences, messaging and even product innovations to ensure less churn and therefore greater customer retention. In today’s competitive digital landscape, customer retention is more important than customer retention.
Not only is acquisition more expensive, as it costs 5 times more to acquire a new customer than to keep an existing one, but it also yields less profitable results. Customer retention, on the other hand, increases profits up to 95%, after a mere 5% increase in retention, as one study found. Therefore, it is key to a successful business.
Additionally, retention is critical, as existing customers don’t require as much persuasive efforts to stay with a business (they’re already doing so). They are also willing to spend more — up to 31% more, as well as being more inclined to try new products.
The lower your churn rate is, the greater your customer retention is for a particular time. As such, it is in the best interest of any business to keep churn rates low, so they must be carefully observed.
As far as customer retention is concerned, churn rate is also useful to study in comparison with Customer Lifetime Value (CLV), which measures a customer’s entire worth to a business during their lifetime relationship with one.
All in all, the churn rate helps you keep track of your lost customers. In order to keep this rate to a minimum, you must at the very least calculate it.
Customer Care: the Most Potent Way to Minimize Churn
Your product or service may be useful and necessary to your target market, but if you are disconnected from your customers, many of them are bound to churn. The strongest method to avoid churn or reduce it significantly is to provide the best care for your customer.
Caring for your customers involves a number of different actions, as it is not bound solely by friendly customer relations, as its name may suggest. Here are several ways to care for your customer to minimize churn rates:
- Offer multiple methods of communication, to ensure your customers that they are being listened to and heard. This will also allow you to understand what they seek and what they loathe.
- Create incentives; these help your company stand out among competitors and grant your customers more value.
- Formulate a loyalty program; this incites multiple purchases, fostering retention and relationship-building with your customers.
- Implement a strong VoC (voice of the customer) program for customers to be able to express their grievances and desires.
- Practice social listening, the process of overseeing social media networks for mentions of your company and competitors. This will give you a firsthand glimpse into how your customers feel about you in relation to other businesses in your niche.
- Personalize the customer experience, whether online or in-store, personalization shows customers that they’re not just another number making a purchase, but they are individuals you are being thoughtfully catered to.
- Reach out to customers yourself. Don’t wait for them to come to, as most often won’t unless they have a question or concern. Up your marketing ante via emails, social media and calls (especially if you provided free samples for the last method). This also shows customers that they are being heard and more personally served.
Survey Research: Providing a Breeding Ground for Better Customer Relations
Surveys help you achieve all of the techniques aforementioned in the prior section. This is because in order to coax your customers into loyalty and out of churning, you need to be able to understand them.
While plenty of software programs make promises of improving customer satisfaction and thereby relationships, surveys are the only alternative to get specific answers to both your own questions and those of your customers.
Surveys have the power to capture more than merely your customers’ needs. These vehicles allow you to gain direct insight into your customers’ minds on virtually anything: opinions on current affairs, aversions, desires, small irritation factors, shopping preferences, etc.
The better you understand your customers, the better you will serve them, whether it is through your marketing, branding, or product upgrade endeavors.
With mail-in surveys becoming obsolete, an online survey platform is the most optimal method for conducting your survey research.
Surveys help stamp out churn rate as they can be hyper-focused on one aspect of the customer experience. For example, you can create a survey to collect feedback on a recent order, an interaction with a salesperson or a chat representative, or you can gather opinions on current product updates, product glitches, ads and virtually anything else you can think of to avoid customer churn.
The latter is especially useful if the survey platform you use allows you to insert visual elements (images, GIFs, etc) to your questionnaires.
Surveys may appear to provide little depth as most have to be kept short to avoid survey attrition. However, you can design surveys with open-ended questions for a qualitative approach to your surveys. These allow customers to provide invaluable insights on why they churned or are thinking about doing so.
Prioritizing the Correct Actions to Reduce Churn Rate
Once you’ve gathered and analyzed data from your survey research, you’ll be able to understand what causes your unique customer churn rate. This will equip you with the knowledge to move forward with meaningful changes.
You should prioritize on the strongest influences to your churn rate and create a plan of action to reduce them. Survey research can point to problems you’ve never thought were present.
For example, perhaps your product or offering is perfectly fine and even desirable among your customer base. Instead, your customers churn due to poor customer support. This should prompt your business to adopt more training within this particular department.
Or, perhaps your product has no malfunctions; rather your customers want it to do something beyond its capabilities. It is possible that your competitors are already on to this and have adapted their product to this customer desire. Thus, it is easy to see why your customers churned. What’s most important is that with this insight in tow, you can inform your product team and prioritize on innovating.
This will lessen your churn rate in turn. When your churn rate is in decline, it translates to added revenue. Surveys can detect frustration with specificity, allowing you to avoid issues that contribute to customer churn.
[wp-faq-schema accordion=1]

How Polling Software Disproves that Polls Don't Work
How Polling Software Disproves that Polls Don't Work

Polling has a bad reputation, but polling software, when used correctly, proves that polls are predominantly accurate.
In order to receive responses that truthfully reflect the views of a certain population, there are a few things to keep in mind on the nature of polls and survey research. When you take these matters into consideration and couple them with robust polling software, you will be poised to glean useful data that you can use to power any market research campaign.
This article will cover polling software, including instances of it having made accurate predictions, along with the key aspects to keep in mind to reap the most out of your polling efforts.
How the Right Polling Software Predicted the 2016 Presidential Election
The Pollfish polling software was able to predict Trump’s lead in several key swing states back in 2016. While most national and state polls projected Hillary Clinton to win the presidency, Pollfish was able to forecast Trump’s victory in several key states.
The platform discovered Trump’s favorability in purple states including Florida, North Carolina, Pennsylvania and Ohio. It also reported Trump winning in blue states such as Wisconsin and New Hampshire, which ran counter to many state polls. These findings painted a far more accurate picture of the direction of the 2016 presidential election.
This is due in part to the sentiment we studied using the Pollfish platform, which included measuring attitudes around each candidate’s stance on key issues. The platform showed that many of the states with Trump’s victory held his opinions on salient topics, like immigration.
This polling software was also able to hyper-localize opinions, by amassing respondents based on their US census region, city and zip code. These capabilities, along with calculating the margin of error allowed Pollfish to extract data that was closely aligned with the 2016 presidential election.
Avoiding Inaccurate Data: The Sampling Error & the Margin of Error
Regardless of the polling software you use, by their very nature, polls do not reflect the views of everyone in your target market or subject of interest. The reason is self-evident; it is impossible to survey everyone who fits within your targeted population.
Even those who would not object to participating in a poll may not happen upon one, whether it is over the phone or online. This is especially true in random sampling, in which respondents partake in a poll by chance. As such, polling is subject to several errors.
The most common error found in polling is known as the sampling error, which comes about from using a sample of a population instead of its entirety. The sampling error itself is unknown; it relies on the margin of error for a calculation.
The margin of error is an estimate of how much of the results of the sample may deviate from chance as compared with what the results would be like if the whole population was polled. It shows the maximum possible size of the sampling error.
In doing so, researchers can understand the range of data, rather than one number for a truer read. For example, if polling finds that 35% of people use their phones to listen to music and the margin of error is at 5%, the statistic is then expressed as 30 to 40%.
Accurate polling requires using the correct methodology. This involves calculating the margin of error to gather more precise findings. Being able to calculate the margin of error helps researchers pinpoint the degree of variability to expect around responses. This will help gain more accurate insights — the kinds that make accurate predictions.
Avoiding Polling Biases

Regardless of how researchers choose to conduct polling, biases exist inadvertently. In order to disprove the myth that polling doesn’t work, you ought to understand the various biases that you are sure to encounter in the polling process.
Avoiding these biases will help refine your polling efforts. Most importantly, using the proper polling software will help you avoid these biases by way of its capabilities. Here are the most common biases to avoid and how an online polling tool can help you circumvent them.
Sampling Bias
Also called the sampling error, as aforementioned, sampling bias arises when only specific portions of a population take part in a poll. Sometimes, leaving out certain segments, or only polling one is intentional, as it may be part of a targeted effort towards one segment of a target market.
But when it’s not, it creates polling results that don’t accurately reflect all the views of the segments that make up a population.
To stamp out sampling bias: use polling software that allows you to zero in on your audience, with multiple subcategories. Make sure the software allows you to add quotas on each subcategory; that way you won’t miss the respondents who belong to this category. If you want to study a wide group of people, opt for a tool that allows you to incorporate multiple audiences.
Non-Response Bias
This bias refers to the inadequate responses or a low response rate from the respondents who you’re targeting. This can include customers who have made purchases from a long time ago or those who simply do not wish to take part in polling research.
To stamp out non-response bias: Make sure the timing of the survey is not too far away from an interaction with your brand, such as a chat, a call with a customer service agent or a digital experience. You can also send it through various ways of distribution such as via a web page, social media or email.
The proper polling survey can remedy this without trouble. This is because this kind of software (the right kind, that is) should be equipped with a response-generating capability. This will ensure that not only is your poll sent out but that it doesn’t stop making the rounds online, until it receives the preset amount of responses.
Often, the software achieves this with quotas and an option for the total number of completes.
Survivorship Bias
This type of bias emerges when your polling is only completed by retained customers, clients and longstanding employees. This kind of bias is present specifically within a business survey. It gravely limits your results to people who generally have a favorable opinion of your business. Their opinions are going to differ in a number of other ways from customers who churned or bounced.
To stamp out non-response bias: software can wipe out this bias with the use of screening questions. These allow researchers to ask for specific questions, as they would in the questionnaire portion of a survey; however, the answers to these questions qualify or prevent a respondent from taking part in a poll.
A potent online polling tool will include several screening questions so that you can diversify your survey respondents.
Acquiescence Bias

This bias occurs when respondents repeatedly and consistently answer with positive responses or connotations. This can arise due to boredom, so rather than entirely reading a question and thinking about it, respondents just answer with “yes” by default. This can also come about out of politeness or fear of retribution in non-anonymized surveys.
To stamp out acquiescence bias: Keep surveys relatively short and ensure your questions and answers are
The best way to minimize the chance of acquiescence bias is to use thought-out questions and answers. You should avoid yes or no questions for this purpose as well.
Polling software is your best bet to clamp down on this bias, as it allows you to create scaled questions. This gives respondents a diverse set of answers, so they won’t feel that the answer they have in mind simply isn't there and then resort to the positive or “yes” answer. A strong polling tool will allow you to create a wide variety of scaled and ratings surveys such as the NPS, CSAT, CET and other such surveys.
Testing Your Marketing, Market Research and Other Business-Related Campaigns
Polls have a bad rep, especially those of the political variety. However, a well-built polling software can overcome any challenge present in market research, which includes gathering responses that are accurate to a specific population.
Aside from making predictions, polling software is also useful for many other market research needs, such as testing the images and messaging of an advertising campaign that’s underway, or seeing if new product releases have been useful for your customer base.
At any rate, it is crucial to pay heed to the features of the software you seek to use. These should empower your research and help you avoid skewed results and other pitfalls.
You should also bear in mind the various biases that exist within polling and keep track of the margin of error of any poll. When you couple these practices with robust polling software, you will be on the right track towards obtaining bias-free information that accurately reflects the thoughts of your subjects.
[wp-faq-schema accordion=1]