
3 Summer 2022 Consumer Trends 🌊 ☀️

It’s not all palm trees 🌴and Mai Tai’s 🍹this summer.
Your July/August vacation costs quite a bit more this time around.
But what does that mean for your brand in a completely different category?
We surveyed 500 representative U.S. consumers in July 2022 to find out. We wanted to extract the most current data on broad shopping habits, changing preferences, and financial fears.
Our key findings are below and the full survey is here.
72% of customers may defect to cheaper alternatives in 2022/2023.
Yes, you already know your customers are losing purchasing power, but have you considered very specifically what’s next?
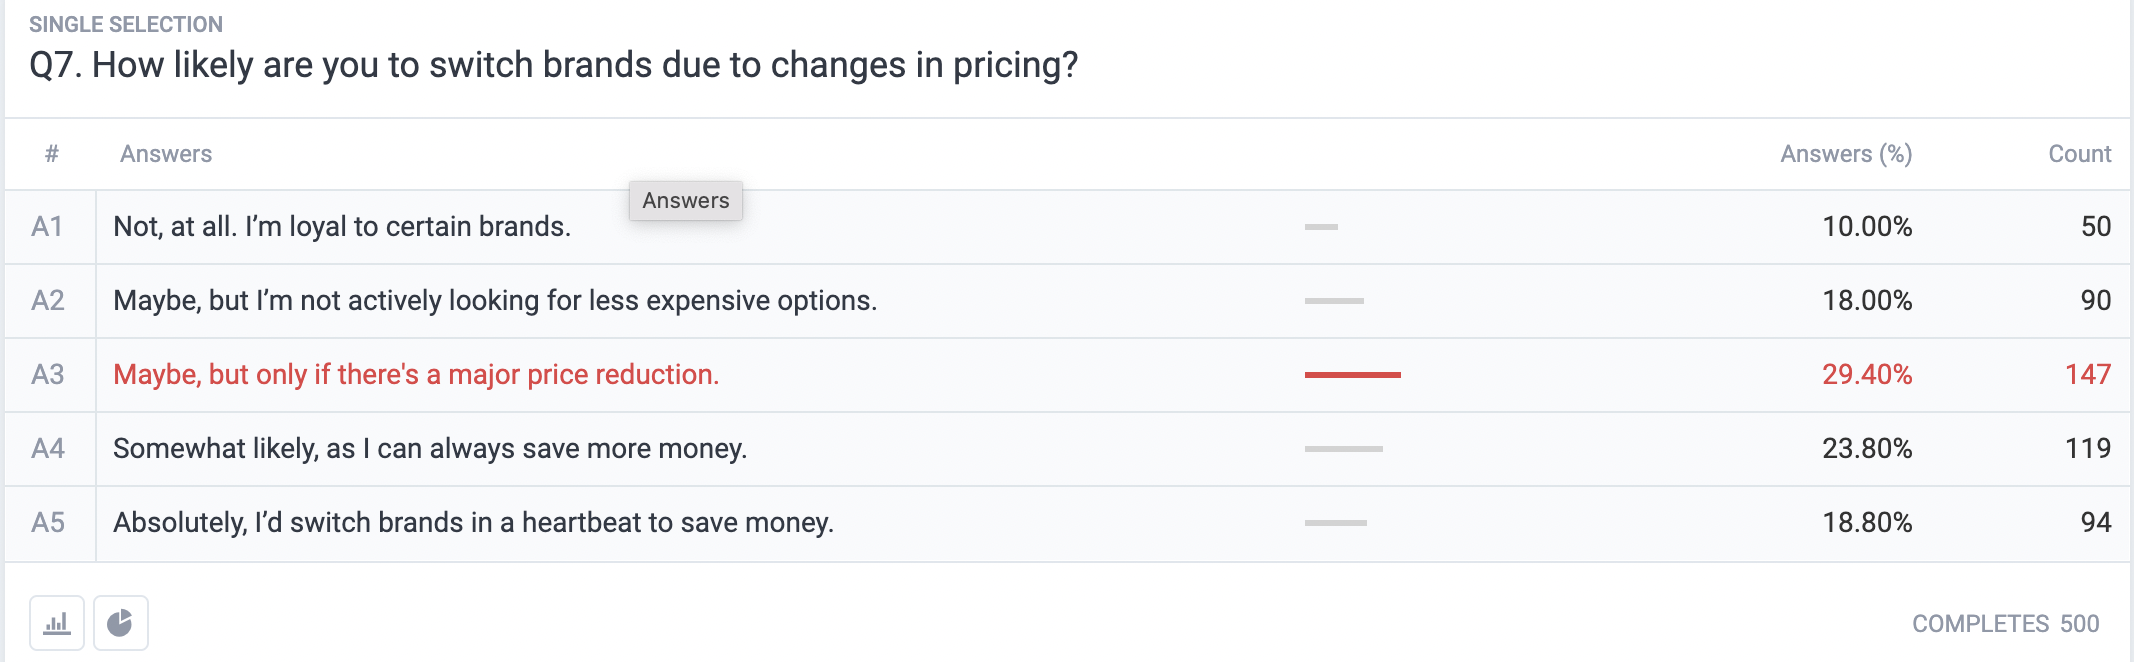 With costs trending up in most categories markets, some % of your customers must reduce/cut spend in your category or switch to cheaper brand alternatives.
Even if your specific market isn’t impacted, your customer is (from other areas of expense), and they will still need to make tough decisions that could seriously impact your bottom line.
So, what can you do? Here’s a few key action items to consider:
- Launch a lower-cost alternative within your product line.
- Shift messaging to emphasize your product value in relation to the cost.
27% of consumers currently have NO brand loyalty.
Brand loyalty is commonly measured at a granular level, regarding specific brands, or specific niches and categories.
We decided to ask about brand loyalty at a broad level. 27% self-reported that they are basically brand-agnostic. Undoubtedly, if the financial landscape worsens, these will be your first consumers brand hopping.
On the flip side, 32% said that they’d still continue buying from a certain brand if they feel that they cannot live without their product(s). As such, we can infer that brand loyalty proves to be strong when a brand offers a quality product.
42.6% are spending less, but 38.6% are spending more.
Things aren’t as cut and dry as they seem…
As inflation continues, the common assumption is that we’re all spending more because of the increase in costs everywhere, or we’re all spending less, fearing the recession.
With only 30% saying they have more needs expenses this year, it’s a mixed bag…
Looking at the data, you’ll see 22.2% spent significantly less and 20.4% spend a little less.
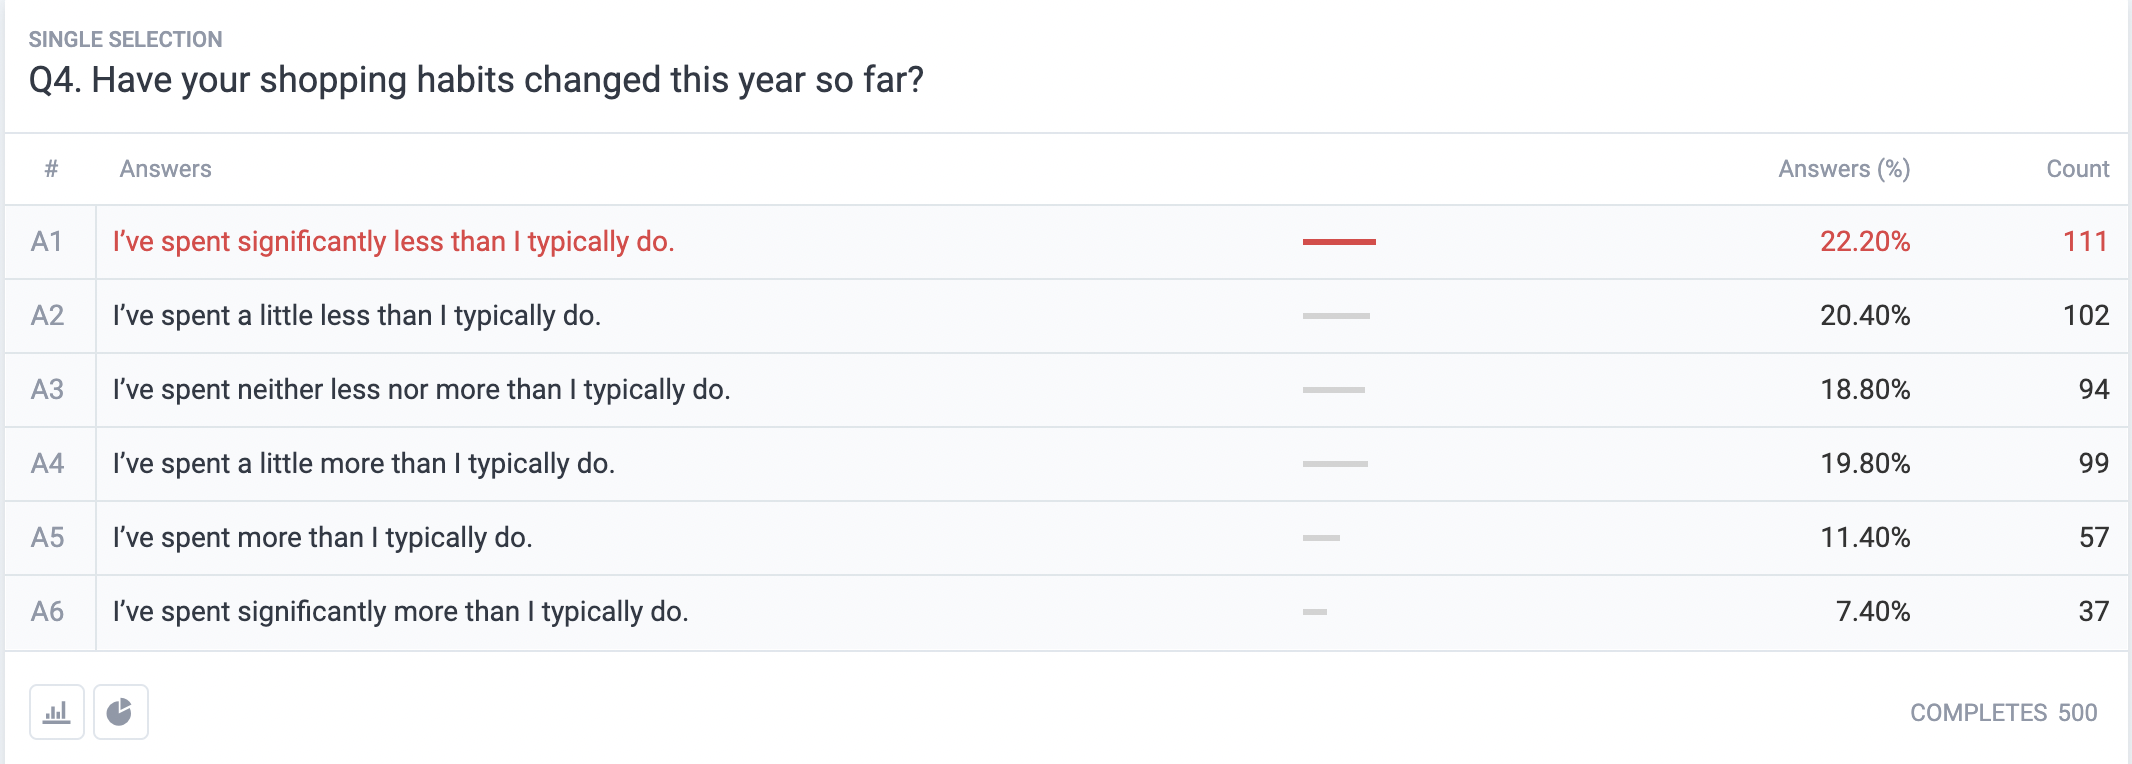
Why? Is it the recession, record inflation rate, or a lingering effect of the Covid-19 pandemic? Is this survey question simply too vague to yield a solid directional answer from gen pop?
Maybe our question wasn’t ideally designed, or maybe it’s just too early in the recession to tell, considering that 18.8% spent the same, and 38.6% actually spent more.
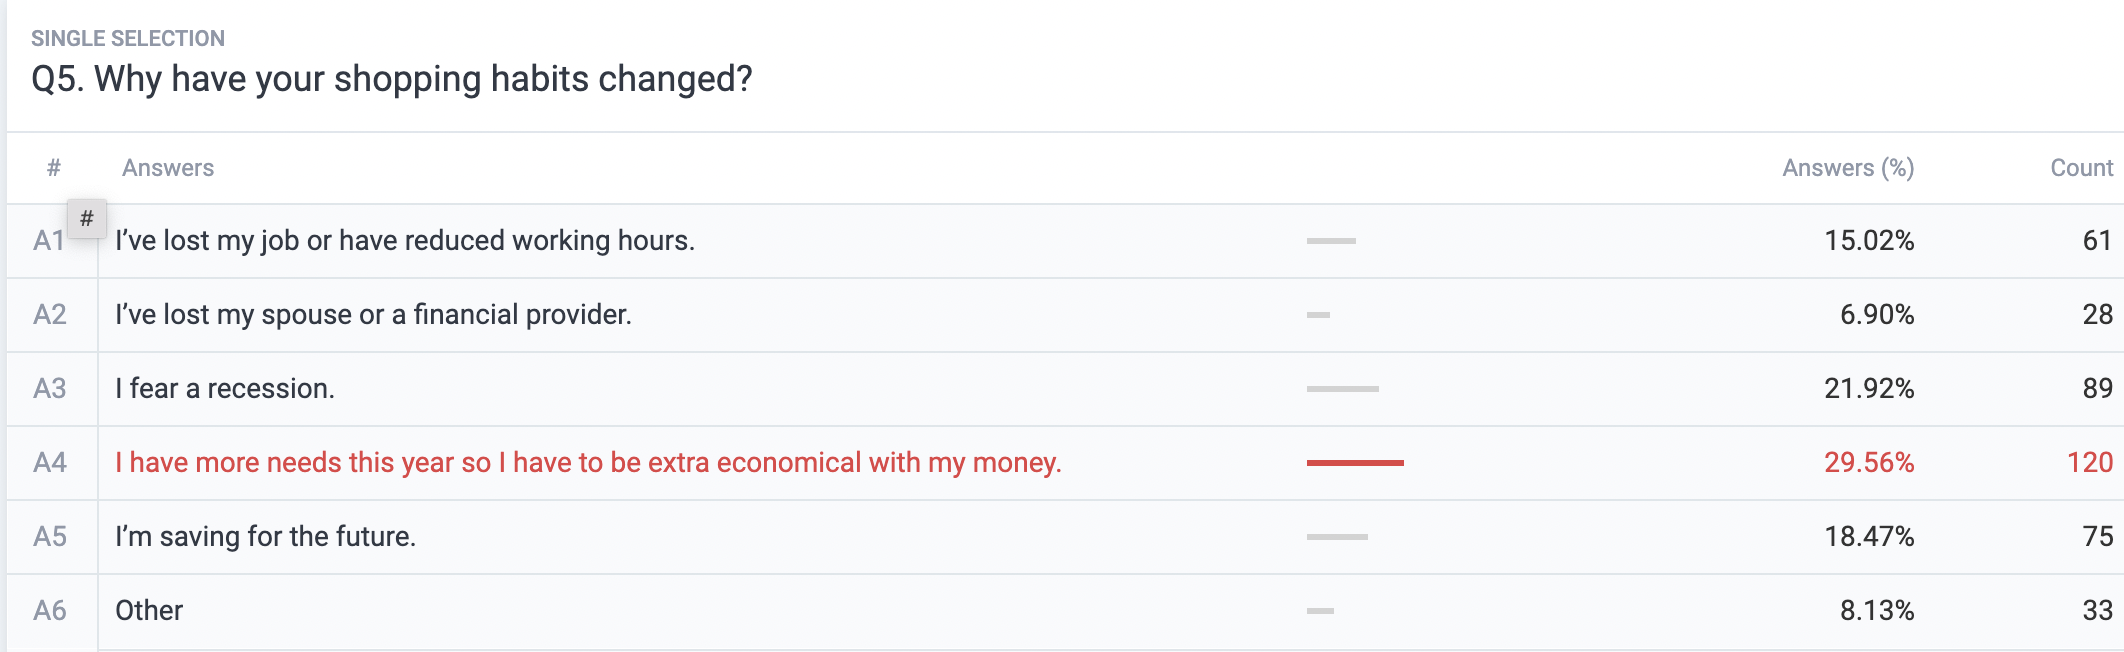
Here’s why customers’ shopping habits have changed, per the image from our survey question:
Get $1 survey insights from 250,000,000+ respondents.
Ready to give Pollfish a try?
Our online survey platform is user-friendly and offers 24/7 live tech support. It is incredibly easy to use, as you can make your own survey in three easy steps.
As a DIY survey platform, you are in full control of your survey campaign — from targeting, to deployment method, to the questionnaire and how your post-survey data is presented.
Leveraging organic sampling and Random Device Engagement, the Pollfish platform provides random organic sampling to users across the globe in their natural online environments, staving off survey bias and providing the highest quality of survey data.