
7 Best Alchemer Alternatives & Competitors in 2026
7 Best Alchemer Alternatives & Competitors in 2026

Alchemer is a popular online survey software with positive reviews on websites like G2. However, some users have reported issues, such as:
🚫 High cost
“The cost of this software has increased fundamentally over the years since the acquisition of fluid surveys.”
– Read the full review here
“There are a few more advanced features that we only need once in a blue moon and we are loath to pay for higher subscriptions just to access those features so infrequently.”
– Read the full review here
🚫 Long customer support response times
“Their support email takes a lot of time to respond. At times there are requests that need to be dealt with ASAP because you are in the middle of a project but that’s where I feel the pain.”
– Read the full review here
“Customer support is not consistent. Sometimes they reply [to] my tickets in a prompt manner but sometimes it takes weeks to get an answer.”
– Read the full review here
🚫 Limited questionnaire design capabilities
“I wish there were options for more nuanced logic.”
– Read the full review here
“You have to know how to program in JavaScript to solve things that are simple, like setting up a control variable for skipping a question.”
–Read the full review here
“If you're looking for any type of advanced question types, their programming team has to get involved (unless you're excellent in writing your own code) and it always takes an extended period of time to get their help (i.e., their own team was the bottleneck to me actually getting my surveys out in real time).”
– Read the full review here
🚫 Insufficient data analysis and reporting
“On the backend, the default/out of box reporting leaves a lot to desire.”
– Read the full review here"Reporting looks a bit outdated and could use some more advanced graph templates.”
– Read the full review here
“I dislike the way Alchemer Survey exports data for specific table questions or ranking questions.”
– Read the full review here
Based on these common customer challenges and our experience helping companies transition from Alchemer to our survey platform, we’ve put together this comprehensive list of Alchemer alternatives. We’ll start with Pollfish, our solution, before diving into other options.
Best Alchemer Alternatives
1. Pollfish
Pollfish, our DIY survey tool, is a popular alternative to Alchemer for several reasons. We'll briefly outline each reason below, and then dive deeper into each one.
✅ Rigorous audience quality control for high-quality, reliable data
To ensure the integrity of survey results, we use multiple layers of quality control that address common quality issues seen with several other survey tools.
For example, with Pollfish, every new panelist goes through a 14-day evaluation period, during which they fill out internal surveys. Only panelists who successfully pass this evaluation are then permitted to participate in paid client surveys. We also apply numerous additional safeguards, which we’ll discuss in more detail later on in this section.
✅ Transparent, pay-per-response pricing with unlimited seats
Pollfish keeps pricing simple with a flat per-response rate that starts at $0.95, with discounts for large volumes. As you build your survey, Pollfish updates your total cost in real time so you always know what you’ll pay.
We don’t add subscription fees, hidden costs, or extra charges for more users, so you can easily plan your research budget.
✅ Built-in advanced data analytics and reporting
With Pollfish, you can segment data across multiple variables and generate custom-branded charts and graphs right inside the platform. There’s no need to export results into spreadsheets or external tools, which saves you hours of manual work and streamlines your analysis process.
✅ Advanced questionnaire design capabilities
Designing a survey through Pollfish is intuitive, easy, and requires no programming skills, even with complex surveys. We offer a number of advanced questionnaire design capabilities, including 16 question types (e.g., A/B test, conjoint analysis), conditional branching logic, answer and question shuffling, AI survey creation, survey templates, and more.
✅ Complimentary, responsive customer support from seasoned market researchers
Pollfish offers complimentary, on-demand customer support from market research experts available 24/7 via phone and live chat at no additional cost. Whether you’re new to survey creation or just seeking a second opinion, you can get help anytime you need it with survey design, audience targeting, data analysis, reporting, and more.
Let’s explore each of these benefits in more depth.
Note: Sign up for a free Pollfish account, no credit card required. We also invite you to inquire about our full-service market research services through our parent company Prodege, which manages the complete survey process for you from beginning to end.
Rigorous Audience Quality Control for High-Quality, Reliable Data
We pride ourselves on leading the industry in commitment to high data quality. Even a meticulously designed survey can generate flawed data if the respondents are bots or real people providing rushed, low-quality responses. That’s why we’ve put extensive time and resources into building strong data quality safeguards.
Our recent article explores the most common data quality challenges and the specific solutions Pollfish (through parent company Prodege) has developed to address them.
Let’s take a look at some of our quality control measures:
❇️ Verifying respondent identities through diverse activities beyond surveys
Most audience panels only pay members for filling out surveys, which makes it easy for fraudsters and fatigued respondents (who rush through surveys) to slip through. Through our parent company Prodege, we take a different approach.
We reward audience members not just for completing surveys, but also for activities like playing games, shopping online, uploading shopping receipts, and more. These extra data points give us valuable ways to confirm that respondents are real people, helping us build more comprehensive, accurate profiles.
We also don’t urge our panelists to complete surveys. This helps avoid survey fatigue, preventing low-quality responses.
❇️ 14-day evaluation period
New panelists don’t immediately become eligible to participate in client surveys. During their first 14 days, they complete a series of internal quality checks. Only those who consistently provide thoughtful, reliable answers move forward. This extra layer of screening sets Pollfish apart from providers that accept most sign-ups without meaningful testing.
❇️ Trust scores for higher response quality
We assign each panelist a trust score powered by AI and machine learning. This score updates continuously based on ongoing inputs. Depending on the trust score, we may block respondents from surveys, require identity verification, or deactivate their account entirely. This system incentivizes members to provide thoughtful, high-quality answers every time.
❇️ Fraud detection technologies
Pollfish uses multiple defenses to stop fraudulent participants, including:
- Multi-level registration verification (e.g., CAPTCHA, Device ID Reputation, 100% Double Opt-In, etc.)
- Tech consistency (carrier/targeting alignment check)
- Single user IDs (no duplicate survey takers)
- Sophisticated anti-VPN measures
And more.
❇️ Behavioral data validation
We don’t rely only on self-reported demographics. Pollfish cross-checks participant profiles against real behavioral data, such as purchase receipts. For example, if a respondent claims they don’t own a cat but regularly uploads receipts for cat-related products, our system may flag the mismatch and prompt a profile update. This approach keeps demographic data current and accurate throughout a panelist’s lifecycle.
❇️ Preventing rushed, low-quality, or contradictory answers
Even real people can give low-quality survey answers if they speed through the survey without paying attention. To address this, we apply:
- Speeding detection: Flags respondents who complete surveys unrealistically fast, indicating low attention.
- Straight-lining detection: Identifies respondents who repeatedly choose the same answer across multiple questions without consideration.
- Manual review of open-ended responses: Ensures written answers are relevant, detailed, and not nonsensical or low-effort.
- Red herring questions: Ensures that participants are paying careful attention throughout the survey.
Further reading: 3 Survey Data Quality Issues Sabotaging Your Research (& How We Fix Them)
Transparent, Pay-per-Response Pricing with Unlimited Seats

Pollfish uses a pay-per-response model built to keep costs low and put you in full control of your research budget:
❇️ No long-term contracts or minimum spend
Pollfish lets you run surveys as rarely or often as you need. You won’t be charged beyond your usage or get locked into long-term contracts.
❇️ Add unlimited seats for free
Your entire team can access Pollfish to create surveys, view results, and generate reports, all under a single account at no additional cost per user. You won’t be charged individual license fees or have any seat restrictions. If you plan to have multiple teams using Pollfish, you can also effortlessly switch between them in just a few clicks.
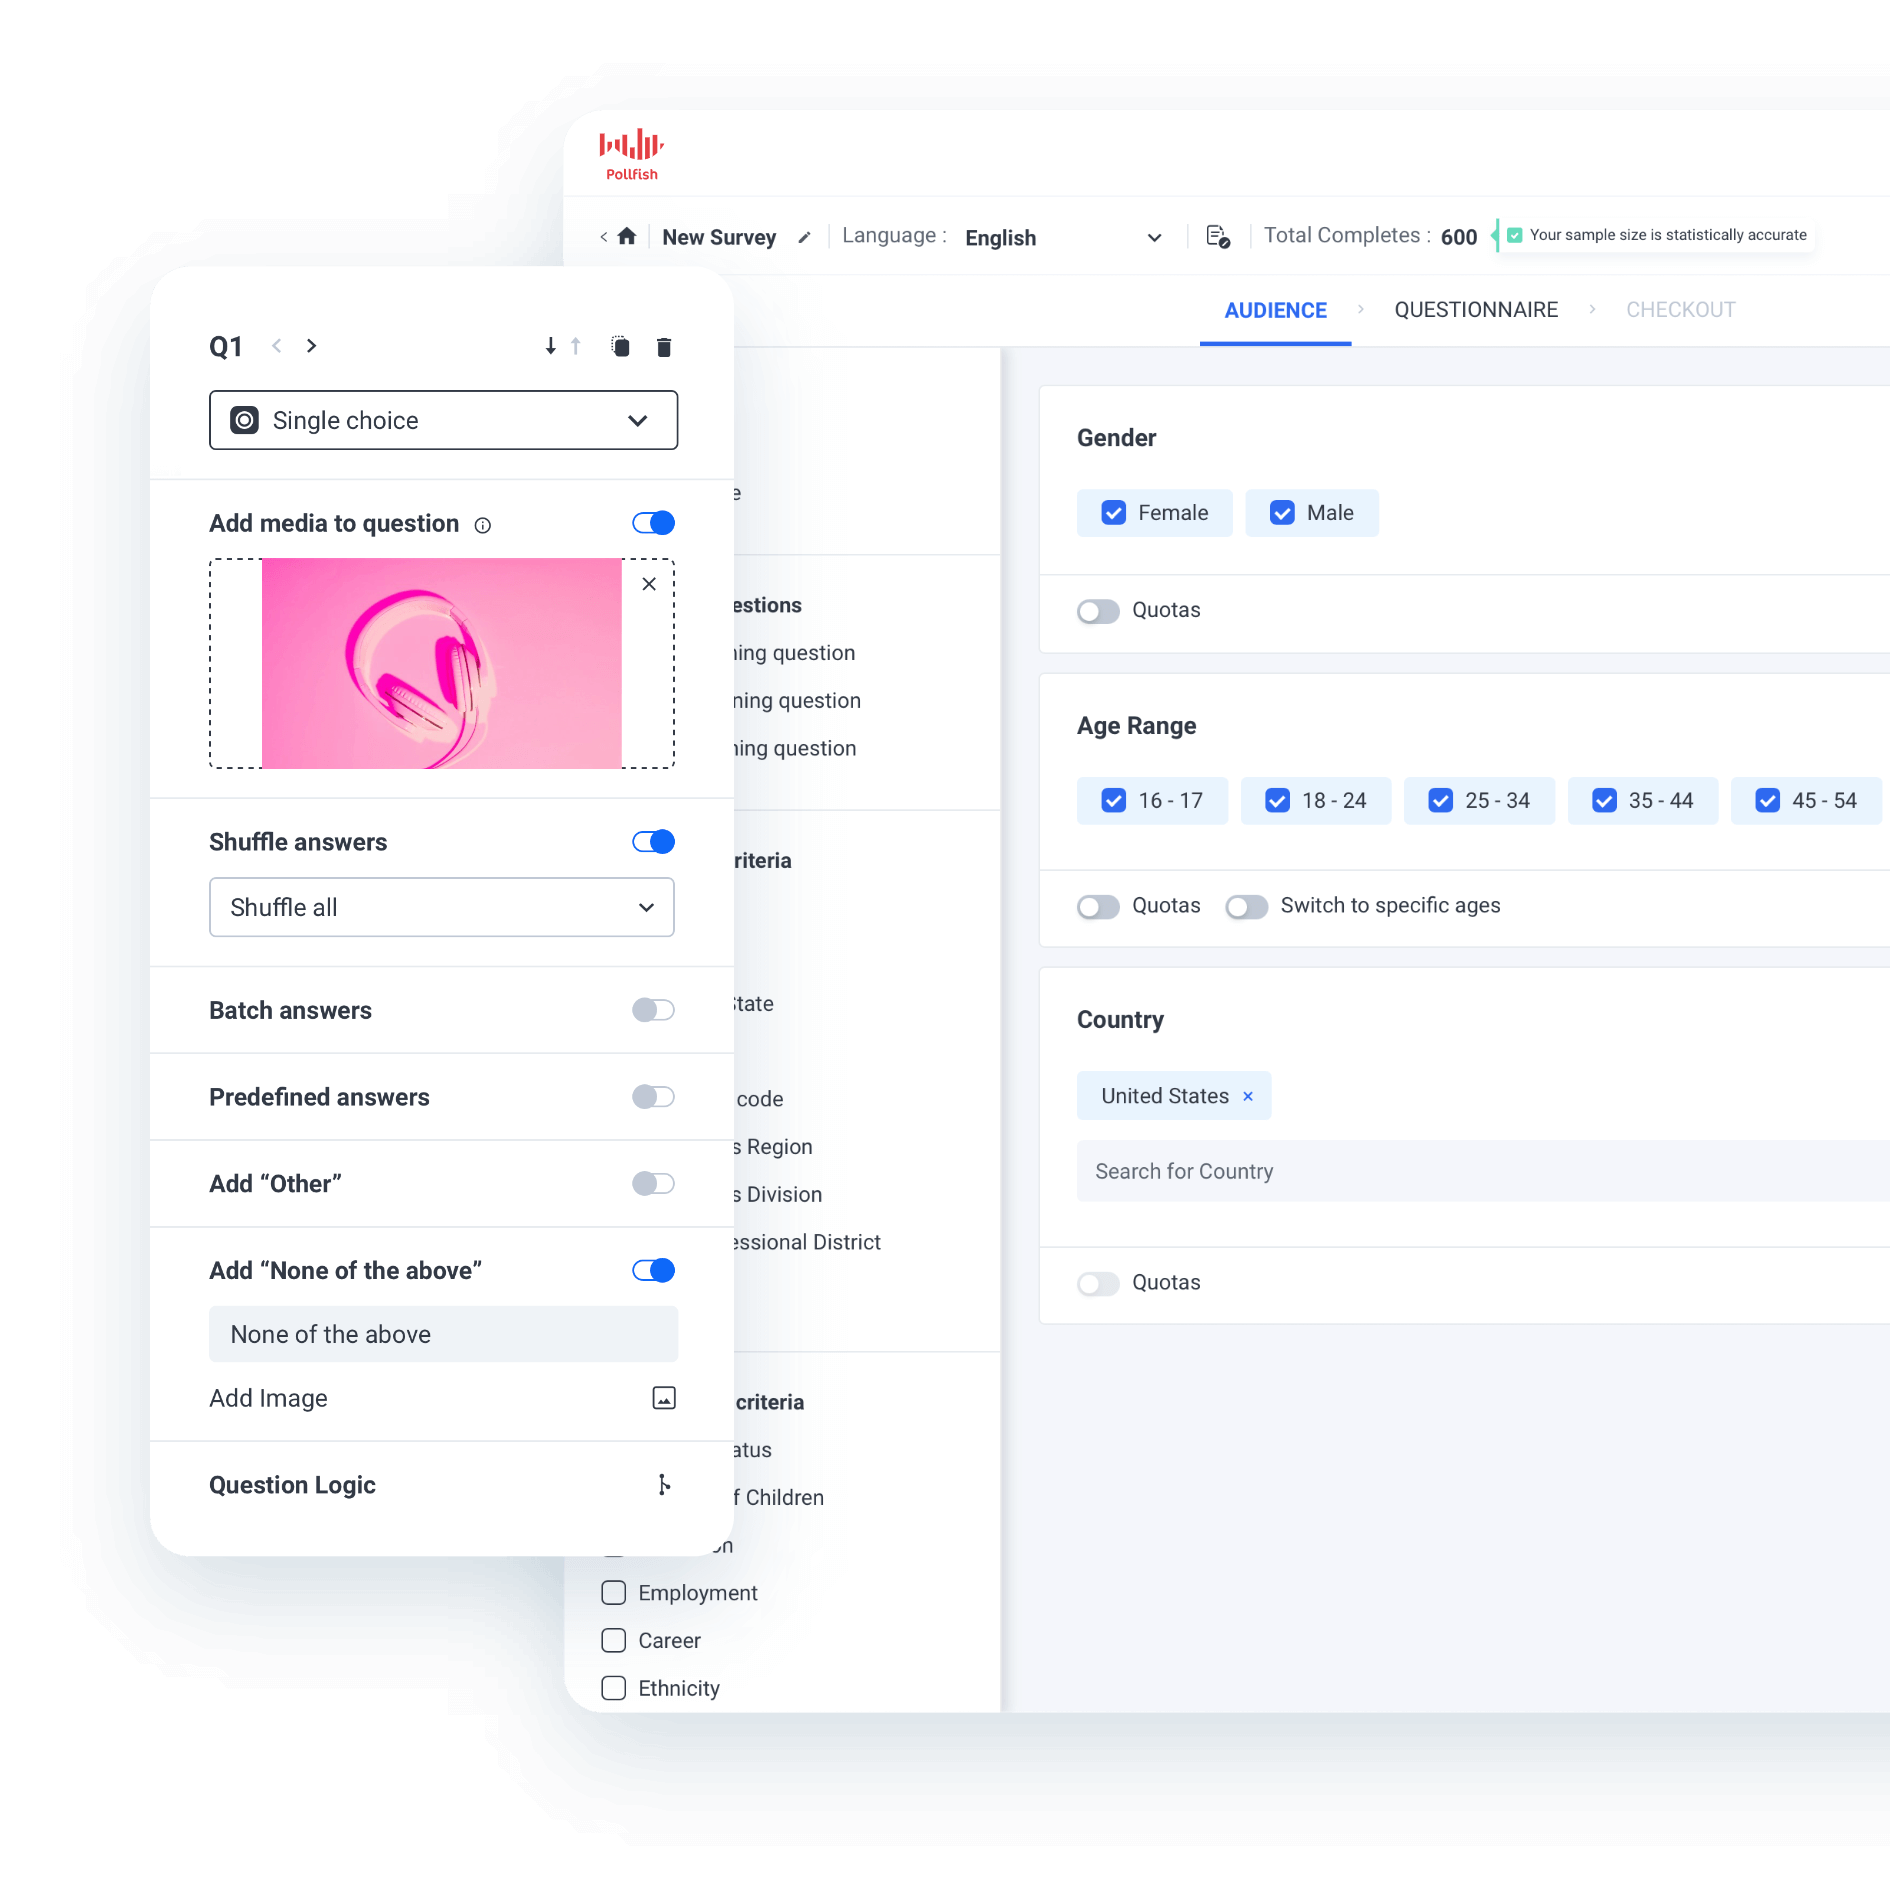
❇️ See your total cost update in real time as you build your survey
Pollfish lets you see the full price of your survey upfront with no hidden fees or additional charges.
As you see in the image above, let’s say you start with a base cost of $0.95 per response. You might choose to add two additional audience filters, such as:
- US household income between $75,000–$99,999
- Minimum 1 pet in household
Each of these filters would cost you $0.55, for a total cost per response of $2.05 ($0.95 base + $0.55 + $0.55). For 600 responses, your total cost would be displayed upfront as $1,230 before you confirm your purchase.
What you see is what you pay.
Advanced Built-In Data Analysis Tools and Reporting
 Pollfish lets you drill down into survey data, focus on specific subgroups, and build polished, on-brand charts all in one easy-to-use platform. You won’t need to export results to Excel or other external tools to get the analysis you need (but you can if you need to).
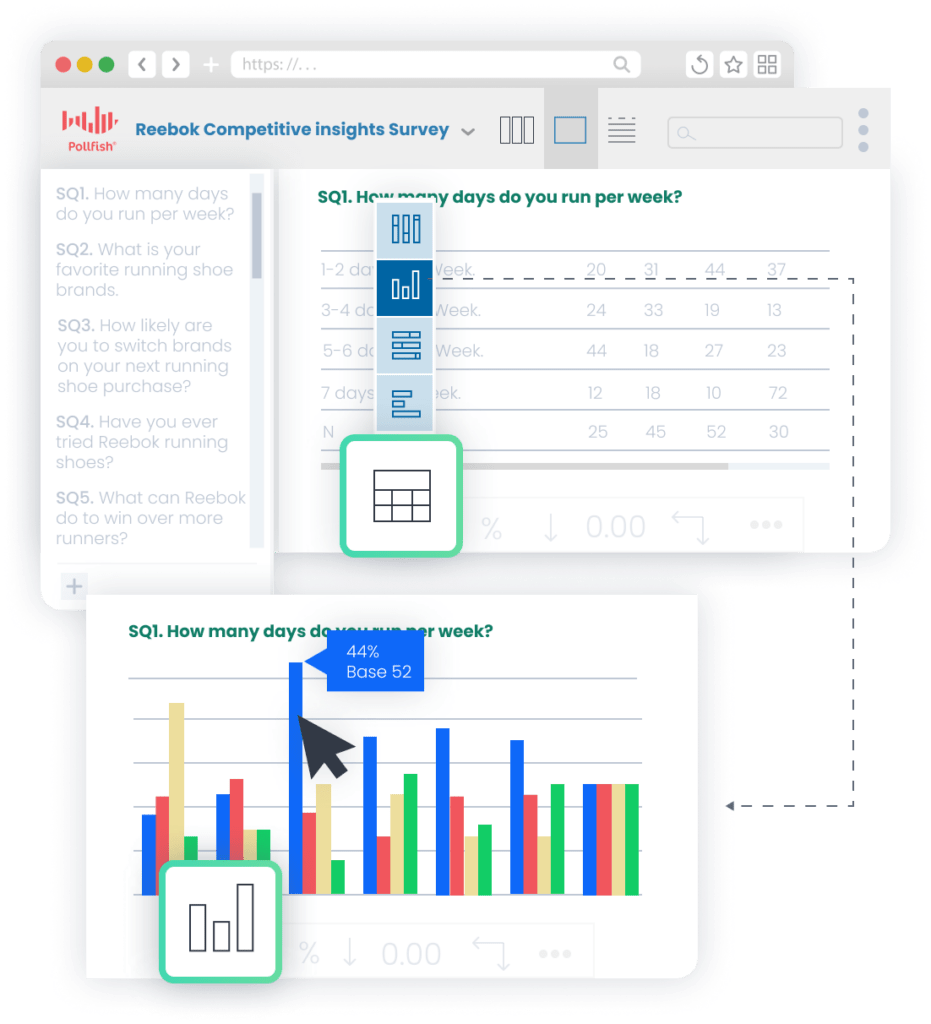
❇️ Automatic chart creation
Pollfish intelligently generates the most appropriate chart types for each survey answer, whether it’s a bar graph, pie chart, table, or something else. This presents your data in a clear, easy-to-understand format and saves you significant time manually creating visualizations.
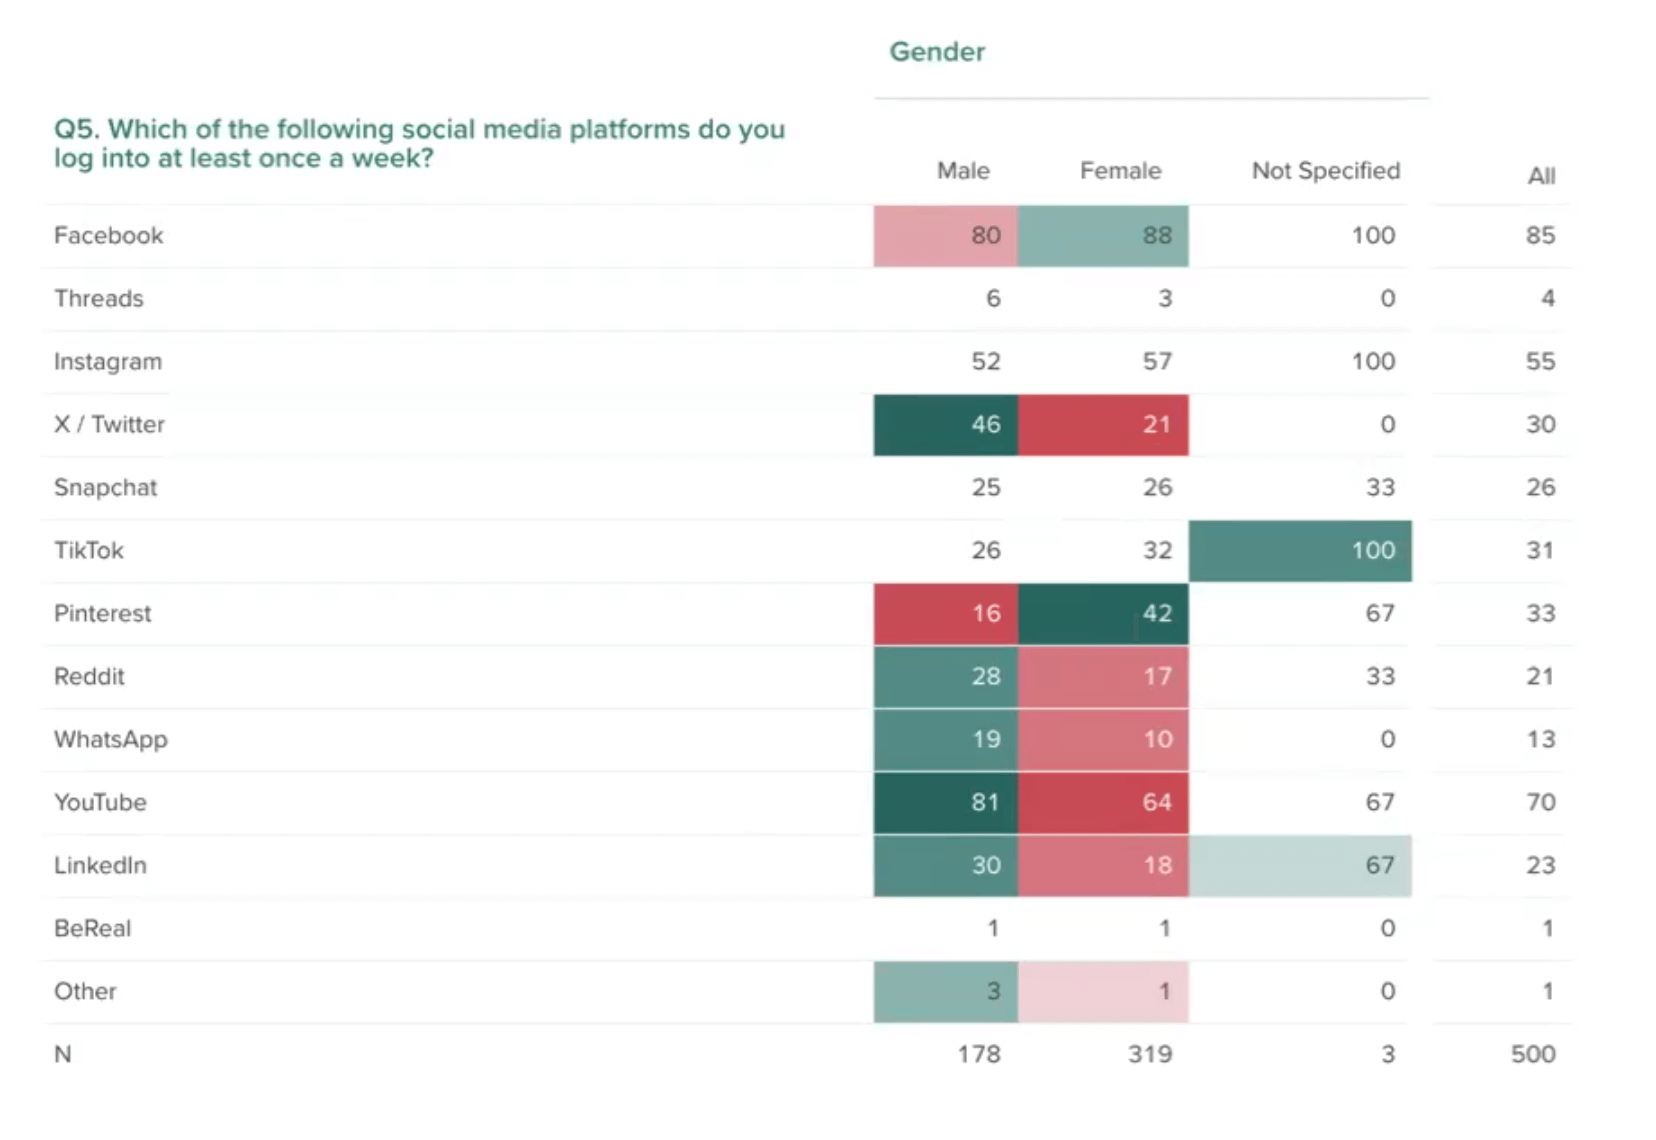
❇️ Targeted insights through filtering
Pollfish lets you drill down into your results by filtering responses and audience attributes to uncover deeper insights. For example:
- Filter by survey responses: Zero in on participants who selected a specific answer, like customers who said they wouldn’t recommend a product, to understand their pain points better.
- Filter by audience segments: Narrow your view to a defined group, such as parents of young children, while excluding others, to spot patterns unique to that demographic.
❇️ Multi-variable analysis and visualization
Pollfish’s Insights Builder (available for large-scale research needs and full-service projects) makes it simple to generate compelling multi-variable visualizations directly in the platform, no external tools required.
For instance, imagine you’re evaluating interest in a new fitness app. You could easily create a multi-variable chart showing intent to purchase a subscription (variable 1), broken down by:
- Fitness frequency (variable 2)
- Age group (variable 3)
- Device type, such as iOS or Android (variable 4)
In just a few clicks, Pollfish could create this chart, complete with optional stat testing to highlight meaningful differences and custom colors to match your brand’s theme.
❇️ Statistical significance testing
Pollfish makes statistical testing outcomes easy to interpret, clearly highlighting differences with color coding and letter-based notation.
❇️ Built-in presentation builder
You can create PowerPoint-style presentation slides directly within Pollfish, even before your survey is finished collecting responses. This way, you’ll have a nearly finalized report ready by the time your survey is done, giving you a valuable head start in presenting your data. You can easily export the presentation as a Microsoft PowerPoint file (.pptx) for editing.
❇️ Flexible export options
Pollfish offers multiple convenient export options for your visualizations and presentations, including PDF, Excel, Crosstabs, and SPSS.
Advanced Questionnaire Design Capabilities
Pollfish offers advanced survey design functionality with a user-friendly interface. It’s intuitive and easy to use for both beginners and market research experts, requiring zero programming knowledge.
❇️ Sophisticated skip logic and branching

Customers regularly highlight Pollfish’s conditional branching logic functionality as a standout feature in reviews on Trustpilot, Caterra, and G2:
“The branch logic is one of the best features of the software.”
– Read the full review here
“The interface was extremely intuitive and easy to use. I especially liked how we set up the logic for the questions. Furthermore, the customer support agents were awesome. They responded to every question I had in a timely manner. (And before we even paid a cent!).”
– Read the full review here
“Super easy to set up a questionnaire including logics, test it and send it. Get results <24 hours which can be filtered in so many ways.”
– Read the full review here
❇️ 16 question types, including more advanced options
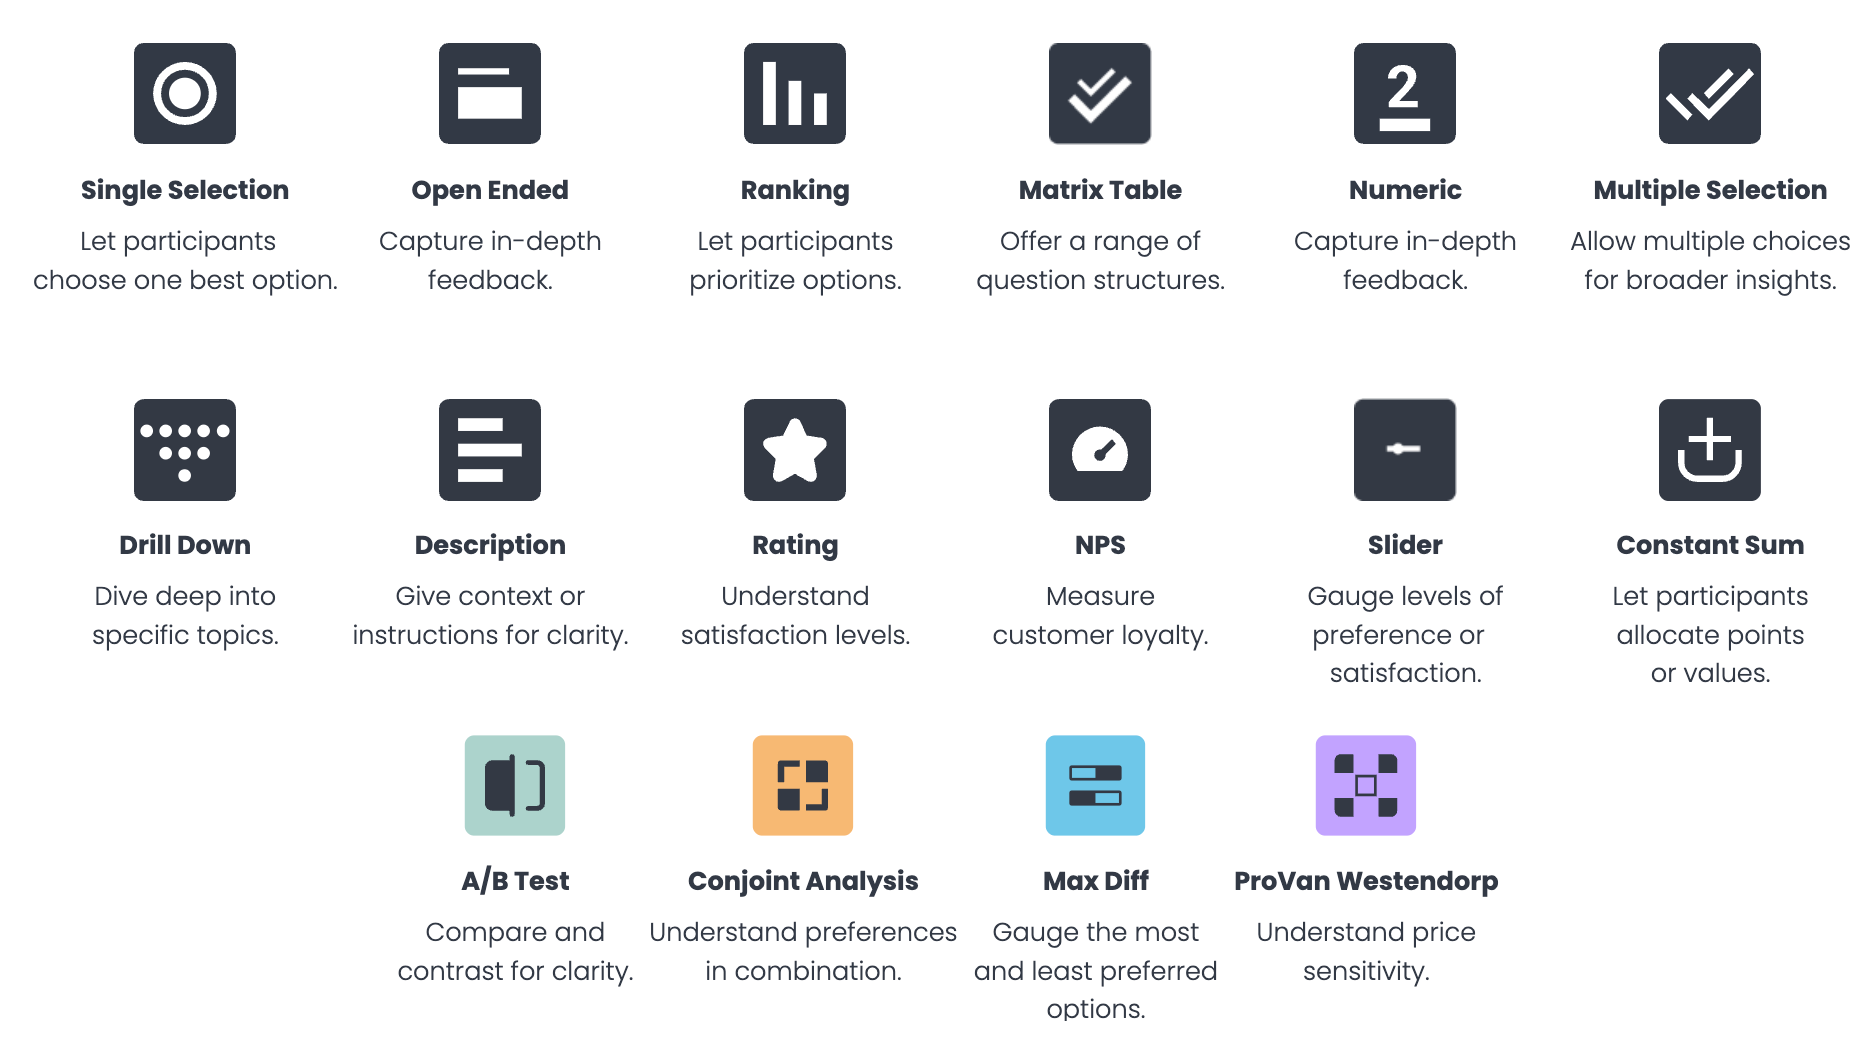
We offer 16 question types, including all the standard options you'd expect (e.g., single selection, open-ended), plus more advanced question types, such as:
- A/B test
- Conjoint analysis
- Max Diff
- Van Westendorp
- NPS
- Constant Sum
You can explore the full list of question types here.
❇️ 19+ advanced survey design capabilities
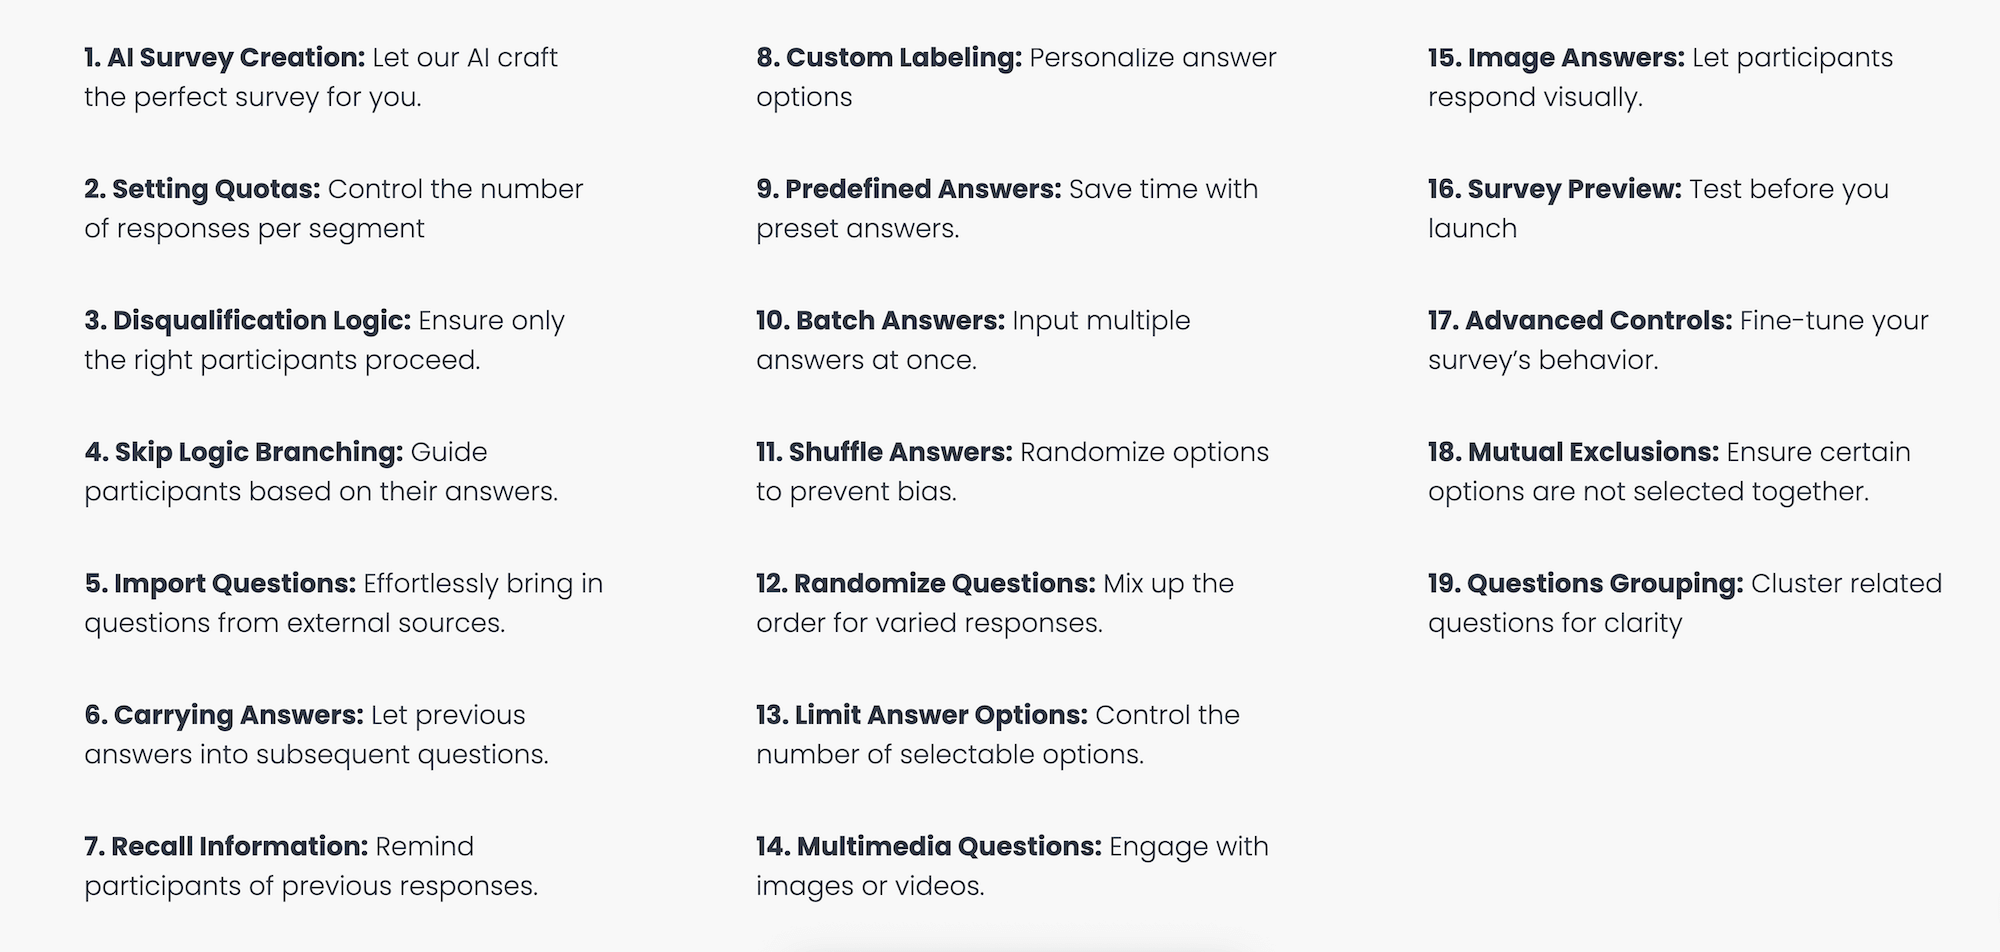
No matter how complex your survey programming needs are, you can accomplish them with Pollfish. We offer a wide range of questionnaire design capabilities, including:
- Conditional branching
- Screening questions
- Question and answer shuffling
- AI survey creation
- Survey templates
You can explore our in-depth survey design capabilities here.
Responsive Customer Support from Seasoned Market Researchers
Our customers often comment on our stand-out support quality, which is surprisingly rare even in an industry like market research, where customers often require more guidance.
❇️ Expert support for every stage of research
Pollfish goes beyond just chatbots and basic technical troubleshooting. Our market research experts can help you with everything, including designing better studies, targeting the right audience, analyzing your results, and more.
❇️ 24/7 chat or phone support
Our experts are available whenever you need them. We offer genuine 24/7 support via live chat or phone, including on evenings and weekends.
As several customers shared:
“The customer service team is super responsive too for those more complex enquiries about the tool and criteria. All in all this experience has been way easier (and cheaper) than any other 'big players' out there”.
– Read the full review here
“The customer support agents were awesome. They responded to every question I had in a timely manner. (And before we even paid a cent!)”
– Read the full review here
Interested in Trying Out Pollfish?
We invite you to:
- Sign up for a free account and test the platform (no credit card required).
- Inquire about our full-service market research services through our parent company Prodege, which manages the complete survey process for you from beginning to end.
2. Qualtrics

Qualtrics is an Alchemer alternative that categorizes its features into three categories:
1. Customer Experience
- Voice of Customer
- Omnichannel Experience Management
- Digital Experience Analytics
- Website & App Feedback
- Location Experience Hub
- Online Reputation Management
- Contact Center Analytics
- Quality Management & Compliance
- Agent Coaching
- Edge Instant Insights
2. Employee Experience
- Employee Engagement
- Employee Pulse
- Employee Research
- Candidate Experience Management
- Employee Onboarding & Exit
- 360 Development Feedback
- Employee Retention Analytics
- Continuous Employee Listening
3. Strategy & Research
- Strategic Market Research
- Product Research
- Brand and Communication Research
- User Experience Research
- Edge Audiences
Note: To learn how Pollfish compares to Qualtrics, see this article.
3. Suzy

Suzy is an alternative to Alchemer that offers several use cases, some of which include:
- Attitudes and Usage
- Tracking
- Feature Testing
- Package Testing
- Price Testing
- Positioning
- Message Testing
- Path to Purchase
- Retailer Sell-in
- Heatmapping
Note: To learn how Pollfish compares to Suzy, see this article.
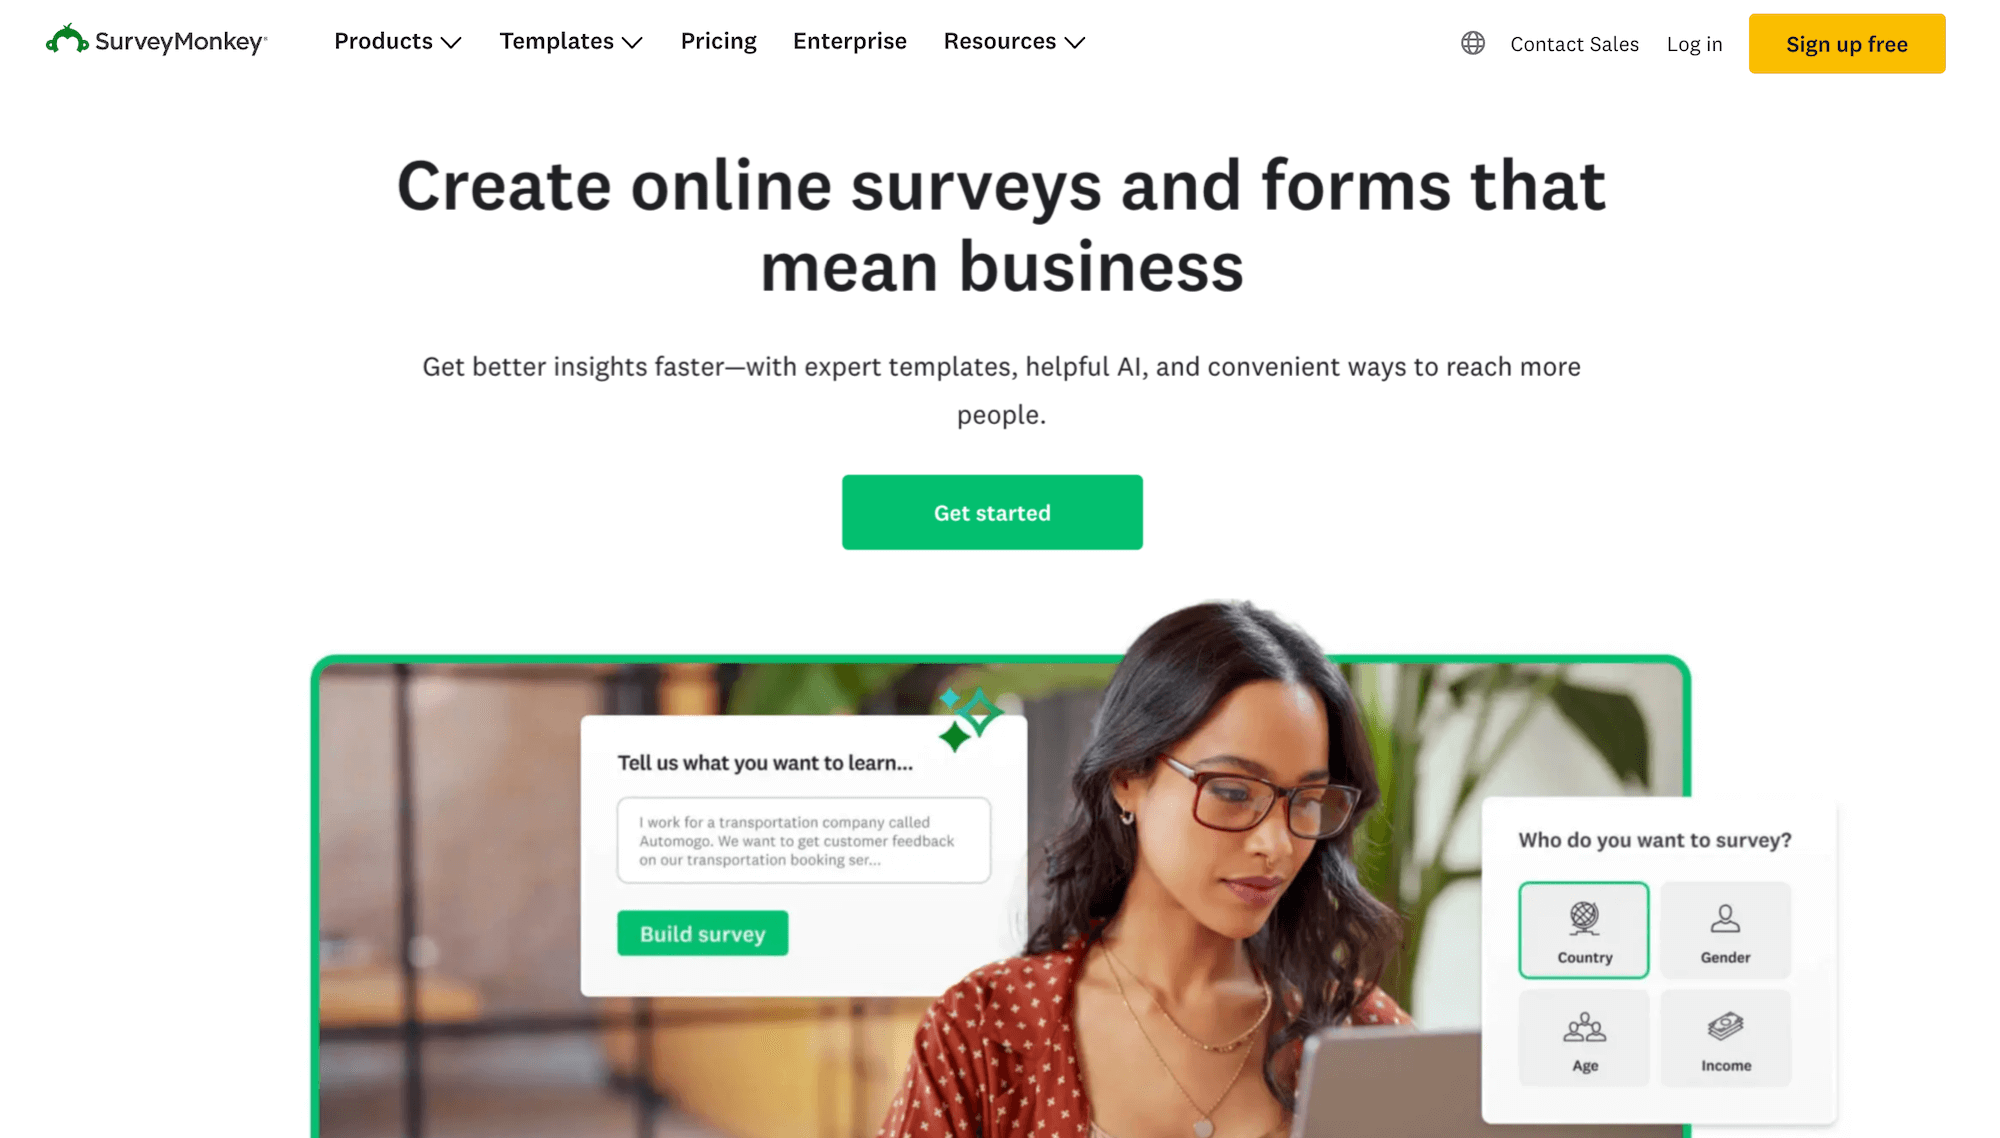
4. SurveyMonkey
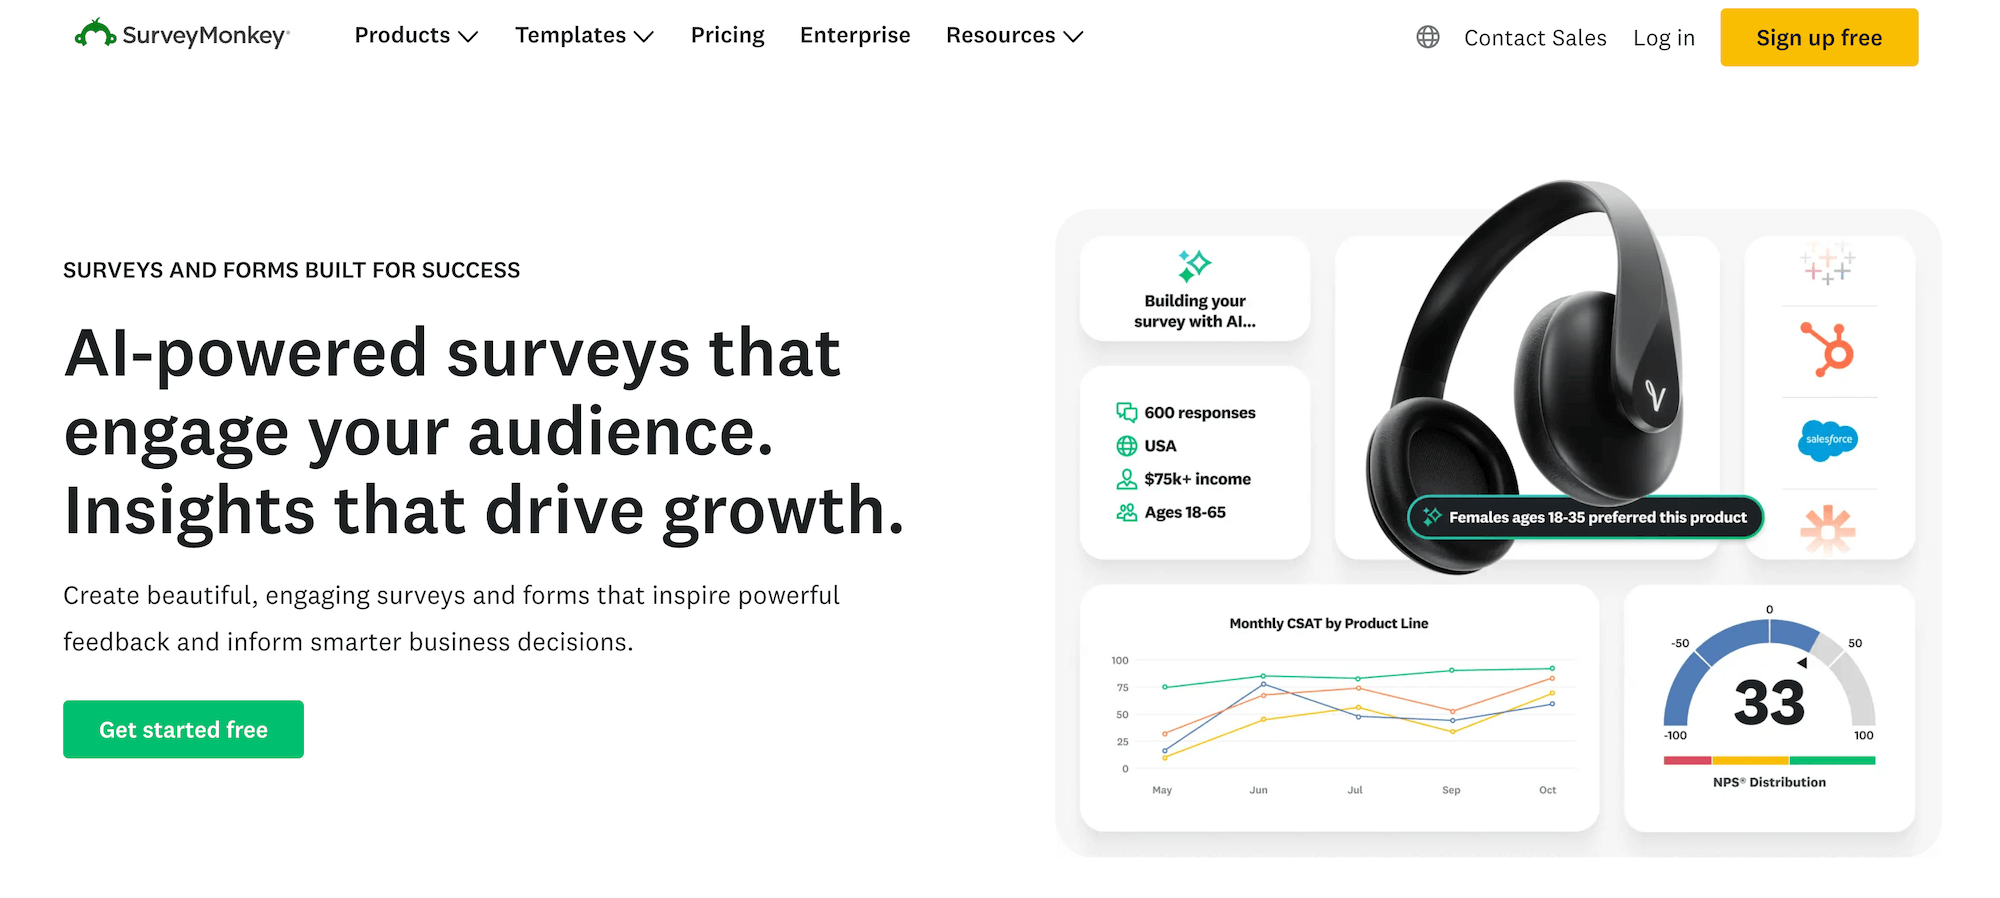
SurveyMonkey is an Alchemer competitor whose features include:
- SurveyMonkey Genius for AI-powered survey creation
- Customizable survey templates
- Survey branching and skip logic
- Response quotas
- A/B testing for better decision making
- Survey branding and theme customization options
- Custom URL survey links
- Flexible data collection options (email, web link, social media)
- Real-time results tracking
- Real-time insights
- Text analysis tools for open-ended responses
- Integrations with 100+ platforms, including CRMs like Salesforce.
Note: To learn how Pollfish compares to SurveyMonkey, see this article.
5. SurveySparrow
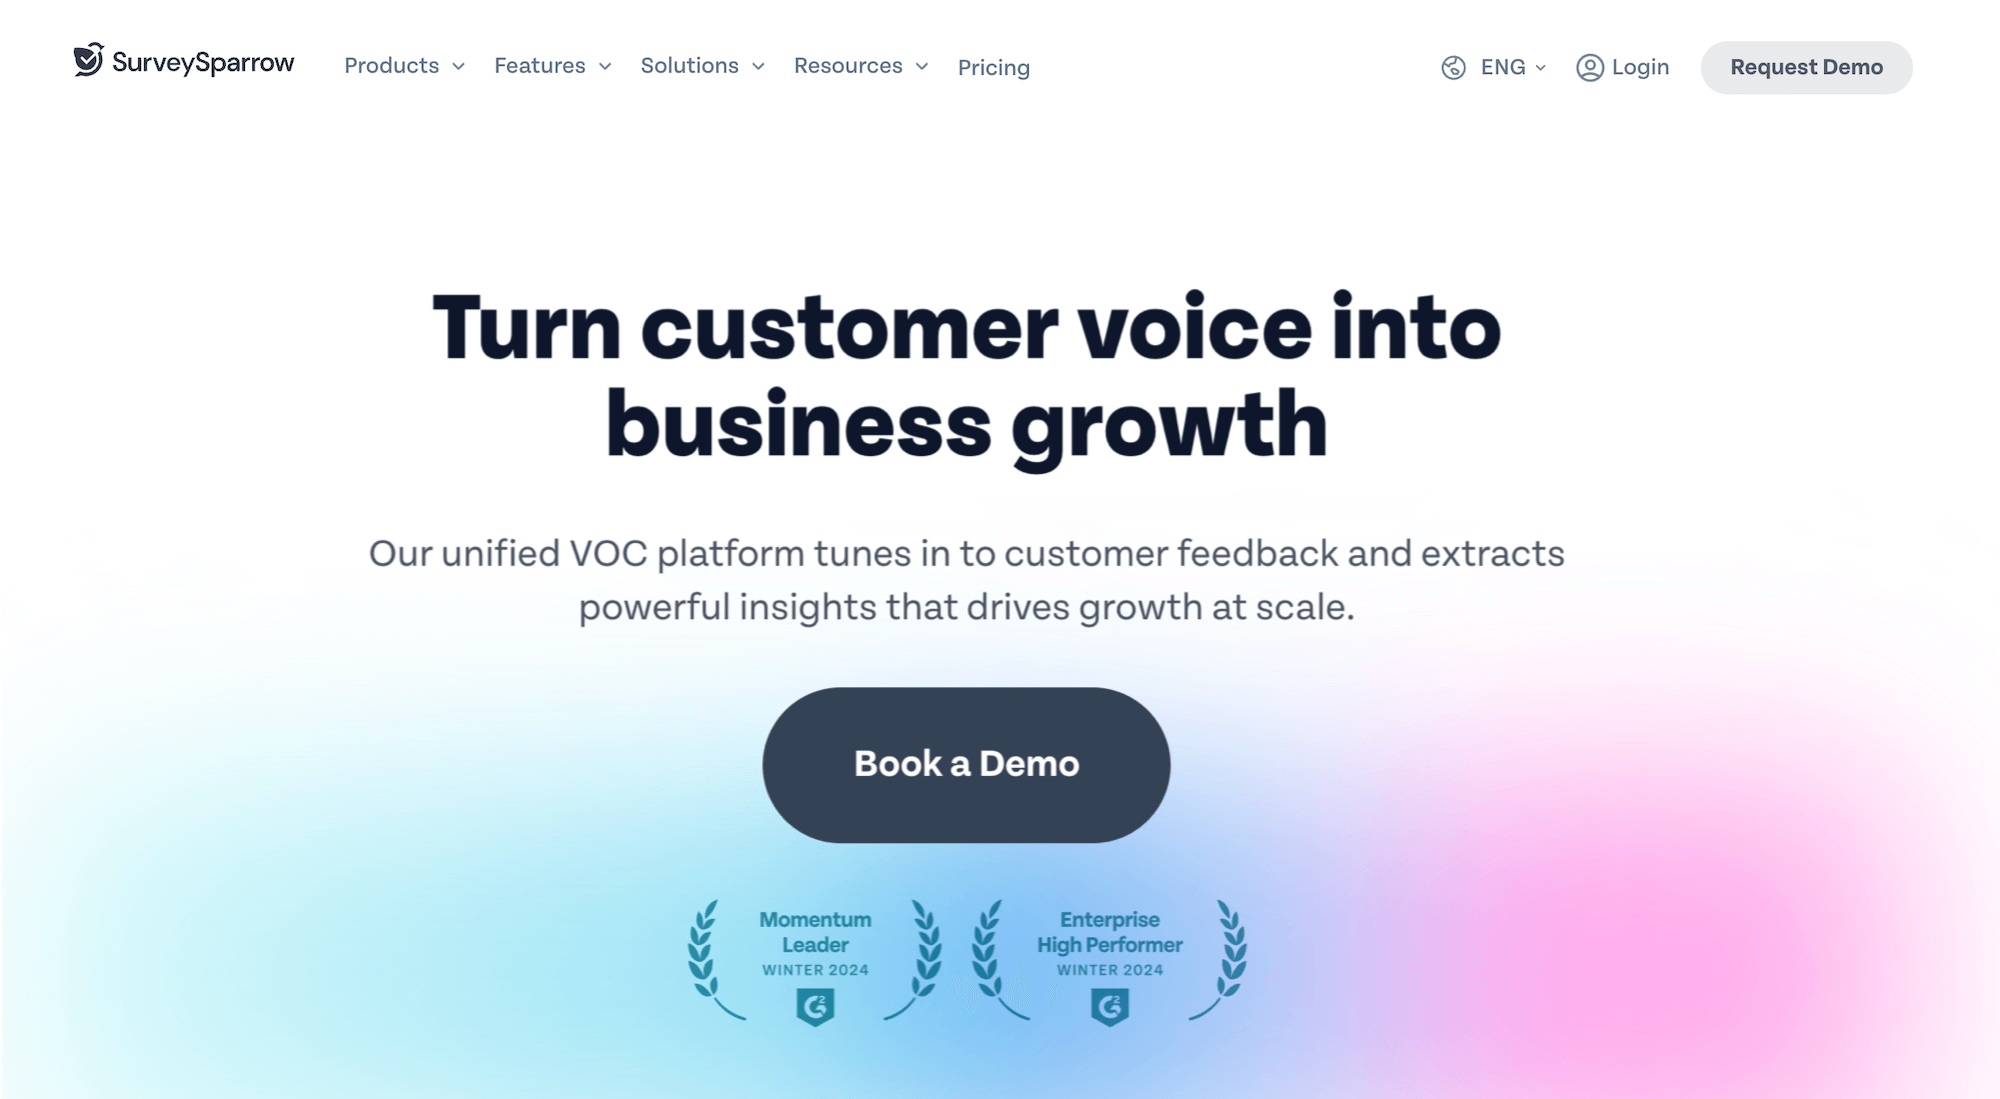
SurveySparrow is an Alchemer alternative that breaks its features down into five categories:
1. Surveys
- Conversational Surveys
- Offline Surveys
- SMS / Text Surveys
- Executive Dashboard
- SpotChecks: In-app Feedback
- AI-powered Text Analytics
- Multi-lingual Surveys
- Security
- Workflows & Automation
- White Labelling
2. CX
- NPS
- CSAT
- Voice of Customer Surveys
3. Reputation
- Review Monitoring
- Social Listening
- Boost Reviews
4. Ticketing
- SLA Management
- Automated Workflows
- Ticket Dashboard
- Locations
5. 360 Assessments
- Personalized Insights
- AI-driven PDPs
- Heatmaps
- Team Analytics
6. QuestionPro
QuestionPro is an alternative to Alchemer whose features include:
- 20+ professional survey themes
- Skip logic branching
- Google Sheets integration
- Customizable thank you page
- Raw data export
- 24/7 Email support
- Visual layout
7. Typeform
Typeform is a tool specializing in online forms, and its key capabilities include:
- Form builder
- Survey maker
- Quiz maker
- Test maker
- Poll builder
- Application form builder
- Landing page builder
- NPS form builder
- Registration form builder
- Short form builder
You can use Typeform for use cases, such as:
- Market research
- Lead generation
- Employee onboarding
- Employee satisfaction
- Employee engagement
- Customer feedback
- Customer satisfaction
- Event planning
- Customer engagement
- Customer testimonials
- Candidate feedback
Interested in Trying Out Pollfish?
We invite you to:
9 Best Conjoint Analysis Software in 2026 (In-Depth Look)
9 Best Conjoint Analysis Software in 2026 (In-Depth Look)

In this post, we review the best conjoint analysis software platforms on the market.
To start, we’ll discuss our product, Pollfish. We offer robust conjoint survey design tools and powerful built-in analytics that save you significant time and reduce reliance on external tools.
Then, we’ll discuss other conjoint analysis software to help you make a well-informed decision.
Note that there is no such thing as a truly free conjoint analysis software. Most of the tools on this list (including our own) offer free plans for when you survey your own audience. However, if you want access to audience panels or more advanced features, payment is typically required.
Best Conjoint Analysis Software
1. Pollfish
In this section, we’ll discuss:
- Step-by-step overview of how to build conjoint analysis surveys with Pollfish. You'll discover two key advantages:
- Pollfish's advanced platform handles even the most sophisticated conjoint analysis requirements, letting you design surveys that exactly match your research needs
- Our platform is designed for ease of use, so you can jump right in and start building conjoint analysis surveys without a steep learning curve.
- How to analyze conjoint analysis results directly within Pollfish with no external tools needed. Specifically, we’ll show you how to create these essential charts with just a few clicks:
- Attribute Relative Importance Graph
- Level Utilities
- Distribution of Level Preferences Graph
- Ranked List of Product Alternatives, and more (these are just a few of the key examples we'll cover)
- Additional key reasons to choose Pollfish for your conjoint analysis survey needs, including:
- High-quality audiences with rigorous data quality standards
- Transparent pay-per-response pricing that scales with your needs
- Fast turnaround time from a few hours to a few days
- Complimentary support from market research experts
- Intuitive and easy to use, with a minimal learning curve
- Full-service option where we’ll handle your conjoint analysis survey needs from start to finish
Let’s dive in.
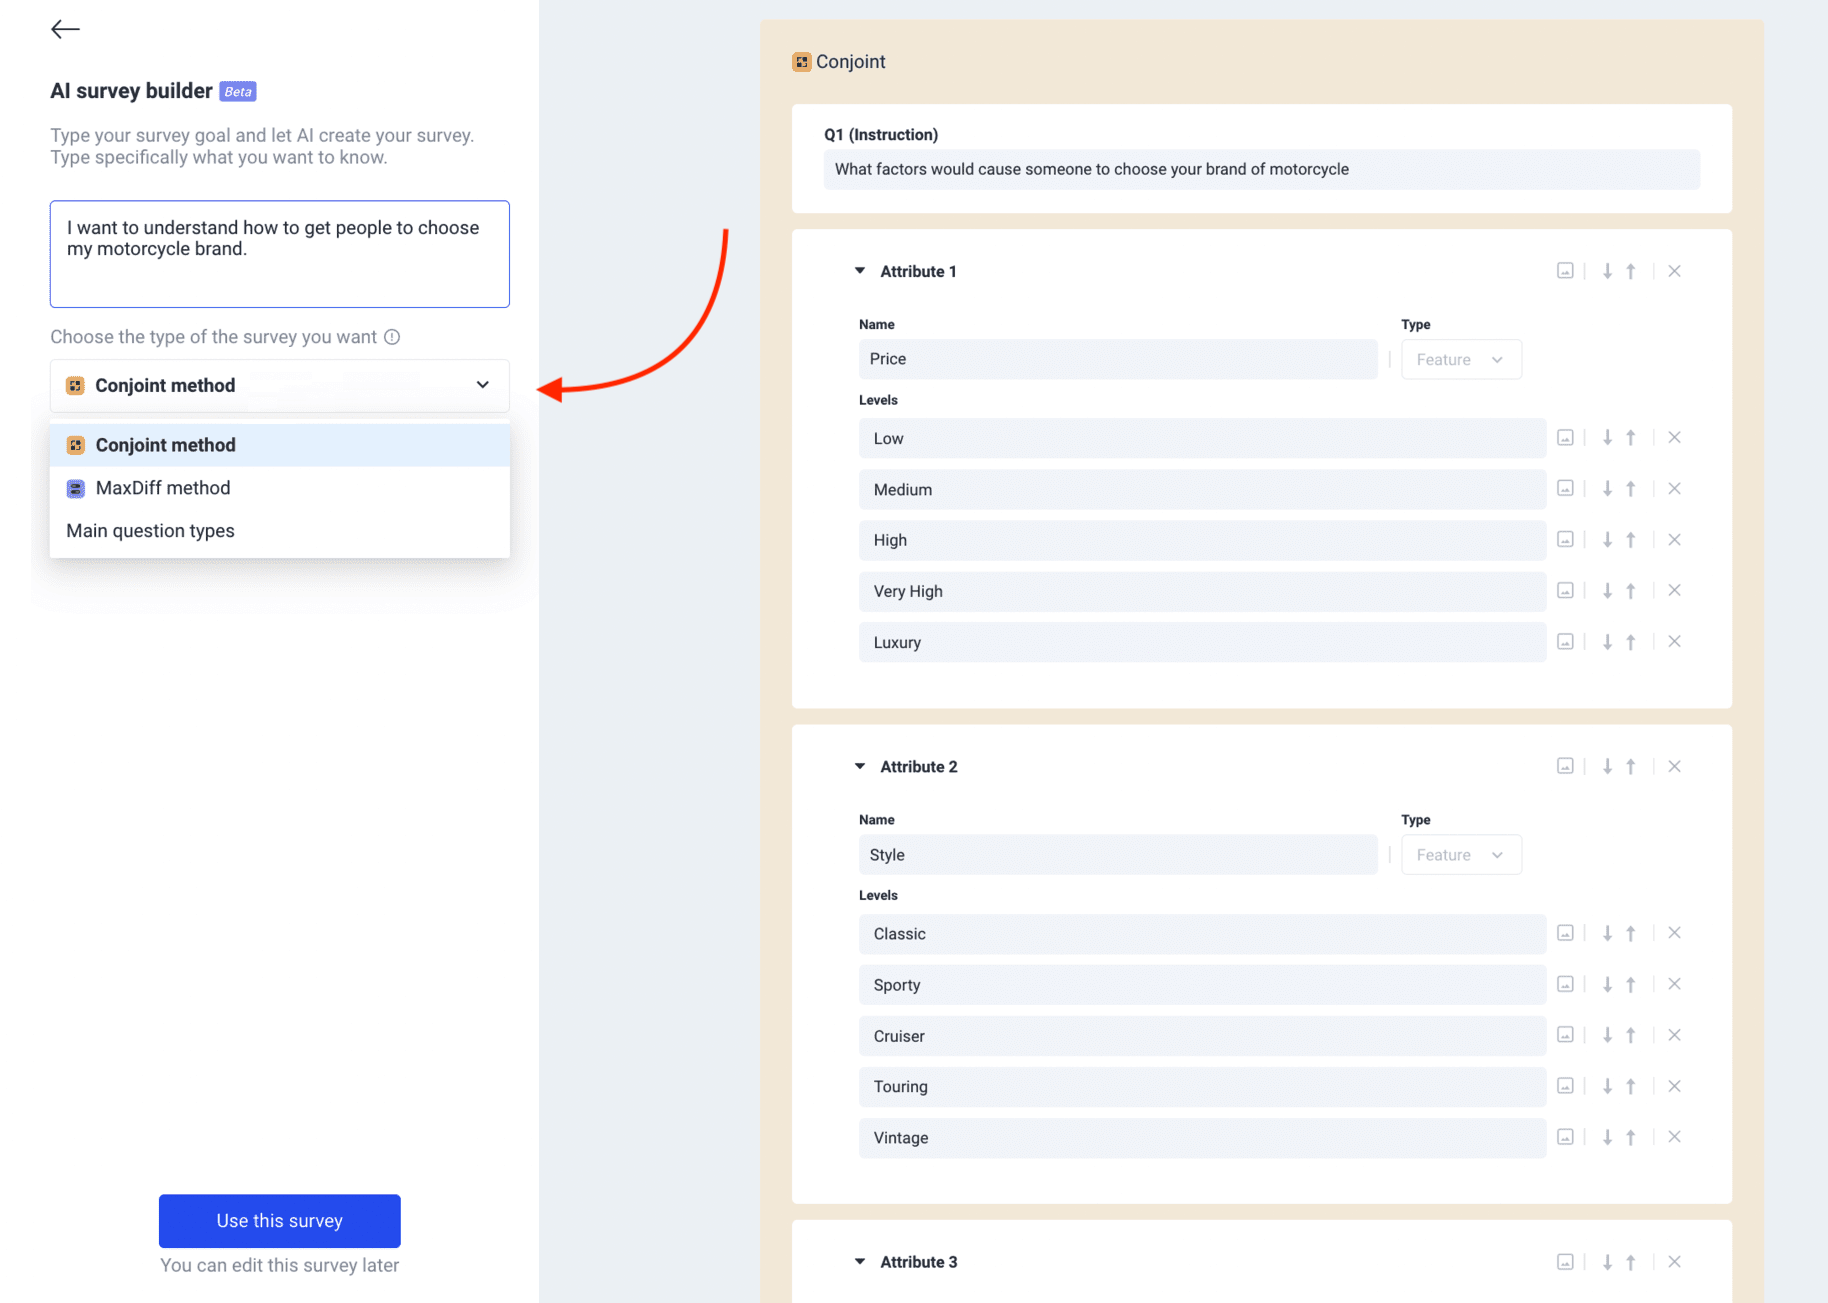
How to Build a Conjoint Analysis Survey in Pollfish
Here’s a brief, step-by-step overview of how you can create a conjoint analysis survey with Pollfish. For a more in-depth explanation of each step, see this article.
❇️ Step 1: Open the Pollfish dashboard and hit “Create a new survey”
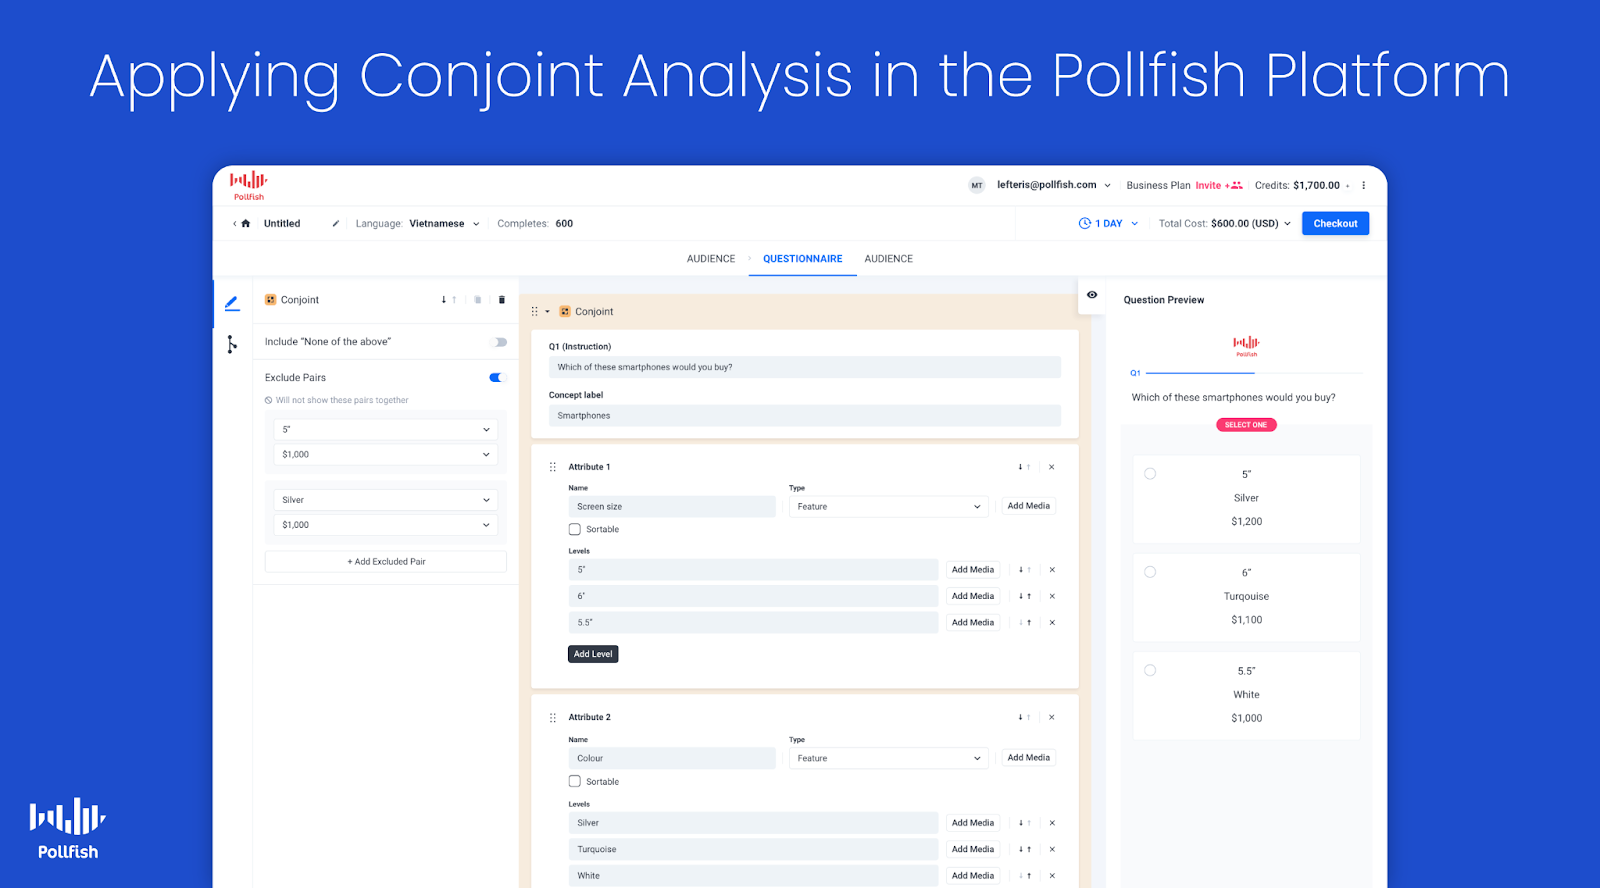
❇️ Step 2: Add the conjoint method to your survey

Select the Conjoint option from the question type options.
❇️ Step 3: Add the instructions
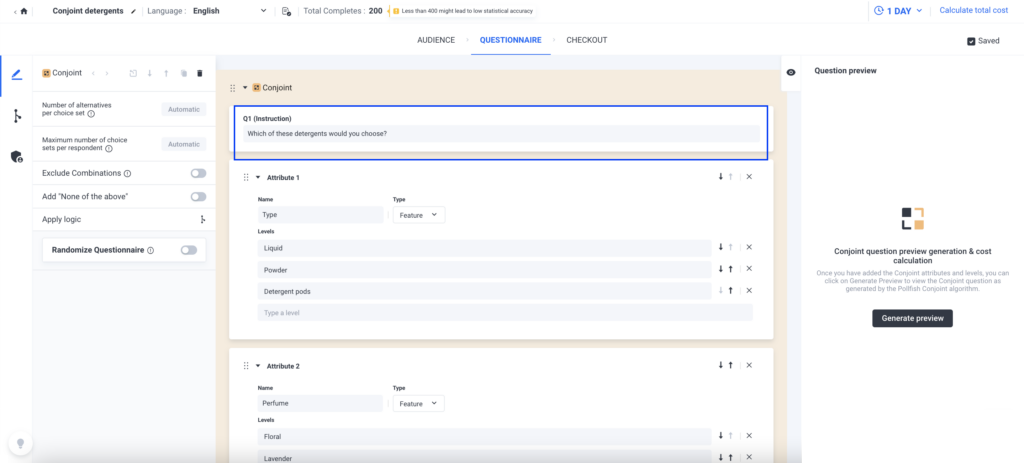
Provide instructions on how to respond to the question text. Conjoint is presented as a repeated single selection question with different sets of product alternatives each time.
❇️ Step 4: Add product attributes and levels
Attributes are a product’s characteristics, such as shape, color, scent, etc.
Levels are the values that each attribute can have, such as lavender scent, lemongrass scent, etc.

You can specify price as an Attribute or Level.
❇️ Step 5: Heed the following restrictions and advice on attributes and levels
- A conjoint experiment should have at least 2 attributes
- Each attribute should have at least 2 levels
- Use a maximum of 6-7 attributes. Any more, and respondents may struggle to evaluate all the different options
❇️ Step 6: Prohibit particular level pairs
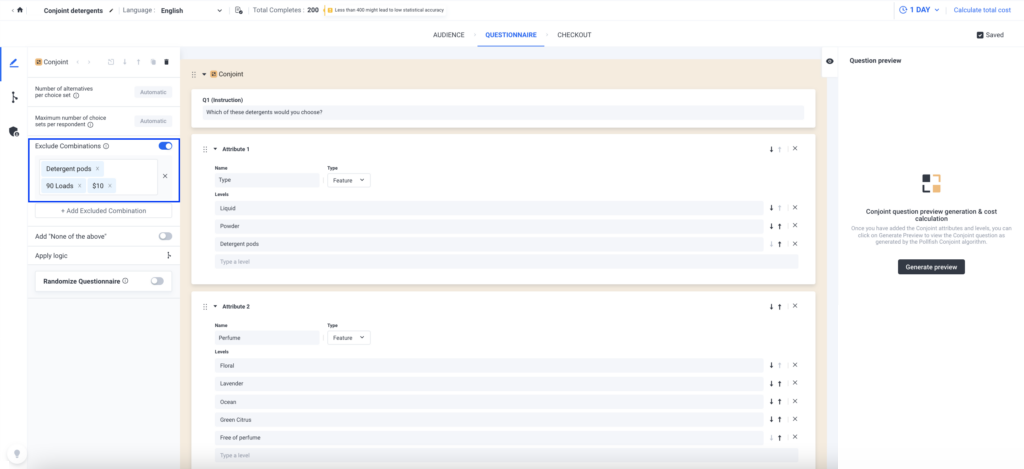
By default, all attribute levels have an equal likelihood of displaying together. This can lead to unrealistic product alternatives, such as a product with all the best features at the lowest price.
In order to prohibit such alternatives, you can use the “exclude combinations” setting.
❇️ Step 7: Optionally enable none of the above
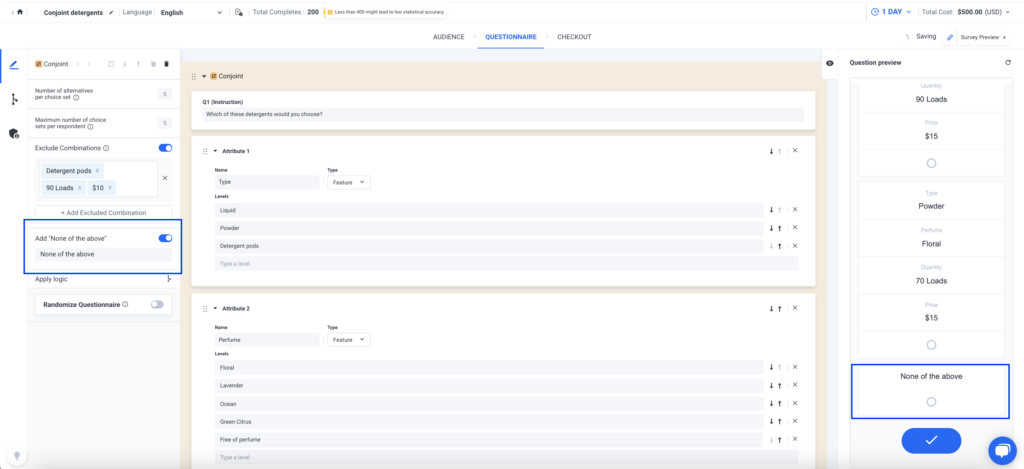
The “none of the above” option is disabled by default. You can opt to enable it, which will make it visible on mobile every time a respondent views a choice set of alternatives.
❇️ Step 8: Access the preview
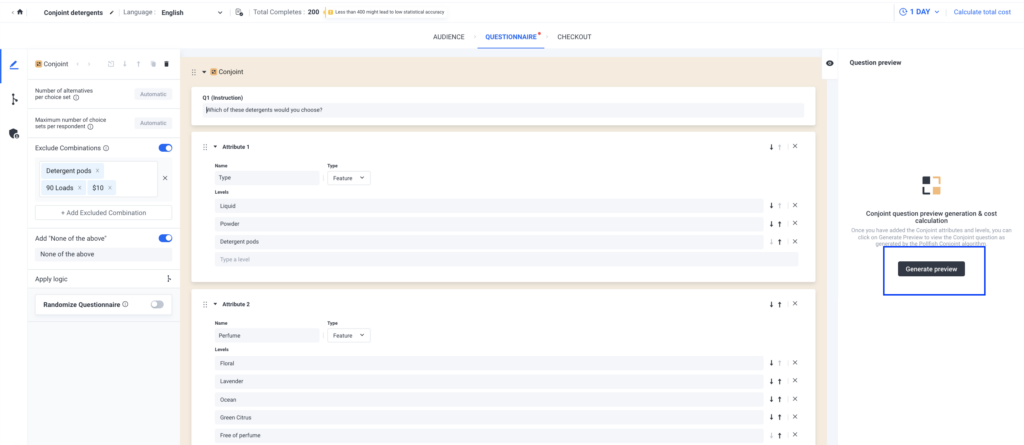
To preview a survey with a Conjoint question, click the “Generate preview” button in the questionnaire tab. This runs the Conjoint Design of Experiments algorithm to display the actual question respondents will see, along with an updated survey flow, cost, and design details. Any time attributes, levels, or exclusions change, you need to regenerate the preview to reflect the updates.
How to Analyze Conjoint Analysis Results Within Pollfish
With most conjoint analysis software, you have to export your results and spend a lot of time and energy in external tools creating filters and custom charts.
In contrast, with Pollfish, you can easily create custom branded charts directly within our platform with just a few clicks, eliminating the need for external tools and saving time and effort.
Below, we cover a few examples of charts you can generate to analyze conjoint analysis survey results. Of course, these are just a few examples — you can create other types of charts, as well.
❇️ The Attribute Relative Importance Graph
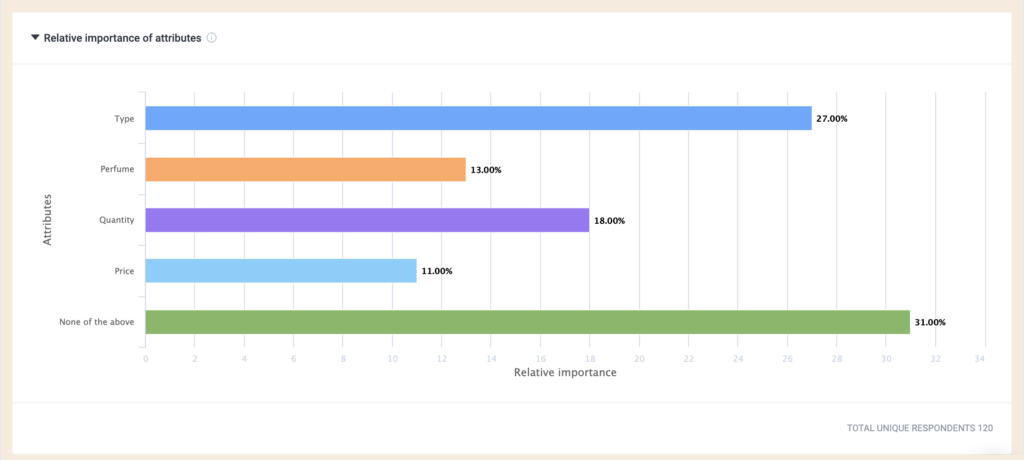
This graph shows how much influence each attribute has on respondents’ choices, with higher percentages indicating a stronger impact. It highlights which attributes matter most compared to others and reflects only the specific levels included in the survey design.
❇️ Level Utilities
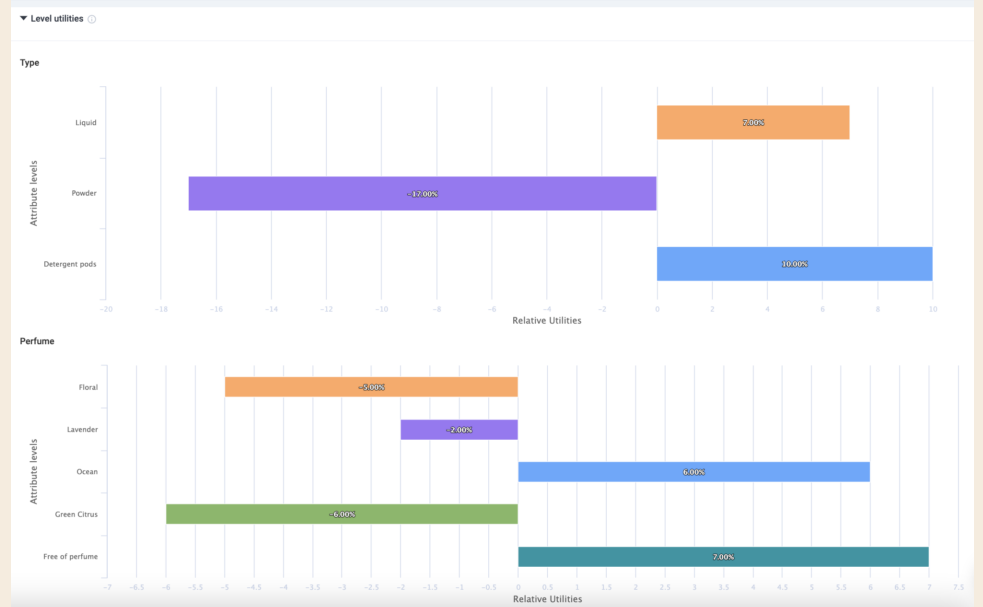
This view breaks down how individual levels within an attribute influence customer choice. It shows preference scores for each level, with higher percentages indicating a stronger impact on respondents’ decisions.
❇️ Distribution of Level Preferences Graph

This visualization shows the likelihood of one level being chosen over another when all other attributes are held constant. Higher percentages indicate stronger respondent preference for that level within the attribute.
❇️ Willingness to Pay
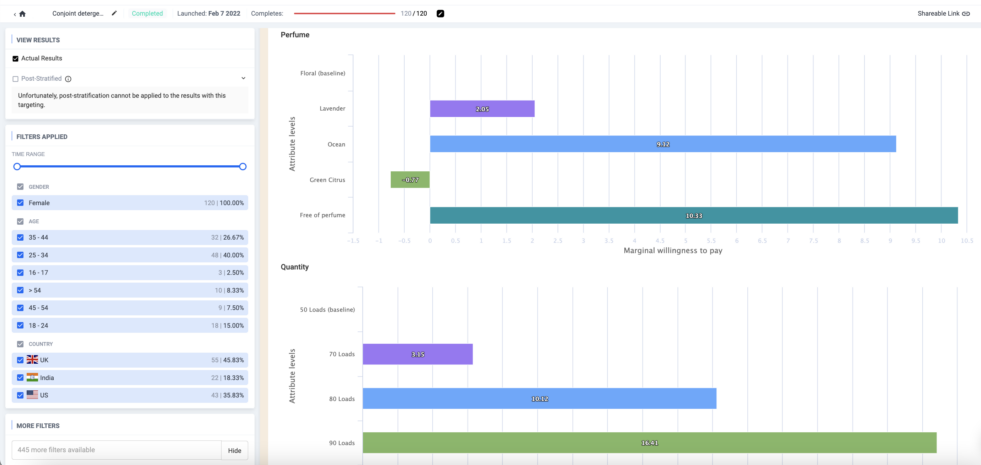
Willingness to pay measures the maximum amount customers are willing to pay to move from one level of an attribute to another. Displayed as monetary values in a chart, it helps compare upgrades or downgrades between levels, but is only available in Conjoint surveys with a Price attribute. By changing the baseline level, you can see how preferences shift and what respondents value more or less.
❇️ Ranked List of Product Alternatives
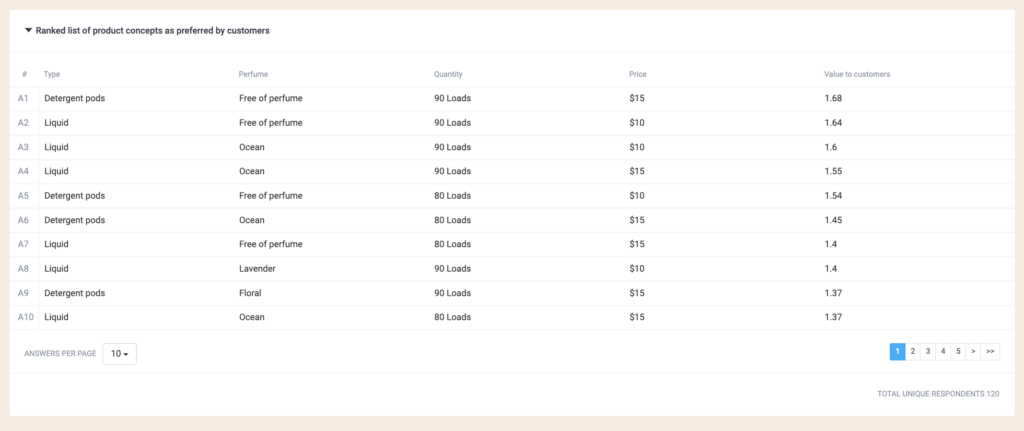
This table ranks product alternatives based on respondent preferences, with the top options being the most favored. Results can be filtered by demographic criteria, and the charts will recalculate accordingly, provided there are enough responses to ensure reliability.
❇️ Additional Chart Creation & Reporting Options
Beyond the visualizations above, there are also other types of advanced charts you can generate in just a few clicks for both conjoint analysis surveys and other types of surveys.
Another customer favorite feature is the ability to create presentations directly within Pollfish and export them as a PowerPoint file. For example, you can customize any of the earlier conjoint analysis visualizations above by adding your brand’s colors directly within Pollfish. Then add them to your presentation in just one click, saving time and helping you share survey results in a more streamlined way.
Note that while we designed Pollfish to help you create and analyze charts directly within the platform, we also offer flexible export options (including PDF, Excel, crosstabs, SPSS, and more) so you can analyze results externally as desired.
Beyond the functionalities mentioned above, Pollfish also offers other key advantages, including:
- High audience data quality
- Transparent pay-per-response pricing
- Fast turnaround time
- Quality customer support
- Ease of use and intuitiveness
We’ll briefly cover each of these below and share quotes from customers.
High-Quality Audiences with Rigorous Data Quality Standards
Data quality is especially critical in conjoint analysis, where flawed responses can distort how attributes and levels are valued. To learn more about common data quality issues (and how Pollfish fixes them), see this article.
Pollfish utilizes our parent company Prodege’s first-party respondent communities, applying strict quality controls like verified purchase behavior, respondent trust scores, manual review of open-ended answers, sophisticated fraud prevention technology, and more. This ensures that results truly reflect consumer preferences and provide a solid foundation for product and pricing decisions.
As several of our customers shared on Trustpilot:
"The most important point to make is that I trust the responses of my survey. My target audience was very specific and I could tell that the responses were legitimately coming [from] subjects in my target audience.”
“Each time I use this service I am blown away by the speed with which the responses come in and with the detail which most of them include. You can tell that the respondents take this very seriously. They must really enjoy doing it.”
Transparent Pay-per-Response Pricing That Scales with Your Needs
Pollfish uses a transparent pay-per-response pricing model, starting at $0.95 per response.
Costs update in real time as you add targeting filters, so you always see the exact price per response and total survey cost upfront. This ensures clear, predictable budgeting for conjoint analysis and other survey needs.
As one customer shared on Trustpilot:
“The dollar amount they quote you in their cost calculator tool, and the number they show when you're developing the survey, is the number you pay. I was burned multiple times by SurveyMonkey charging me unexpected amounts and making it difficult to quit an expensive subscription. I'm so happy to have found Pollfish as an alternative. Their support team also responds VERY quickly to chat messages and has been tremendously helpful the few times I had questions.”
– Read the full review here
Fast Turnaround Time from a Few Hours to a Few Days
Because Pollfish leverages Prodege’s first-party audience data, we can deliver conjoint analysis survey results much faster than platforms relying on third-party sources.
Broad population samples (e.g., U.S. adults aged 18–65) can be completed within hours, while highly specific audiences (e.g., households with two children, income over $250,000, living in Phoenix) are typically fulfilled within a few days.
As multiple reviewers noted:
“The thing that amazes me most is how quickly you can get your data results back. So fast! Usually in a couple of hours.”
– Read the full review here
“Much more affordable than all the alternatives I found, and I had all my results ready within just a couple of hours.”
– Read the full review here
“I'm amazed at how quickly the platform was able to deliver rich, segmentable data from over 500 respondents. I had feature-ready insights in only 3 days.”
For turnaround estimates for your specific conjoint analysis survey, contact us here, or submit your question via live chat.
Complimentary Advanced Support from Conjoint Analysis Research Experts
Designing a conjoint analysis survey can be complex, which is why Pollfish offers complimentary 24/7 support from seasoned market research professionals.
We can help with proper survey design, targeting, data analysis, and more, whether you’re new to conjoint analysis or an experienced researcher seeking a second pair of eyes.
As several customers shared:
“The customer support agents were awesome. They responded to every question I had in a timely manner. (And before we even paid a cent!)”
– Read the full review here
“The customer service team is super responsive too for those more complex enquiries about the tool and criteria. All in all this experience has been way easier (and cheaper) than any other 'big players' out there”.
– Read the full review here
Intuitive and Easy to Use
Pollfish’s user-friendly, step-by-step survey builder is highly intuitive and simple to use. You can start from scratch or use templates, set precise audience qualifications with demographics and screeners, and easily add conjoint analysis questions alongside other formats.
As one of our customers noted on Capterra:
“Pollfish is probably the single easiest software I've ever used. The drag and drop builder is great itself, but the template library also has anything we ever need, so you rarely have to design anything from scratch. The templates are also designed very well, we usually pick one, do a couple edits, and deploy. The whole thing takes less than 10 minutes.”
DIY vs. Full-Service Options to Meet Your Specific Conjoint Analysis Needs
Whether you prefer to build surveys on your own or want to hand off the work to an expert team, Pollfish gives you the choice of a DIY or full-service option.
❇️ DIY Option: You can manage every step of building a conjoint analysis survey on your own with our intuitive platform. It’s easy to use, but our team is always available to offer complimentary expert support if you need help along the way.
❇️ Full-Service Option: If you’re short on time or want added expertise, our dedicated research team can run the entire project for you from survey design to final analysis and reporting.
You can learn more about our market research services here.
Get Started with Pollfish
Ready to start building your conjoint analysis survey? Pollfish makes it easy to get started.
You have three flexible options:
- Create a free account: Explore our platform and start building conjoint analysis surveys at your own pace. No credit card required.
- Schedule a demo walkthrough: Get a guided walkthrough tailored to your goals.
- Inquire about full-service brand research offering: Prefer a hands-off approach? As stated, our in-house research team can take care of the entire process from designing your survey and selecting the right audience to analyzing the data and delivering a final report tailored to your goals.
2. Conjointly
Conjointly is a survey platform with tools such as conjoint, MaxDiff, Gabor-Granger, Van Westendorp, brand-price trade-off, etc. It offers a range of conjoint analysis options, including Generic Conjoint, Brand-Specific Conjoint, SaaS-specific feature/pricing conjoint, TURF, and BPTO.
Key product features include:
- Automated translations and multi-country research projects
- Built-in panels with millions of respondents
- Manual and automated quality checks
- Exports to PowerPoint and Excel
- Support from experienced researchers for custom or self-serve projects
3. Qualtrics
Qualtrics is an enterprise customer experience platform that includes conjoint analysis for product optimization and pricing.
Key features include:
- Intuitive simulator for feature/price tradeoffs and competitor benchmarking
- Step-by-step guided study setup, no advanced research degree required
- Conjoint Dynamic Images (image-based attributes instead of text)
- Automated modeling and optimization that finds the best product configuration and price
- Integrated with larger CX platform for segmentation and customer experience analytics
4. Sawtooth
Sawtooth is a conjoint analysis platform offering design options like Adaptive Conjoint, alternative-specific designs, dual-response None, and custom HTML/CSS. It’s widely used by academics and practitioners for flexible, highly customizable conjoint studies and robust market simulations.
Key features include:
- Advanced conjoint design options, such as Adaptive Conjoint, alternative-specific designs, dual-response None, advanced prohibitions, custom HTML/CSS
- Market simulator to predict market share and run sensitivity analysis
- Simulation Insights Recommendation Engine for fast, actionable insights
- Extremely flexible and customizable designs (free-format, conditional graphics/prices)
- Dedicated customer support, conferences, and training
5. OpinionX
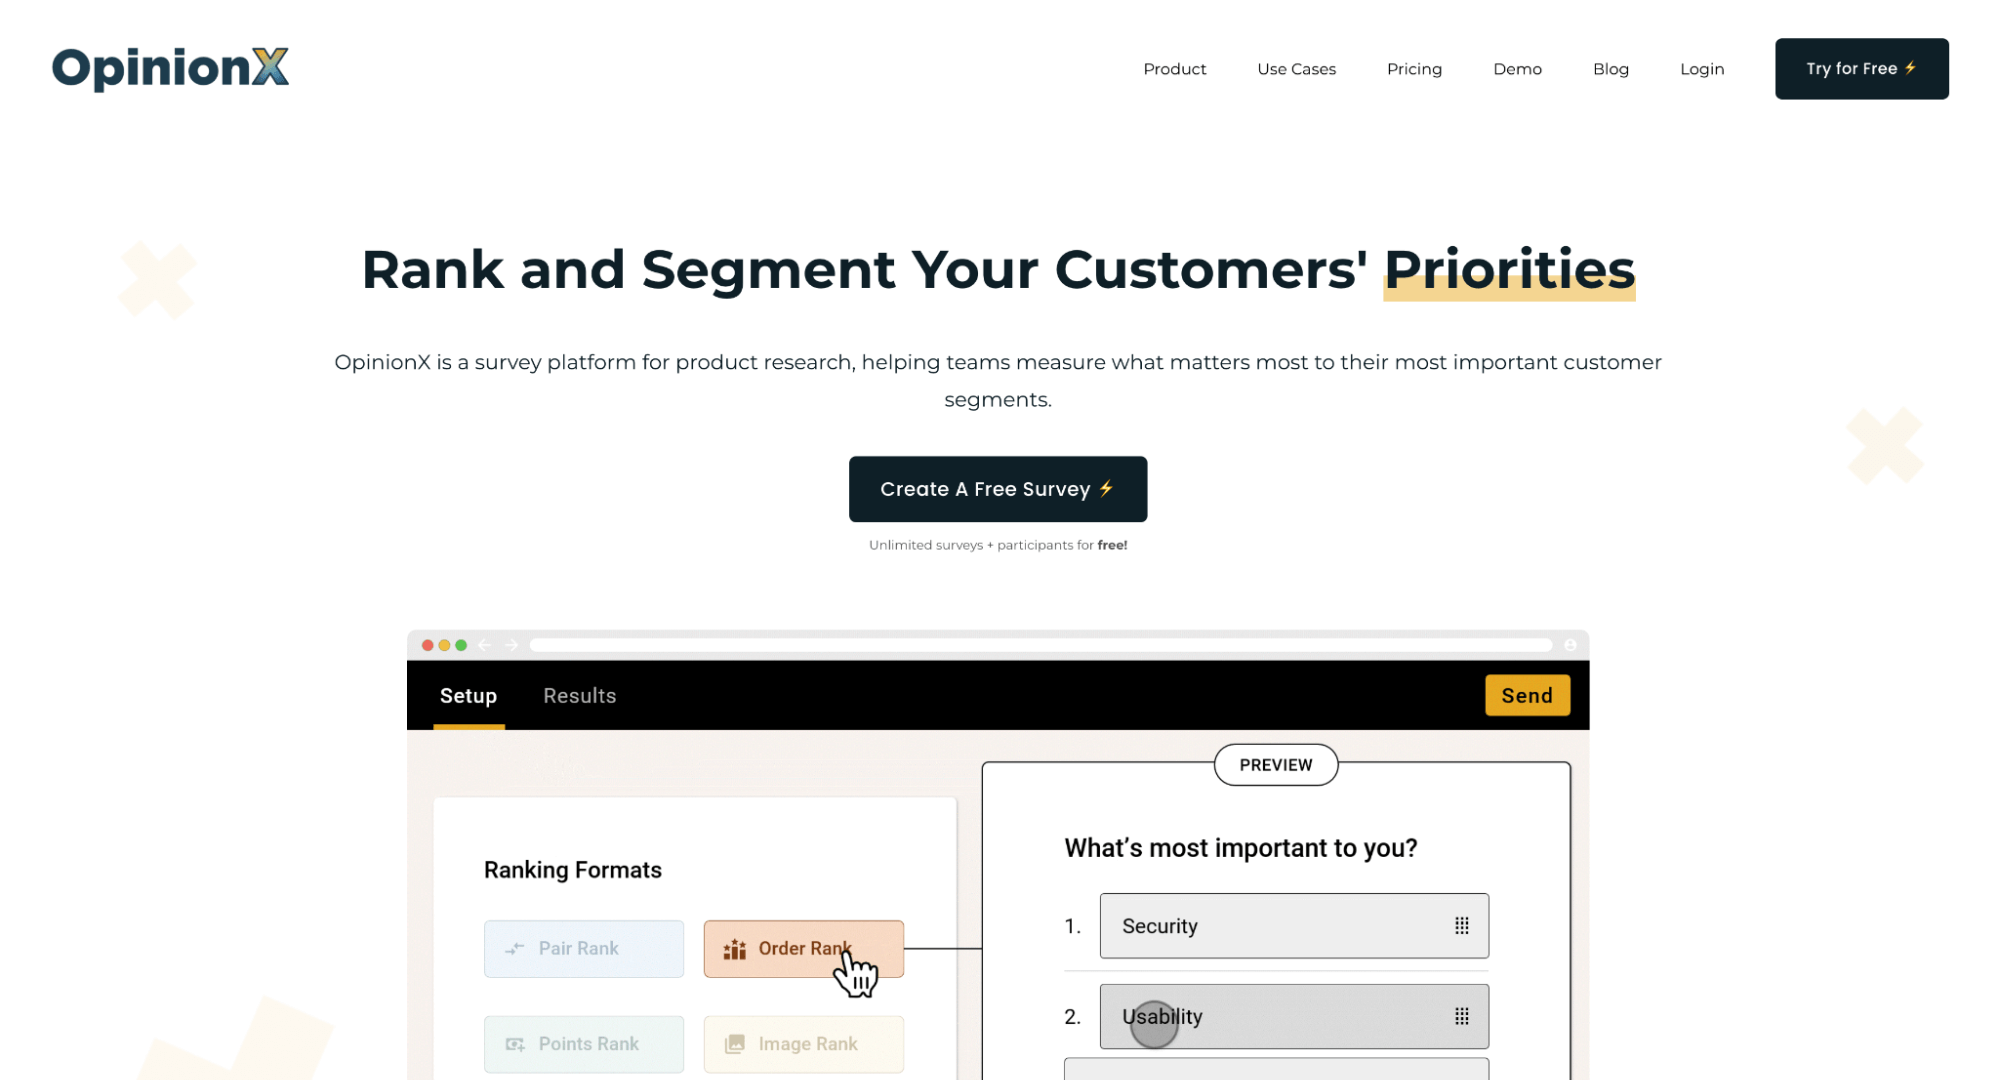
OpinionX is a conjoint survey tool that offers a number of reporting formats, including preference charts, ranked concepts, scenario simulator, marginal willingness to pay, crosstabs, clustering, and more.
Key product features include:
- Easy setup similar to Google Forms, integrates conjoint sections
- Machine learning automatically calculates preference scores in real time
- Subgroup filtering with a single click
- Special focus on engaging your own audience (CRM/HR data enrichment)
- Prohibited pairs exclusions engine
- Optimized for mobile
- Integrity checks to prevent spam responses
6. XLSTAT

XLSTAT is a statistical add-on for Microsoft Excel that includes full-profile conjoint analysis based on ratings or rankings. It outputs partial utilities, importance scores, and individual-level results, making it accessible for analysts who prefer working directly in Excel.
Key features include:
- Advanced statistical research methods: OLS-based ANOVA, MONANOVA
- Classification of individuals via k-means or hierarchical clustering
- No coding required
- Customizable Excel charts and reporting
7. 1000minds
1000minds is a decision-making and conjoint analysis platform built on its patented PAPRIKA method, which presents trade-offs one question at a time for accurate results. It is widely used in healthcare, government, and academia for transparent, fair, and inclusive decision-making.
Key features include:
- Emphasis on engagement, fairness, and inclusivity in tradeoff decisions
- Step-by-step model building (create, tailor, run, results)
- Transparent, auditable results, making it strong in ethics/governance applications
8. Q Research Software
Q Research Software is an analysis platform designed for market researchers, with conjoint analysis streamlined into a single interface. Its conjoint analysis features include efficient/partial profile designs, prohibitions, and randomized designs.
Other notable features include:
- Models supported: HB, latent class, multinomial logit, multi-class HB
- Interactive conjoint simulators
- Automates “grunt work” such as cleaning, stat testing, updating analyses, and reporting
- Integration with PowerPoint/Displayr for reporting
- Designed to democratize advanced analysis, so even beginners can design MaxDiff/conjoint with built-in warnings
9. Survey Monkey
SurveyMonkey is a survey platform that offers conjoint analysis alongside its broader research tools.
Key features include:
- Supports Choice-based conjoint (CBC) and Adaptive Conjoint Analysis (ACA)
- Simplified setup and guided process for non-researchers
- Strong integration with global panel
- AI-assisted survey creation and analysis
- Wide applications, including product dev, pricing strategy, R&D, and branding
- Option to outsource to SurveyMonkey research experts
Sign Up for a Free Pollfish Account
Create your free Pollfish account today (no credit card required, no commitments) and get started building a conjoint analysis survey with transparent pricing and high-quality data.

Synthetic Data for Market Research: Is It Effective? (+ Other AI Use Cases)
Synthetic Data for Market Research: Is It Effective? (+ Other AI Use Cases)

Market researchers are under growing pressure to deliver insights faster with smaller budgets and tighter timelines. That’s why synthetic data (AI-generated data designed to replicate real human responses) has gotten so much buzz recently. If it reliably mimics real-world data, this could fundamentally reshape the research landscape.
In this article, we’ll break down:
- What is synthetic data for market research and is it effective?
- Ways AI is optimizing market research without sacrificing authenticity
- Key benefits of Pollfish, our market research survey platform
What Is Synthetic Data for Market Research & Is It Effective?
Synthetic data is created by machine learning and AI models in an attempt to replicate real human respondents. Rather than recruiting and surveying actual participants, researchers can use these AI-generated datasets to gain insights while avoiding the cost, time, and logistical challenges of traditional data collection.
Is it effective? While synthetic data offers obvious advantages, current research has not yet demonstrated that it can match the quality of data collected from real respondents in quality samples.
Main use case: For now, synthetic data is primarily considered a tool to test the validity of your surveys rather than generating actual insights. You can populate it with test data to ensure that branching logic and other survey design elements are working properly.
The bottom line: True market understanding still depends on genuine human input. We recommend maintaining focus on established, reliable approaches while monitoring developments in synthetic data for future consideration.
The Current Value of AI for Market Research
While current research has not proven synthetic data to be consistently reliable, AI has demonstrated significant value in other market research applications.
Our survey platform, Pollfish, already incorporates AI through two key features:
- AI Survey Builder: Leverages AI to help you quickly build well-designed surveys by simply describing your research objectives. It also serves as an always-on helper for editing, translating, or making slight modifications to your project.
- Conversational AI: Allows real-time, one-on-one conversations with respondents via an AI moderator, enabling you to gather rich, qualitative insights at scale.
We'll explore both features in more detail below.
For additional information, see our article on the Best AI Survey Tools.
AI Survey Builder
Key Benefits of AI Survey Builder
- Provides a ready-made starting point with pre-written questions and survey structure, so you don’t have to start from scratch.
- Helps you come up with survey questions you may not have thought of on your own, so you don’t miss important insights.
- Acts as a smart editor when you need to make changes, translate, or add anything else to your survey.
How It Works
Using AI Survey Builder is extremely simple.
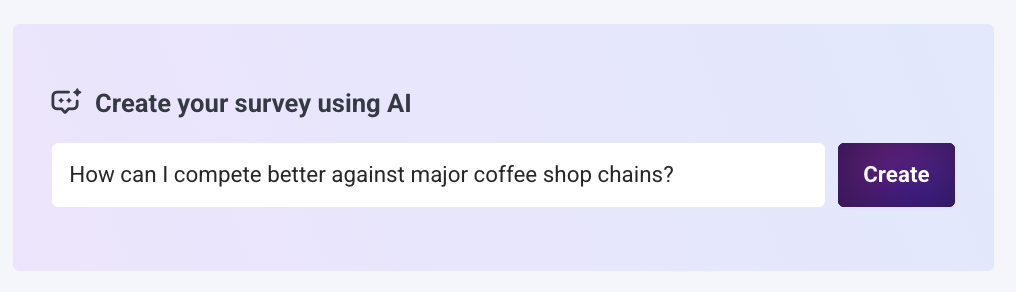
❇️ Step 1: Generate Your Survey with a Single Prompt
Simply enter your research objective and click "create" to instantly generate a complete, ready-to-launch survey.
As shown in the example above, you can phrase your objective as a question like "How can I compete better against major coffee shop chains?"
You can also include specific details in your prompt (e.g., target audience, key topics to explore, or particular metrics you want to measure) to create an even more tailored survey for your exact research needs.
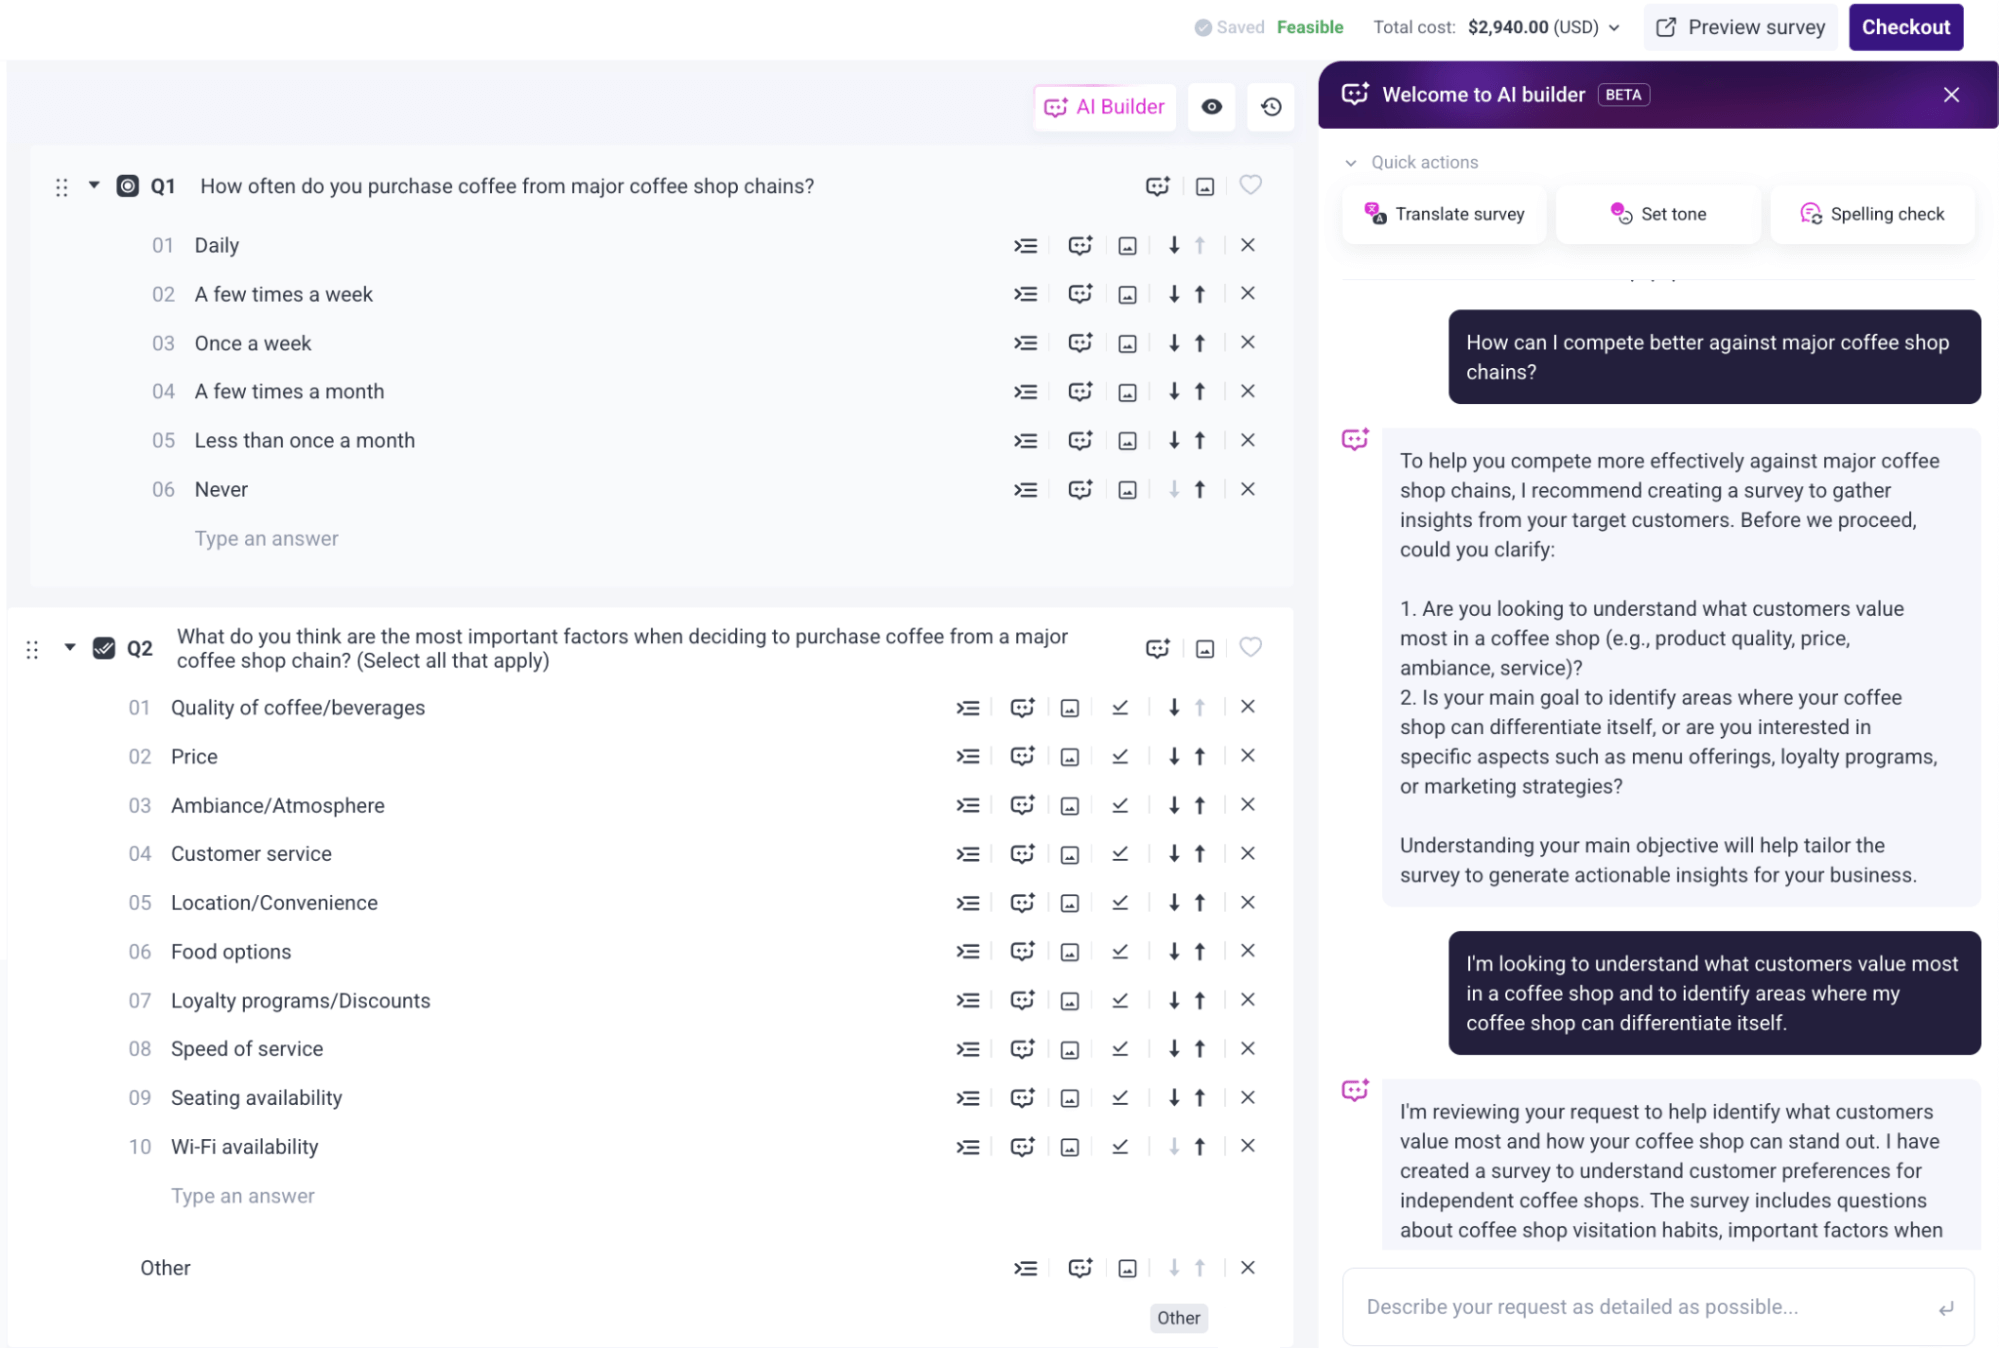
❇️ Step 2: Customize Your Survey Through Conversational Chat
Once your survey has been created, you can customize it by conversing with the AI via natural language, just like you would with a human:
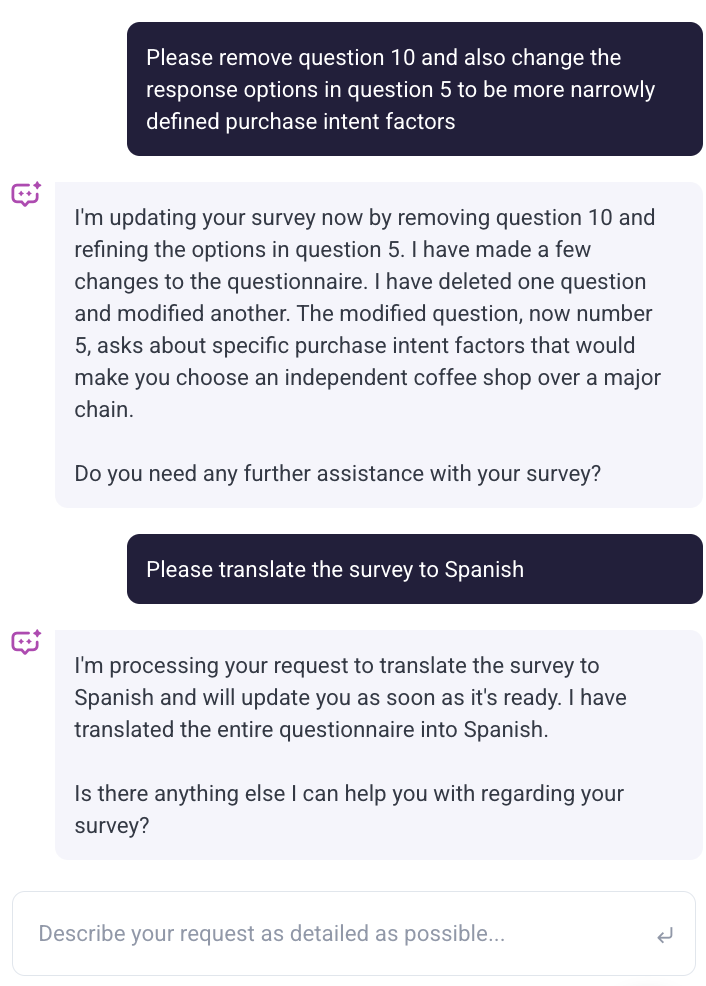
As you can see in the example above, you might ask for tweaks like:
- “Please remove question 10 and also change the response options in question 5 to be more narrowly defined purchase intent factors”
- “Please translate the survey into Spanish”
These are just a few examples — you can make virtually any adjustment you need through a seamless, conversational chat experience.
Apply Advanced Research Methodologies and Question Types (Optional)
Pollfish’s AI Survey Builder supports a variety of advanced research methodologies, including:
- Conjoint Analysis
- A/B Testing
- MaxDiff
- Van Westendorp Pricing Analysis
It also supports a wide range of survey question types, including:
- Single Selection
- Multiple Selection
- Numeric Open-ended
- Text Open-ended
- Rating
- Ranking
- Sliders
Apply Sophisticated Survey Logic (Optional)
You can also use our AI Survey Builder to apply skip logic effortlessly.
For example, you might ask the AI, “Can you set up skip logic so that if someone answers ‘Never’ to Q2 (‘Do you visit independent coffee shops?’), they automatically skip to Q5?”
Our AI will automatically build this logic into your survey, and it’s just as easy to create more complex conditional branching flows through simple conversation.
Conversational AI Feature
Key Benefits of Conversational AI
Pollfish’s Conversational AI feature offers the best of both qualitative and quantitative survey insights:
- Conversational AI is a survey question type that allows real-time, personalized conversations with respondents using AI, helping you capture deep, qualitative insights across large sample sizes.
- It encourages respondents to provide more thoughtful answers, and captures tone, emotion, and nuance that traditional survey questions might miss.
- Delivers interview-quality insights without the expense and logistics of scheduling, moderating, transcribing, and more.
- Automatically analyzes responses and generates actionable reports with key themes and insights.
How It Works
Conversational AI is best suited for questions where the “why” matters more than the “what”.
For example, you might ask: “Walk me through your routine when choosing where to get your morning coffee.”
Instead of getting a simple answer like “I go to the nearest café,” the AI could naturally follow up with questions like:
- “What makes you choose that café over others nearby?”
- “How do factors like price, convenience, or brand loyalty influence your choice?”
- “Can you tell me about the last time you switched coffee shops and why?”
- “How do promotions or loyalty programs affect where you go?”
- “What would make you try a completely new coffee shop instead of your usual one?”
You can learn more about Conversational AI in this article, and read our Conversational AI Help Guide for step-by-step instructions. Our support team is also available to help 24/7 via live chat or over the phone.
Customer Reviews Highlighting Pollfish’s AI Capabilities
Below are reviews from Trustpilot highlighting Pollfish's AI capabilities. To explore our complete collection of customer reviews, click here.
“I’m loving Pollfish’s AI-generated questions — not only are they accurate and time saving, but it even came up with better survey queries than I could have thought of! With a quick poll of 250 respondents in just one working day, targeting my niche market was a breeze. The customer service team is super responsive too for those more complex enquiries about the tool and criteria. All in all this experience has been way easier (and cheaper) than any other ‘big players’ out there.”
– Read the full review here
“A great product with a robust interface that cleverly uses AI to enable the user to create the most efficient and effective survey based on their needs. I’ll be using this regularly moving forward when I need direct market feedback, and fast.”
– Read the full review here
“I rarely give 5 stars, but this one is well worth it. The interface is super easy whether you create it from scratch or use AI and the value is bar none. I had calls with other companies that wanted to charge me 1000’s and take days to complete. Instead, I signed up with Pollfish, created my survey in less than 30 minutes, and had all 100 respondents in a couple of hours. Saved me so much time and money. Worth every penny!”
– Read the full review here
“We had been looking for a pay-as-you-go insights platform and this one didn’t disappoint! Has a ton of capabilities and the AI suggestions are actually helpful.”
– Read the full review here
Other Key Benefits of Pollfish for Market Researchers
Beyond our AI capabilities, Pollfish delivers several other key advantages for effective market research:
- Advanced questionnaire design, audience targeting, and data analysis features, giving you the flexibility to build your survey to your exact specifications without compromise.
- High-quality audiences from Prodege with its rigorous data quality standards, ensuring you can make sound decisions based on your survey results.
- Transparent, pay-per-response pricing so you pay only for the responses you need (no long-term commitments), with no hidden charges or surprise fees.
- Fast turnaround time, with broad population results delivered in just a few hours, and more niche target groups usually fulfilled in as little as a few days.
- Complimentary 24/7 support from market research experts who provide strategic advice on survey design, optimal audience targeting, and data interpretation — not just basic platform navigation questions.
- An intuitive, easy-to-use platform making survey creation fast and accessible for anyone, regardless of their technical expertise.
To learn about the advantages of Pollfish in more depth, read our article on the best survey software for market research.
Interested in Trying Out Pollfish?
Pollfish's AI Survey Builder and Conversational AI features help you create surveys faster and gather rich insights at scale. Our top priority is delivering reliable, high-quality data through first-party audiences and rigorous quality standards, ensuring you receive trustworthy responses from vetted respondents for confident decision-making.
If you’re interested in trying Pollfish, we invite you to:
- Create a free account — no credit card required.
- Inquire about our end-to-end market research services, where our team takes care of the entire research process for you, including survey programming, sample & fielding, data processing & analysis, reporting, and more.

8 Best Concept Testing Platforms (by Category)
8 Best Concept Testing Platforms (by Category)

When businesses search for concept testing platforms, they're typically looking for one of two main categories of tools:
Category #1: Concept Testing Survey Platforms
Survey-based concept testing platforms excel at delivering large-scale, statistically significant data. These platforms offer rapid results, often within hours to a few days, and let you maintain strict control over potential bias through careful questionnaire design. Top concept testing survey platforms include:
- Pollfish: Best for market researchers seeking high-quality survey data with transparent pay-per-response pricing. No subscription fees, annual commitments, or hidden costs. Well suited for companies of any size.
- Qualtrics: Best suited for large enterprise companies, and their pricing is often cost-prohibitive for small and medium-sized businesses.
- SurveyMonkey: Best for simpler survey requirements. While they offer pay-per-response pricing, essential features like skip logic require a subscription plan, increasing your total costs.
Category #2: Concept Testing Platforms Beyond Traditional Surveys
These platforms offer unique methodologies that can complement your survey data and reveal insights you might otherwise miss:
- MESH01: Specializes in concept testing for physical products where hands-on interaction is crucial. They handle recruiting qualified testers and collect comprehensive feedback through activity logs, surveys, image and video uploads, performance zone heatmaps, and real-time product usage data.
- System1: Offers innovative testing methodologies including a predictive trading game where participants buy or sell "shares" in concepts (providing market-like validation), FaceTrace technology that measures genuine emotional responses to visual concepts, and more.
- Highlight: Excels at in-home product testing across diverse use cases, from food and beverage tastings to packaging design validation. For example, they can ship package designs directly to consumers' homes and collect valuable real-world insights that complement your online survey data.
- Hotjar: Enables concept testing through two key features: concept testing questions while users browse your site (for example, after they've spent more than 45 seconds on a specific product page), and end-to-end remote user interviews, including recruiting participants, scheduling sessions, hosting calls, and generating reports.
- Kantar: While they offer a vast range of use cases, their ConceptEvaluate AI platform stands out for rapid concept screening. It can simultaneously test concepts with up to 100 participants, making it valuable for efficiently filtering through multiple concepts in early development stages.
Up next, we'll provide a comprehensive overview of Pollfish, our survey platform that excels at concept testing, followed by an overview of the other concept testing tools on this list.
Category #1: Concept Testing Survey Platforms
1. Pollfish

Pollfish is our DIY survey platform that excels at running monadic tests, sequential monadic tests, and other concept testing methodologies. Our highly intuitive, easy-to-use interface, offers a robust questionnaire design, audience targeting, and data analysis capabilities that seasoned market researchers rely on.
We offer pre-built survey templates designed with market research best practices for product concept testing, pricing testing, logo testing, ad testing, A/B testing, and more. This provides a strategic head start by allowing you to edit proven, ready-made frameworks rather than building everything completely from scratch.
There are 4 key reasons you should choose Pollfish for concept testing:
- Reason #1: High-quality audience panels with rigorous data quality standards.
- Reason #2: Pay-per-response pricing model with complete transparency and no hidden fees.
- Reason #3: Fast turnaround times — from a few hours for broad audiences to a few days for more niche groups.
- Reason #4: Robust functionality across three key areas: audience targeting, questionnaire design, and data analysis.
Let’s dive in.
Reason #1: High-Quality Audience Panels with Rigorous Data Quality Standards
Why is this important? Data quality should be your top priority when choosing a concept testing survey platform. Even a perfectly designed survey will produce unreliable results if respondents are fraudulent or provide low-quality answers, leading to flawed decisions about which concepts to choose or invest in.
Our Approach: At Pollfish, through our parent company Prodege (the world's largest single panel owner), we maintain our own first-party respondent communities rather than purchasing data from external third-party providers.
This direct ownership approach enables us to maintain rigorous quality controls that ensure high-quality concept testing survey results:
❇️ Diverse activities beyond surveys help us verify respondents are real people, not bots: Through communities like Swagbucks, panelists earn rewards not just from surveys but also from activities like playing games, watching videos, or uploading shopping receipts.
These activities serve as authenticity checks — for example, uploading an actual shopping receipt is something only a real person can do, giving us certainty that our respondents are genuine humans rather than bots.
❇️ Shopping receipt uploads enable more accurate targeting than self-reported preferences: When participants upload shopping receipts (e.g., showing they've recently purchased an energy drink), you can precisely target them based on verified purchase behavior.
This is far more reliable than self-reported preferences, where participants might falsely claim they buy energy drinks just to qualify for more surveys.
❇️ 30-day evaluation period: New members undergo a mandatory 30-day evaluation period where they complete internal profiling surveys. We closely monitor their responses, and only participants who consistently provide high-quality responses are approved to take client surveys.
❇️ Manual-review of open-ended responses: Every open-ended survey response is manually reviewed by a human team member to ensure quality and filter out nonsensical or low-effort answers.
❇️ Sophisticated fraud prevention measures, including unique user IDs (to prevent duplicate entries), speeding detection, straight lining detection (repeatedly choosing the same answer), trap questions, anti VPN measures, etc.
The bottom line: By choosing Pollfish for your concept testing survey needs, you can trust that your data is reliable and the decisions you make based on that data are well-founded.
Reason #2: Pay-per-Response Pricing Model with Complete Transparency and No Hidden Fees
❇️ We use a straightforward pay-per-response pricing model, starting at $0.95 per response, with no subscription fees or annual contracts required.
Pollfish scales with your concept testing needs (or other survey needs), so you only pay for the responses you actually collect — never for unused capacity.
❇️ As you build your survey, pricing is always visible in the upper-right corner and updates in real-time as you add targeting filters.
What you see is exactly what you'll pay, with no surprise fees or hidden charges:

❇️ Here's how our transparent pricing calculator works based on the example above:
- Base cost: $0.95 per response
- Three targeting filters are added:
- Marital status → Married (+$0.55 per response)
- Children in household → 2 (+$0.55 per response)
- Pets in household → Dog (+$0.55 per response)
- Total cost per response: $2.60 with these additional filters
- For 500 responses: $1,300 total cost clearly displayed upfront
That's your final cost — no subscription fees, no hidden charges, no surprises.
As one of our customers shared on Trustpilot:
“The dollar amount they quote you in their cost calculator tool, and the number they show when you're developing the survey, is the number you pay. I was burned multiple times by SurveyMonkey charging me unexpected amounts and making it difficult to quit an expensive subscription. I'm so happy to have found Pollfish as an alternative. Their support team also responds VERY quickly to chat messages and has been tremendously helpful the few times I had questions.”
– Read the full review here
Reason #3: Fast Turnaround Times (From a Few Hours for Broad Audiences to a Few Days for More Niche Groups)
Since Pollfish uses first-party audience data from Prodege rather than purchasing from external third-party sources through middlemen, we can deliver exceptionally fast turnaround times.
❇️ For concept testing surveys targeting broad, general population segments, you can receive results in as little as a few hours for several hundred responses.
As multiple reviewers have noted on Trustpilot:
“The thing that amazes me most is how quickly you can get your data results back. So fast! Usually in a couple of hours.”
– Read the full review here“I needed a 25 question survey answered, and was able to get 500 completed surveys in 8 hours with Pollfish. The presentation of the results is very impressive and the demographics information Pollfish provided is invaluable.”
– Read the full review here“I honestly thought the results would take days, and I was starting to get worried because I was using Pollfish for a quarterly goal and I was trying to make it before the deadline. However, I received the results in literally just a few hours!”
– Read the full review here“Much more affordable than all the alternatives I found, and I had all my results ready within just a couple of hours.”
– Read the full review here
❇️ For more specific targeting requirements, completion typically takes several days (e.g., household income over $250,000, live in New York, and own a dog).
This is still exceptionally fast compared to other platforms for similar audiences. As several reviewers have noted:
“I'm amazed at how quickly the platform was able to deliver rich, segmentable data from over 500 respondents. I had feature-ready insights in only 3 days.”
– Read the full review here“I've used Pollfish before so when I needed to test concepts for a new business pitch in 5 countries over the holiday, I turned to Pollfish. The surveys were easy to set up, allowed me to select my very specific target and launched right away. Within a couple of days I had my results in an easy to interpret, actionable format well within my budget.”
– Read the full review here“I found the platform super-easy to use and we received feedback on our new name and logo from our target audience within a few days.”
– Read the full review here
For specific turnaround time estimates based on your unique audience requirements, please contact us here, or submit your question via live chat. We’re available to help 24/7.
Reason #4: Robust Functionality Across 3 Key Areas (Audience Targeting, Questionnaire Design & Data Analysis)
Robust functionality across audience targeting, questionnaire design, and data analysis is critical:
- If you can't precisely target your ideal audience, you'll test concepts with the wrong people, and act on flawed insights.
- If your questionnaire design capabilities are limited, you won't be able to create sophisticated concept testing surveys with proper A/B testing structures, branching logic, and the diverse question types necessary to capture high quality data.
- If your data analysis tools are lacking, you won't be able to identify the nuanced patterns and demographic differences that reveal which concepts truly resonate with your target market.
Up next, we’ll discuss Pollfish’s key features and capabilities across these three areas.
❇️ Audience Targeting

With Pollfish, you can choose from 50+ targeting filters across 6 categories: Demographics, Geographic Criteria, Consumer Lifestyle, Employment & Occupation, Behavioral Data, and Media.
While most customers use only a subset of the below options, here's the complete range of targeting filters available to ensure you reach exactly the right audience for your concept testing surveys:
❇️ Demographics
Age, Gender, Hispanic Origin, Marital Status, Languages Spoken, Education Level, US Voter Registration, Household Income (US), Age & Gender of Child(ren) in Household, Type of Home, Pets in Household, Political Party Support, Hispanic Level of Acculturation, Parental Status / Pregnancy Status, Race, Device Type, Device Operating System (OS), Ethnicity, Number of Children in Household
❇️ Geographic Criteria
US State, US Division, US DMA, US Region, US Statistical Area (CBSA), US County, US Zip Code
❇️ Consumer Lifestyle
Beverage Consumption, Hobbies & Interests, Sports Participation, Gambling Participation, Music Streaming Services Use, Movie Theater Frequency, Home Movie Viewing Frequency, Video Game Participation, Video Game Consoles, Video Game Genres, Travel by Air for Business/Leisure, Vehicle Make/Brand Own or Lease, Vehicle Type Own or Lease, Health Ailment Diagnosis
❇️ Employment & Occupation
Employment Status, Industry Work In, B2B Department, Number of Employees, Job Title
❇️ Behavioral Data
Brands Purchased (In-Store), Online Shopping: Retailer, In-Store Shopper, Category Buyers, Retail Channels Shopped (In-Store), Websites Visited, Retail Channels Shopped (Online)
❇️ Media
Video Streaming Services Used
❇️ Custom Quotas

You can set custom quotas with ease to prevent bias in your survey results, whether across age groups, gender, income levels, or any other criteria you choose.
❇️ Questionnaire Design

No matter how robust or sophisticated your concept testing questionnaire needs to be, Pollfish provides the tools you need:
❇️ 16 question types, including Single selection, Multiple selection, Open ended, Numeric open ended, Description, Rating stars, Slider, Ranking, Matrix single selection, Matrix multiple selection, Net Promoter Score (NPS), A/B test, Conjoint analysis, Max Diff, and Van Westendorp.
❇️ AI survey creation: Quickly create concept testing surveys by simply describing your research goals.
For example, you can prompt the AI with "I want to test 3 packaging designs for a new food product" and it will automatically generate appropriate questions, logic flows, answer options, and more.
❇️ Multimedia questions: Insert video or image-based concept visuals (e.g., product mockups, packaging designs, logos, ad ideas, etc.) directly into your survey questions, with the option to require full video viewing before respondents can proceed.
❇️ Answer shuffling: Automatically randomize answer choices to eliminate bias.
For example, when testing three logo concepts, Pollfish ensures each logo appears in different randomized positions (preventing the first option from being unfairly selected more often due to primacy bias).
❇️ Screening questions: Add screening questions to automatically filter out participants based on their responses.
For example, when testing a new energy drink concept, you can ask "How many energy drinks do you consume per week?" and automatically filter out anyone who responds with less than 2, allowing only qualified prospects who consume 2+ energy drinks weekly to proceed with your survey.
❇️ Conditional branching: Create dynamic survey paths based on previous responses, allowing you to show different concepts or follow-up questions depending on participant answers.
For example, if someone identifies as a "frequent online shopper," they see e-commerce app concepts, while "in-store shoppers" are shown retail experience concepts instead.
❇️ Explore the full range of Pollfish’s survey design capabilities.
❇️ Data Analysis
Pollfish makes it easy to collect and filter the data to get the insights you need, eliminating the need for external tools like Excel. We offer:
❇️ Demographic filtering: Analyze how different concepts perform across specific audience segments.
For example, see how millennials vs. baby boomers respond to your packaging designs, or compare male vs. female reactions to your ad concepts.
❇️ Response-based filtering: Drill down into specific feedback patterns by filtering responses.
For example, focus only on participants who rated a concept as "very appealing" to understand what drove their positive reaction.
❇️ Advanced insights builder: Create complex multi-variable analyses and charts without Excel.
For example, if you ran a concept test and wanted to analyze feedback from "males who live in the Northeast and Midwest, who are married, and who rated concepts as extremely believable," you can simply drag and drop these variables and generate instant charts with just a few clicks.

❇️ Statistical significance testing: Automatically identify which concept performance differences are statistically significant.
❇️ Charts in your brand colors: Customize each chart with your company's brand colors automatically, eliminating the time you'd otherwise spend manually formatting charts in external design tools.
❇️ Built-in PowerPoint creation: Create complete PowerPoint slide decks directly within Pollfish while analyzing your data to streamline your workflow.
❇️ Flexible export options: Export your survey results and charts in multiple formats, including PDF, Excel, crosstabs, SPSS, and more.
Sign Up for a Free Pollfish Account
Create your free Pollfish account today — no credit card required, no commitments — and start building your first concept testing survey in minutes with our easy-to-use, intuitive interface.
2. Qualtrics

Qualtrics is best suited for large enterprise companies, and their pricing is often cost-prohibitive for small and medium-sized businesses.
Our article on Qualtrics alternatives elaborates on how Pollfish stands apart, including higher quality survey data, flexible pay-per-response pricing structure (rather than being locked into a long-term commitment), stellar customer service, and more.
Qualtrics’ features can be divided into 3 categories:
1. Customer Experience
- Voice of Customer
- Omnichannel Experience Management
- Digital Experience Analytics
- Website & App Feedback
- Location Experience Hub
- Online Reputation Management
- Contact Center Analytics
- Quality Management & Compliance
- Agent Coaching
- Edge Instant Insights
2. Employee Experience
- Employee Engagement
- Employee Pulse
- Employee Research
- Candidate Experience Management
- Employee Onboarding & Exit
- 360 Development Feedback
- Employee Retention Analytics
- Continuous Employee Listening
3. Strategy & Research
- Strategic Market Research
- Product Research
- Brand and Communication Research
- User Experience Research
- Edge Audiences
3. SurveyMonkey

As mentioned, SurveyMonkey suits simpler survey needs. Our article on SurveyMonkey alternatives elaborates on how Pollfish stands apart, offering advantages like more affordable pay-per-response pricing for all question types, superior survey data quality, and the inclusion of most premium features without requiring a subscription upgrade.
Some of SurveyMonkey’s key features and capabilities include:
- Customizable survey design features, although crucial ones like skip logic are only available with a subscription.
- Ability to target SurveyMonkey’s vetted, pre-recruited respondents.
- Built-in analysis capabilities, including tools like Word Cloud, which automatically identify common themes and phrases from open ended questions.
- Diverse concept testing methodologies, including logo design testing, name testing, package testing, or message & claims testing.
Category #2: Concept Testing Platforms Beyond Traditional Surveys
4. MESH01

MESH01 specializes in concept testing for physical products where hands-on interaction is crucial. They handle recruiting qualified testers (70,000+ person testing community) and collect comprehensive feedback through:
- Activity logs
- Surveys
- Image and video uploads
- Performance zone heatmaps
- Real-time product usage data
They offer unique industry insights and reports, such as The State of Product Testing and Product Testing Program Trends.
5. System1

System1 offers innovative concept testing methodologies, and some of their key solutions and capabilities include:
- Predictive trading game where participants buy or sell "shares" in concepts (providing market-like validation).
- 1–5 Star Rating system with validated predictive power — 5-Star concepts typically achieve triple the sales of 1-Star concepts.
- FaceTrace technology that measures genuine emotional responses to visual concepts and new products.
- Database of 54,000+ concepts to benchmark your performance against.
- Comprehensive ad testing tools.
Overall, it’s a great platform to help optimize product development and concept testing.
6. Highlight

Some of Highlight's key solutions and capabilities include:
- At in-home product testing across diverse use cases, from food and beverage tastings to packaging design validation, and many other product ideas.
- Quick-touch pulse surveys, with access to a large community of product testers and live data dashboards, as well as the ability to choose a specific target audience, design your questionnaire, field results, and gain actionable insights in a matter of hours.
- MaxDiff testing, TURF testing, and other methodologies.
The key industries Highlight serves include Food, Beverage & Supplements, Personal Care & Beauty, Alcohol (RTD, Beer, Liquor, Mocktail), Kids Products, Pet Care & Accessories, Household Cleaning & Goods, and Apparel Footwear.
7. Hotjar

As it pertains to concept testing, some of Hotjar’s key offerings and capabilities include:
- Hotjar Surveys: Trigger concept testing surveys while users browse your site (e.g., after users spend 30 seconds on the pricing page). You have multiple survey deployment options, including pop-ups, buttons, bubbles, embedded widgets, full-screen overlays, and more. Hotjar also offers pre-built templates and AI survey creation to speed up the process.
- Hotjar Engage: Handles end-to-end remote user interviews, including recruiting participants, scheduling sessions, hosting calls, generating reports, and more. They offer a diverse pool of 200,000+ participants from 130+ countries and 25 industries, though you can also interview your own customers.
8. Kantar

While Kantar offers a vast range of uses, their ConceptEvaluate AI platform stands out for rapid concept screening:
- You can simultaneously test concepts with up to 100 participants, making it valuable for efficiently filtering through multiple concepts in the early development process.
- Their survey-based AI model has been trained on over 39,000 concepts, so you have more confidence you’re making informed decisions.
- You can receive feedback and results in as little as 24 hours.
- Some of the key metrics they track include Predictive Trial, Predictive Uniqueness, and Predictive Relevance, which help increase your decision-making confidence.
- You can choose from two options, both of which increase in cost as you test more concepts:
- Self-Serve: Pricing starts at $360.
- Serviced by Kantar: Pricing starts at $5,500.
Overall, Kantar is a great platform to streamline concept development, and offers various unique research methods.
Sign Up for a Free Pollfish Account
Create your free Pollfish account today (no credit card required, no commitments) and start building your first concept testing survey in minutes with our easy-to-use, intuitive interface.

3 Survey Data Quality Issues Sabotaging Your Research (& How We Fix Them)
3 Survey Data Quality Issues Sabotaging Your Research (& How We Fix Them)

When conducting market research, data quality is the most critical factor. While that might sound obvious, it’s often not given enough consideration.
Even with a meticulously designed survey — solid logic, good flow, and bias controls — if respondents are fraudulent (e.g., bots) or rushing to finish, the data is flawed. This can lead to costly mistakes and damage credibility with leadership.
In this article, we’ll cover:
- 3 critical survey quality issues
- Issue #1: Bots posing as real respondents or survey farms (fraud caused by a network of real humans), contaminating data with fraudulent responses
- Issue #2: Respondent profiles and demographic information may become inaccurate over time, even if initially true
- Issue #3: Respondents providing low-quality, rushed, or contradictory answers
- How Pollfish, through our parent company Prodege — the world’s largest single panel owner — combats these issues via first-party panel ownership and the robust, multi-layered data quality safeguards we have in place.
Issue #1: Bots posing as real respondents or survey farms, contaminating data with fraudulent responses
The Problem
Survey fraud can be divided into 2 broad categories:
- Bots – Sophisticated automated scripts, or "bots," masquerade as genuine respondents. These bots may originate from click farms or individuals in various countries attempting to conceal their true location and pose as legitimate participants from target markets like the US.
- Survey Farms – Fraud caused by networks of real humans who register for multiple panelist accounts and attempt to complete as many surveys as possible while avoiding detection. Members of these networks pay a portion of any survey earnings to the owners of the websites where they go to learn the latest tricks to distinguish their location (e.g., using a legitimate IP address to mask their own) and how to create multiple accounts and qualify for surveys.
Our Solution
Prodege has an in-house, 40-person Panel Support, Security and Compliance Department which continually innovates and stays one step ahead of survey fraud. Some of the quality controls and processes we implement include:
❇️ Verifying Respondent Identities Through Diverse Activities Beyond Surveys
Many panels simply have people log in, answer surveys, and get paid without tracking any other behaviors. In contrast, through Prodege's flagship communities like Swagbucks, members can earn rewards not only from completing surveys but also by playing games, shopping online, uploading supermarket receipts, and more.
These additional activities provide valuable data points to verify respondent identities and build out fuller profiles. For example, if someone uploads a unique shopping receipt image, it confirms they are a real human as a bot couldn't replicate this behavior.
❇️ 14-Day Evaluation Period
Before a new panelist becomes eligible to participate in their 1st client survey, they must complete a number of internal quality measurement surveys over their first 14 days on the panel.
Panel members failing to meet our quality thresholds are removed from the panel. After the initial evaluation period, we continue to administer these surveys at random points in a member's panel lifespan.
❇️ Trust Scores
We’ve developed a proprietary solution leveraging AI plus machine learning, where each member is assigned a “Trust Score” shortly after registering for one of our panels. This score is updated based on ongoing inputs.
Based on the Trust Score, we may deactivate a member’s account, block entry to surveys and/or require additional identity verification (e.g., scan driver’s license).
❇️ Fraud Detection Technologies
This includes multi-level registration verification (e.g., CAPTCHA, Device ID Reputation, 100% Double Opt-In, etc.), tech consistency (carrier/targeting alignment check), single user IDs (no duplicate survey takers), sophisticated anti-VPN measures, etc.
Issue #2: Respondent profiles & demographic information may become inaccurate over time, even if initially true
The Problem
While some survey participants might intentionally misrepresent their demographics from the start, a more common issue is that respondent profiles naturally become outdated as individuals' circumstances and interests change over time.
This gradual drift can lead to inaccuracies in the data, even when participants provide honest answers during the initial profile setup.
Consider this scenario: A participant who initially reported being single may get married and have children but fail to update their marital status and parental information in their profile. Consequently, they may be incorrectly included in or excluded from surveys based on these factors.
The challenge for survey platforms lies in ensuring that participant profiles remain accurate and up-to-date, not just at the point of creation but also throughout the respondent's lifecycle. Failing to do so can lead to skewed survey results, misallocated targeting efforts, and ultimately, flawed insights that misinform critical business decisions.
Our Solution
❇️ We go beyond relying on self-reported information by leveraging behavioral data. By analyzing purchase receipts and websites visited, we can identify potential mismatches between a participant's claimed profile and their actual behavior.
For instance, a participant may initially report being single and not having any children. However, if we observe a sudden and consistent increase in purchases related to baby products such as diapers, formula, or child safety equipment (through purchase receipt data), our system may flag this profile for potential updates to parental information.
Our ability to leverage behavioral data for demographic validation is made possible by Prodege's unique position as a company that owns and maintains its consumer communities directly. This stands in stark contrast to most survey platforms, who rely on third-party audience panels (a critical distinction we'll explore further in a later section).
Issue #3: Respondents providing rushed, low quality, or contradictory answers
The Problem
Even when a respondent is verified as a real person, the quality of their survey responses may still be lacking. This can manifest in several ways:
- Speeding and straight-lining: If a survey is designed to take 5 minutes on average, but a respondent completes it in 30 seconds, it raises serious doubts about their level of attention and engagement. Also, some respondents may simply select the same answer choice repeatedly (e.g., always choosing "B" on multiple-choice questions) without actually reading the questions.
- Low-quality open-ended responses: When presented with open-ended questions that require written input, some respondents may provide brief, irrelevant, or nonsensical answers rather than investing the time and effort to share meaningful insights.
- Contradictory answers: Respondents who are not fully engaged or attentive may provide inconsistent or contradictory responses throughout the survey. For instance, they might indicate they've never used a particular product, but later claim to have purchased it within the past month.
- Disengaged respondents: These are real humans with good intentions who on occasion may be multitasking (e.g., watching a movie or cooking while taking a survey), and thus submit lower quality responses.
Our Solution
❇️ Speeding detection: Our system monitors the time respondents spend on each question and flags those who complete the survey significantly faster than the average, indicating a lack of thoughtful engagement.
❇️ Straight-lining detection: We identify respondents who repeatedly select the same answer choice for multiple questions in a row.
❇️ Manual review of open ended responses: We strongly recommend including at least one open-ended question in every survey as an additional quality check. Our dedicated Project Management Team meticulously reviews these responses and removes and replaces any respondents who provide low-quality answers, such as:
- Random characters or irrelevant text.
- Overly brief answers where a detailed response is warranted.
- Answers that do not make sense given the context of the question.
- Any other indicators of poor engagement or lack of effort.
❇️ Red herring questions: We strategically insert our own "red herring" questions throughout the survey, designed specifically to check for contradictory answers and ensure respondents are paying attention.
❇️ And so much more.
Unique Advantage of Prodege: Staff of Research Experts Who Were End-Users of Data in Their Previous Roles
An additional unique advantage of Prodege versus traditional sample suppliers and audience monetizers is that we have a staff of research experts who were end-users of data in their roles at companies such as Hall & Partners, Ipsos, Kantar, Lieberman Research, Nielsen and NPD.
The team's experience preparing reports and dashboards to deliver insights to enterprise clients is layered into Prodege's research best practices, bringing a perspective to data quality missing at other sample firms.
The Bottom Line: Pollfish Delivers Reliable Data
Pollfish's unique approach, which leverages first-party data from Prodege, enables us to implement robust quality control measures and recruit a representative and engaged member base.
As a result, when you use Pollfish, you can trust that you're receiving the highest caliber of survey responses. As several of reviewers have noted on Trustpilot:
"The most important point to make is that I trust the responses of my survey. My target audience was very specific and I could tell that the responses were legitimately coming [from] subjects in my target audience.”
– Read the full review here
“Each time I use this service I am blown away by the speed with which the responses come in and with the detail which most of them include. You can tell that the respondents take this very seriously. They must really enjoy doing it.”
– Read the full review here
“I had to get some data on a product in a tricky sector. It was proving challenging to attract participants to my study. I was able to quickly get results and some insights to be able to move forward with my work using Pollfish.”
– Read the full review here
“I was very satisfied with the results I got from Pollfish. My company was conducting market research and received very insightful help from consumers who were all verified homeowners.”
– Read the full review here
Note: Click here to explore additional Pollfish reviews on Trustpilot.
Interested in Learning More About Pollfish?
Beyond exceptional data quality, Pollfish offers several other key benefits:
- Pay-per-response pricing model, starting at $0.95 per response – no subscriptions, no long term commitments, just pay for what you actually use.
- Transparent pricing: As you build your survey, you'll see the total price update in real-time (it's clearly visible in the upper-right-hand corner, and we don't hide it). What you see is exactly what you'll pay, and there are no surprise charges.
- Quick turnaround time, with general population surveys completed in just a few hours and more specialized audience surveys within a matter of days.
- Comprehensive suite of features, including sophisticated questionnaire design, audience targeting, and data analysis capabilities, to support even the most complex survey research needs.
For more details on the advantages of Pollfish and guidance on choosing the best DIY market research survey tool for your needs, refer to this article.
In addition, for details regarding Prodege’s done-for-you market research service offering, reach out here.
Create a Free Pollfish Account Account or Book a Demo
We invite you to:
- Create a free Pollfish account, no credit card required.
- Book a demo call, where we’ll provide a personalized walkthrough of our platform and answer any questions you may have.
6 Brand Research Platforms: Types & When to Use Each
6 Brand Research Platforms: Types & When to Use Each

In general, brand research platforms can be categorized into three main types:
- Survey tools, which are ideal for collecting quantitative data from large sample sizes to gain insights into overall brand perceptions, purchase behaviors, brand awareness levels, and more.
- Social listening tools, which let you monitor and analyze brand mentions, sentiment, and organic conversations happening on social media platforms.
- Direct customer feedback tools (interviews, focus groups, in-home product testing, etc.), which provide rich qualitative insights by engaging with customers 1-on-1.
In this post, we cover 6 brand research platforms — each with its own unique strengths and focus areas:
- Pollfish: Our survey-focused DIY tool offering quick turnaround times, transparent pay-per-response pricing, and access to diverse, high-quality respondent pools.
- Qualtrics: A survey-focused tool with pricing and features more suited for larger enterprise companies.
- Kantar: Pricing geared towards enterprise companies. Best known for their full-service brand research consulting offerings, which combine surveys with additional research approaches.
- Brandwatch: Specializes in social listening and tracking brand mentions on social media platforms.
- Suzy: While they offer surveys, a standout feature is Suzy Live, which lets you conduct 1-on-1 interviews, focus groups, and in-home product testing all within one platform.
- GWI: While they offer surveys, you can also get synthetic data via GWI Spark, an AI assistant that answers questions about your audience using GWI's global survey data. This provides more accurate insights compared to searching the web.
1. Pollfish
Pollfish is our user-friendly, DIY survey solution that companies of all sizes use to conduct brand research. (We also offer end-to-end market research services through our parent company Prodege.)
In the sections below, we'll cover:
- How to run brand research surveys using Pollfish in three steps: Design your questionnaire, select your survey audience, and analyze your data.
- The advantages of Pollfish's first-party respondent communities: Access higher quality audiences and survey responses compared to competitors who purchase respondents from external third-party panels.
- Pollfish's transparent, pay-as-you-go pricing model: Our pricing model offers greater affordability than competitors who charge subscription fees.
- The quick turnaround times you can expect from Pollfish: Turnaround times range from just a few hours for mainstream audiences to a few days for more niche audiences.
3 Simple Steps for Running Brand Research Surveys with Pollfish
Running brand research surveys with Pollfish's market research survey tool involves three key steps:
- Step 1: Design your questionnaire — Start with brand research survey templates or create a survey from scratch. Choose from 14 question types and take advantage of advanced features like screening questions, conditional branching based on previous responses, answer shuffling, and much more.
- Step 2: Select your survey audience — No matter how broad or niche you want your audience to be, Pollfish can accommodate your needs with 50+ audience filters to choose from.
- Step 3: Analyze your data — Easily visualize and manipulate your survey data within our platform to gain the insights you need, rather than having to export to Excel.
Pollfish excels in these areas, allowing you to conduct brand research without compromising your objectives or methodology due to platform limitations.
Now, let's take a closer look at each of these steps.
Step #1: Design Your Questionnaire
Although not a complete list, the following are some of our most frequently utilized questionnaire design features:
❇️ Brand Research Templates
While you can create surveys from scratch, many choose to utilize brand research survey templates with pre-written questions that can be customized as needed.
These templates offer 3 benefits:
- Save time by providing a starting point for your survey.
- Employ methodological best practices to ensure high-quality data collection.
- Ensure consistency across surveys, allowing you to benchmark changes over time and easily compare data from past surveys.
Popular templates include:
- Brand Awareness Template: Assess whether consumers are familiar with your brand or have heard of it at a minimum.
- Brand Perception Template: Understand how your brand is perceived compared to competitor brands.
- Brand Diagnostic Template: Evaluate your brand's overall health at a specific point in time.
- CPG Brand Awareness + Perceptions Template: Measure consumer familiarity and perceptions of Consumer Packaged Goods (CPG) brands
❇️ 16 Question Types
No matter which type of questions you want to use for your brand research questionnaire, Pollfish has you covered with 16 question types, including: Single selection, Multiple selection, Open ended, Numeric open ended, Description, Rating stars, Slider, Ranking, Matrix single selection, Matrix multiple selection, Net Promoter Score (NPS), A/B test, Conjoint analysis, Max Diff, and Van Westendorp.
- Screening Logic: Filter out participants who don't meet specific criteria.
- Example: If a respondent answers "No" to the question, "Are you aware of [Brand X]?", you can route them to the survey's conclusion page. If they select "Yes," you can display follow-up questions about [Brand X]'s perceived quality.
- Conditional Branching: Create personalized survey paths based on respondents' answers, presenting them with tailored follow-up questions.
- Example: In a smartphone preference survey, ask participants what they prioritize most when selecting a device (battery life, camera quality, or brand reputation). Using conditional branching, direct them to different question sets based on their selected priority.
- Answer Shuffling: Randomize the order of answer choices presented to each respondent to minimize order bias.
- Example: When asking respondents to rank their favorite soda brands, one respondent might see "Coca-Cola, Fanta, Sprite," while another sees "Sprite, Fanta, Coca-Cola." This minimizes bias from respondents consistently favoring options at the top or bottom of the list.
❇️ "Other" and "None of the Above"
When creating brand research surveys, you'll often need to include "Other" or "None of the above" as answer choices. Instead of wasting time manually adding these options to each question (a notoriously frustrating task for market researchers), you can automatically add these answer options to each question with just a few clicks.
❇️ Click here to see the full list of advanced questionnaire design features.
Step #2: Select Your Survey Audience
Regardless of how broad or niche your desired audience may be, Pollfish's market research software can help:
❇️ Choose from 50+ audience filters in 6 categories, including: Demographics, Geographic Criteria, Consumer Lifestyle, Employment & Occupation, Behavioral Data, and Media.
For example, you could target millennial female grocery shoppers in Los Angeles between 29–44 years old with household incomes exceeding $50,000 who have recently purchased cold cereal.
❇️ Target shoppers who have bought specific brands or visited certain stores: Rather than broadly targeting "cold cereal" buyers, you can refine your audience to include those who have purchased specific brands like Cheerios, Frosted Flakes, Reese's Puffs, etc.
Similarly, you can target shoppers of particular stores such as Whole Foods, Zara, Costco, etc. This data is sourced from self-uploaded receipts by panel members, ensuring greater accuracy compared to potentially exaggerated self-reported information.
❇️ Set audience quotas: Avoid skewing results with an imbalanced sample by setting audience quotas. For instance, you can require 50% of respondents to be Millennials (ages 29–44) and 50% to be Gen X (ages 45–60).
These are just a few of the audience targeting capabilities available within Pollfish.
Step #3: Analyze Your Survey Results

Pollfish's survey tool simplifies the process of visualizing survey results, manipulating and filtering data, and obtaining insights, all within a single platform, eliminating the need for external data analysis tools like Excel.
❇️ Visualize Survey Results in Various Formats
For each survey question, easily visualize the data using color-coded charts, graphs, tables, and more.
❇️ Filter by Specific Audience Segments or Responses
If you want to display survey results from a specific age group (e.g., millennials aged 29–44) or zero in on particular responses (e.g., only those who are "highly likely" to recommend your brand), you can do so with just a few clicks. All charts and visualizations will automatically update to reflect the filtered data.
❇️ Filter and analyze data by multiple variables simultaneously
Suppose you wanted to compare purchasing intent across 4 different demographics, such as age, gender, household income, and geography, you could easily filter, splice, and dice the data to get the exact answers you need. Pollfish also automatically generates graphs based on your selected variables, eliminating the need to export the data to third-party tools.
❇️ Customize Charts to Match Your Branding
You can customize each graph to fit your brand's color scheme. For example, if your brand colors are yellow (#FFFF00) and red (#FF0000), you can easily apply these colors to the graphs.
❇️ Statistical Testing
Suppose you ran a survey to compare brand awareness between two age groups: 29–44 and 45–60. The results reveal that 75% of respondents aged 29–44 know your brand, while only 60% of those aged 45–60 do. You have the option to turn on stat testing to check if this difference is statistically significant.
Pollfish will automatically highlight the results in a graph, which you can export using standard statistical notation, with capital and lowercase letters indicating the significance level.
❇️ Create Presentations within the Platform
Build presentation slides within Pollfish while your survey is still in the field, allowing you to have a nearly complete report by the time the survey is finished. Export the presentation into an editable PowerPoint file for further customization.
❇️ Export Data in Multiple Formats
Easily export your survey data to PDF, Excel, crosstabs, and SPSS, depending on your needs.
These are just a few of the data analysis capabilities available within Pollfish.
Advantages of Pollfish's First-Party Respondent Communities
Pollfish's proprietary first-party respondent panels (owned and operated through parent company Prodege) ensure high-quality survey responses. This sets us apart from competing market research companies who purchase survey respondents from external third-party providers. Here's how:
❇️ Genuine Human Participants, Not Bots
Our panelists participate in a range of activities within the Prodege ecosystem, from online shopping and receipt uploads to gaming, web browsing, and more. These are all activities bots simply cannot perform, ensuring that your survey audience consists of genuine, verified human participants.
In contrast, many 3rd party providers limit respondents' activities to surveys alone, which often leads to bots and fraudulent responses.
❇️ Panelists Aren't Bombarded with Constant Survey Invites
Our panelists choose when to take surveys at their discretion. This approach attracts more engaged, higher-quality respondents. It stands in stark contrast to 3rd-party providers who blast respondents with emails and text messages to participate, leading to survey fatigue, disengagement, and lower quality responses.
❇️ 30-Day Evaluation for New Panelists
New respondents must complete a 30-day evaluation period, answering internal profiling surveys. Those who fail to meet our stringent quality standards are filtered out, ensuring only the most reliable participants make it to your surveys.
❇️ Rigorous Anti-Fraud Measures
Pollfish includes unique user IDs (prevents duplicate survey takers), trap questions, speeding prevention, anti-VPN measures, gibberish detection, straight-lining detection (detects if folks repeatedly select the same answer), and human review.
❇️ Trust Scores Encourage High-Quality Responses
Pollfish assigns each respondent a "trust score" based on the quality of their survey responses over time. Panelists with higher trust scores gain access to more survey opportunities and other lucrative activities within the Prodege ecosystem.
These are just a few ways Pollfish ensures the highest-quality respondents for your brand research needs. This is crucial because even the most meticulously crafted survey will yield compromised results if your respondent pool contains bots or participants who rush through responses without careful consideration.
Transparent, Pay-per-Response Pricing Model
Companies of all sizes benefit from our transparent, pay-per-response pricing model:
❇️ Usage-Based Pricing
Unlike some competitors who charge hefty monthly or annual subscription fees (which may result in paying for unused capacity), Pollfish charges based on the number of responses you'd like to receive. This ensures that you only pay for what you use.
❇️ Unlimited Team Members
With Pollfish, you can add unlimited team members to your account without incurring any extra costs. In contrast, subscription-based tools often charge for additional licenses, which can quickly add up.
❇️ Transparent Pricing with No Hidden Fees
At Pollfish, the price displayed is exactly what you pay, with no unexpected charges.
For example, suppose you want to run a brand perception survey for your dog food company. You start with a base cost of $0.95 per response. Then, you can choose to add audience targeting filters.
For instance:
- Targeting households with an income over $200,000 would add $0.55 per response
- Targeting dog owners would add another $0.55 per response
In this scenario, the cost per response would be $2.05. If you need 600 responses for your survey, the total cost would be $1,230.
That's precisely what you would pay — no surprises, no hidden fees.

Fast Turnaround Time: From Several Hours to a Few Days
We take pride in delivering exceptionally fast turnaround times, made possible by our proprietary first-party respondent communities.
❇️ General Population Surveys (Mainstream Topics)
For surveys targeting mainstream audiences (such as streaming service subscribers, frequent takeout orderers, pet owners, etc.), we can often gather 500+ responses within just a few hours.
❇️ Niche or Highly Targeted Audience Surveys
When surveying niche audiences (such as aerospace engineers, board-certified dermatologists, etc.), the inherently smaller populations and fewer qualifying respondents typically result in a turnaround time of a few days. However, the exact timeline varies based on the specificity of your criteria.
Have questions about the turnaround time for your specific audience? We'd be happy to help — please reach out to discuss your specific needs.
Get Started with Pollfish
To begin using Pollfish, you have three options:
- Create a free account to explore the platform and start creating your own surveys right away.
- Schedule a demo walkthrough to learn how Pollfish can support your specific brand research objectives.
- Inquire about our full-service brand research option, where our experienced team will manage your entire project from start to finish. This includes crafting the survey, identifying and targeting your ideal audience, analyzing data, and delivering a customized report tailored to your unique needs and objectives.
2. Qualtrics
Qualtrics is a platform geared towards larger enterprises, with pricing to match. In contrast, Pollfish offers a more accessible and cost-effective solution that's well-suited for businesses of all sizes.
To help you understand the key differences between Pollfish and Qualtrics, we've conducted an in-depth analysis that covers crucial aspects such as data quality, pricing, customer support, and more.
3. Kantar

Kantar is primarily geared towards serving enterprise clients. While they offer DIY options, their core focus is on providing strategic consulting and full-service research solutions.
Kantar has a strong specialization in brand research and strategy. Some of their key brand-focused offerings include:
- BrandDynamics (brand tracking)
- BrandEvaluator (brand equity measurement)
- BrandSnapshot powered by BrandZ (brand equity snapshot)
- BrandCampaign (creative mix optimization)
4. Brandwatch

Brandwatch can help you gain valuable consumer insights beyond traditional methods like surveys and focus groups. Here are some of its key features and benefits:
- Monitor when people mention your brand name across various online channels, including social media platforms, news outlets, popular broadcast sources, and more.
- Identify which keywords and hashtags are trending in relation to your brand. For example, discover that there were 350 mentions using the hashtag #ecofriendly for your brand in a specific time period. This information can help you make more informed decisions.
- Perform a historical trend analysis to see how topics related to your brand have evolved and gain actionable insights.
- Compare your brand's online presence and social media engagement with your competitors through social consumer research.
5. Suzy

While Suzy offers survey capabilities, what truly sets it apart is its qualitative research functionality. A particular standout feature, Suzy Live, provides an all-in-one market research platform where you can facilitate:
- One-on-one interviews
- Focus groups for collaborative discussions
- In-home product testing with real-time feedback
6. GWI

GWI provides survey capabilities, but one of its most distinctive features is GWI Spark, an AI-powered assistant. GWI Spark utilizes the company's extensive global survey data to precisely answer questions about your target audience, delivering more accurate insights than those obtained through web searches.
Furthermore, GWI offers a wide range of data sets covering various demographics and consumer behavior patterns in areas like sports, gaming, travel, automotive, consumer technology, luxury goods, and several others.
Get Started with Pollfish
To begin using Pollfish: