8 Best Survey Panel Providers in 2026 (by Category)
8 Best Survey Panel Providers in 2026 (by Category)

Not all survey panel providers and companies work the same way. They generally fall into two categories:
Category #1: Dedicated Panel Providers
These specialize in connecting researchers with pre-recruited respondents across diverse demographics and geographies. One key thing to check: do they own their panels directly or act as a middleman connecting you to third-party panels? This distinction significantly impacts data quality, cost, and reliability.
For this category, we’ll discuss:
Category #2: Survey Platforms with Built-In Access to Panels
They’re primarily known for their DIY survey tools, but also provide direct or secondary access to panels.
For this category, we’ll discuss:
Understanding which category a provider falls into helps you evaluate what you're getting: a dedicated panel infrastructure, a survey tool with panel access, or in some cases, both. We'll break down each company below.
Note: Prodege (Pollfish's parent company) operates the largest consumer panel in the US, with 100M+ respondents and additional panels in 60+ countries. Book an introductory call to learn how our panel quality and sourcing transparency compare. For a DIY approach, sign up for a free Pollfish account. Pollfish is powered by Prodege's first-party panel, so you get the same respondent quality in a self-serve format.
Category #1: Dedicated Panel Providers
1. Prodege
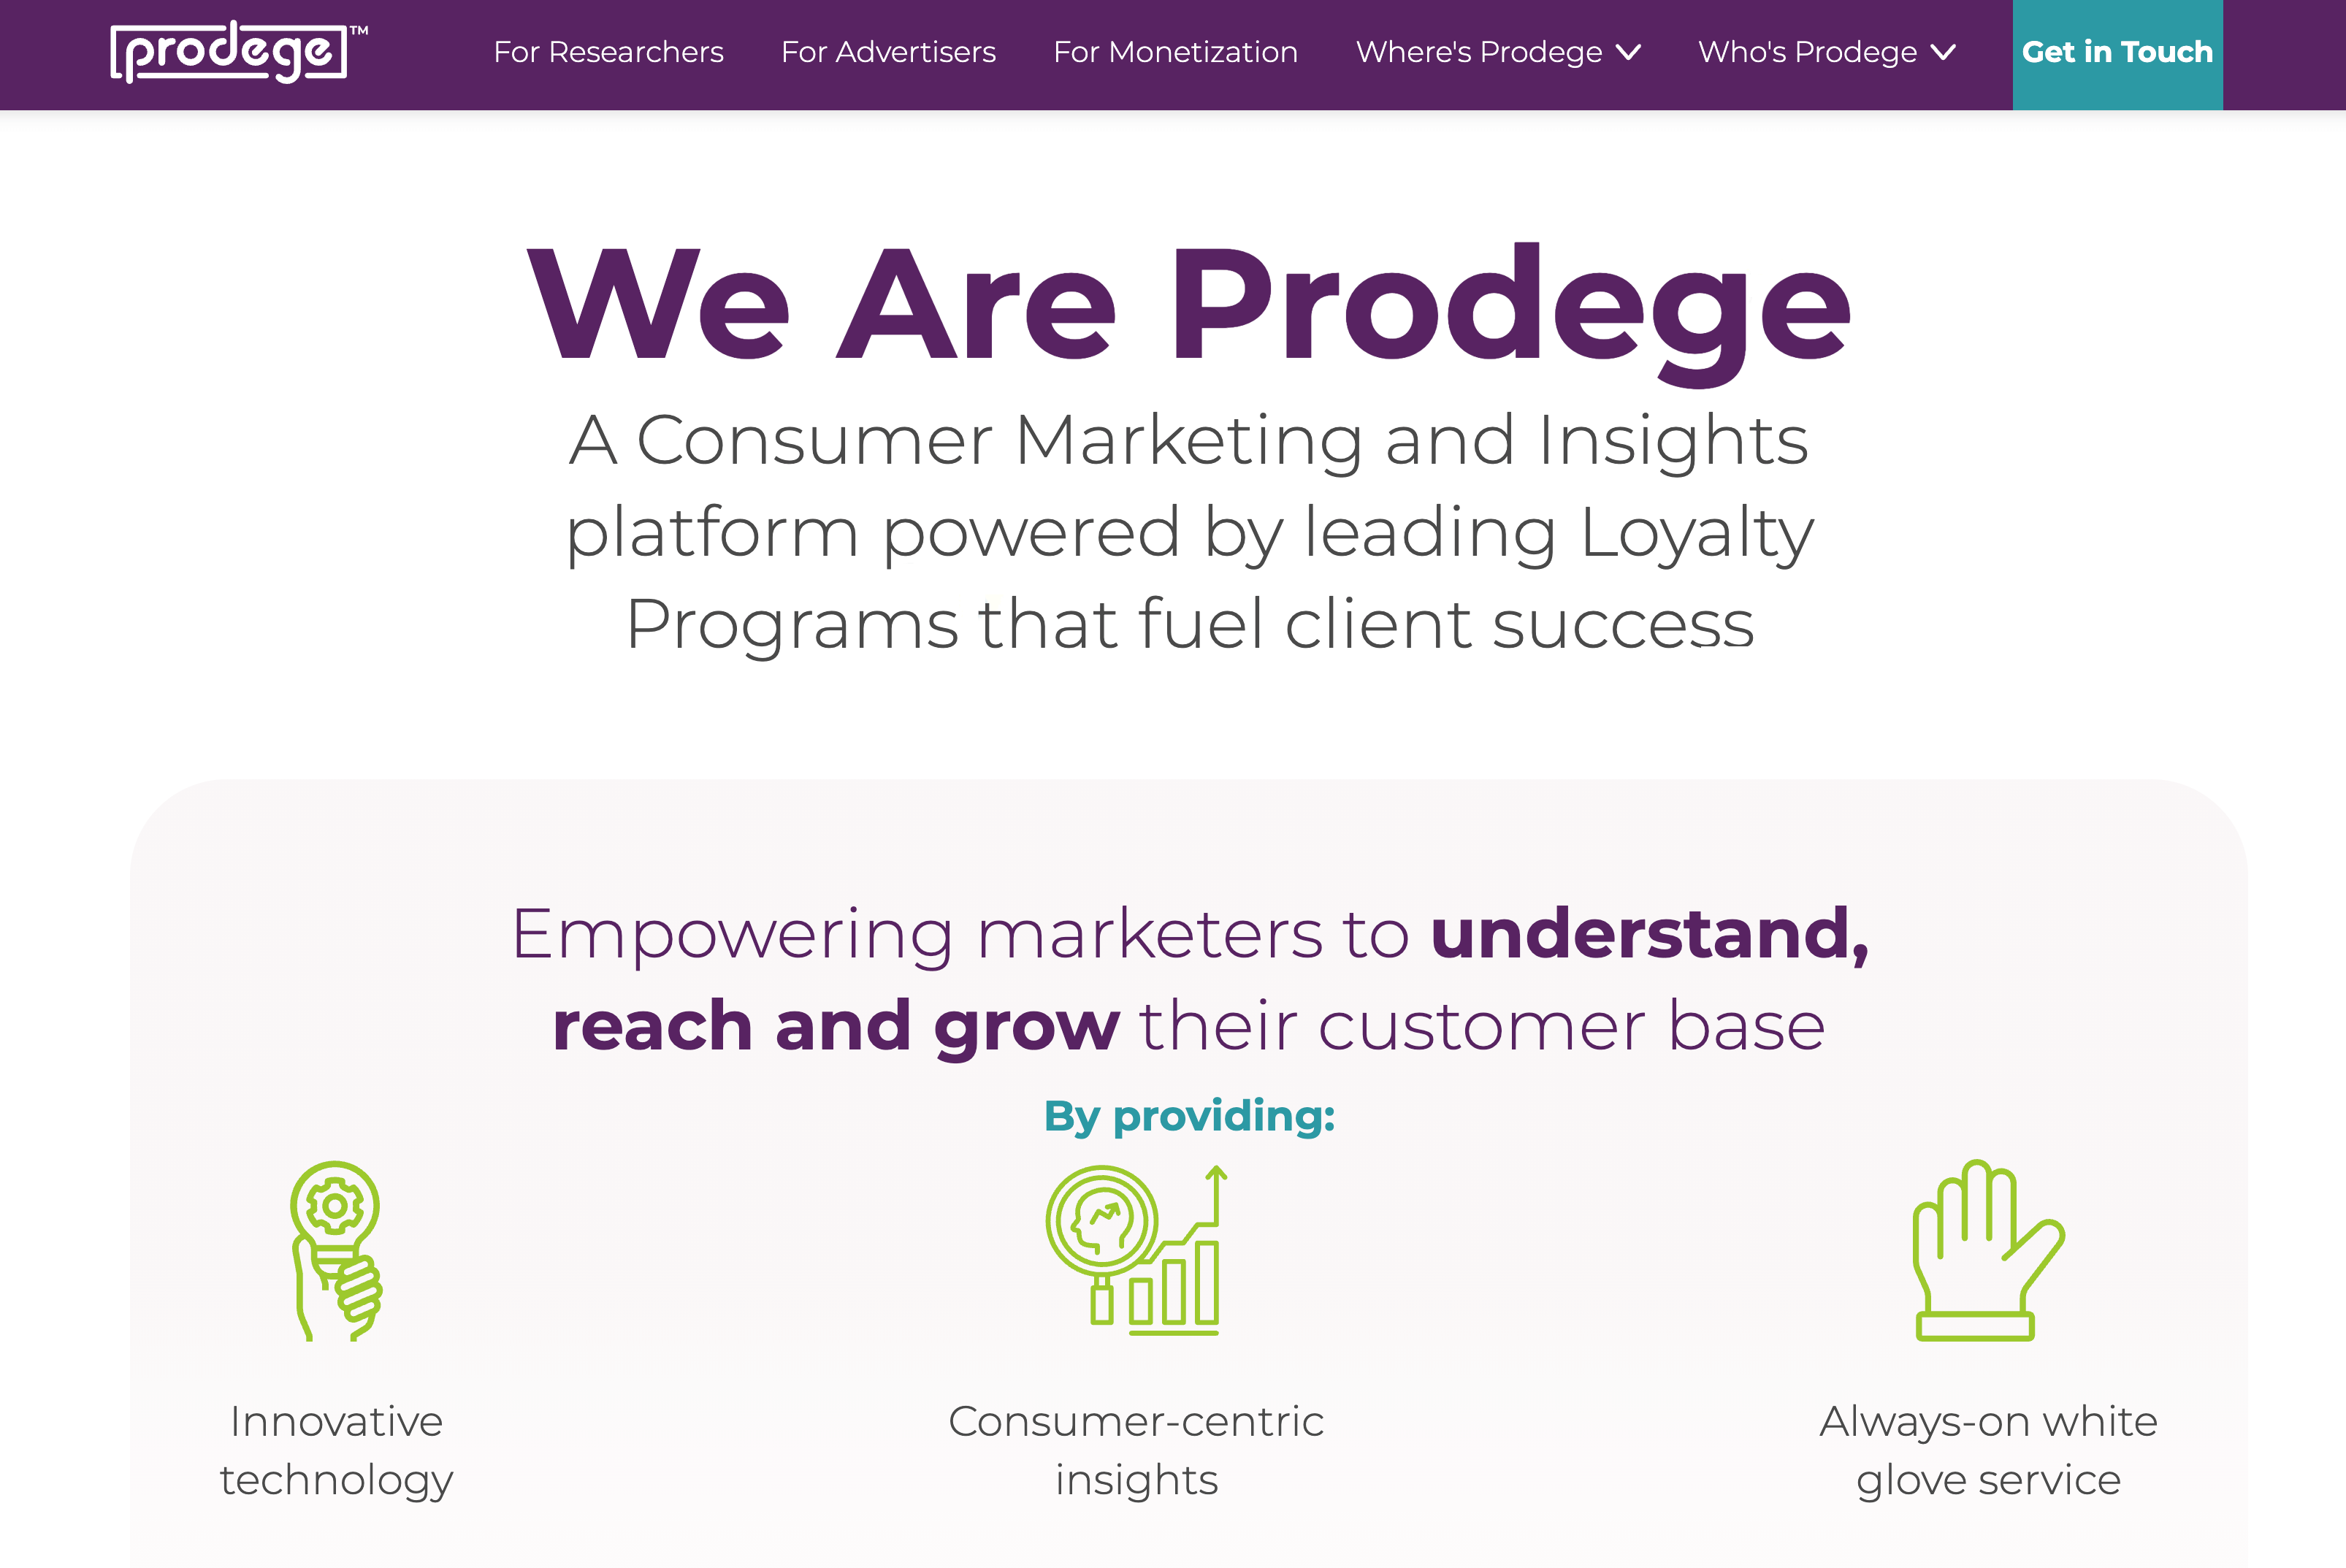
Prodege, Pollfish’s parent company, is a consumer marketing and insights platform powered by leading loyalty programs that fuel client success.
We own & operate the largest consumer panel in the US, with over 100M respondents, and have additional panels in 60+ countries.
What Makes Our Panel Different: Owned, Verified, and Engaged
We don't just connect researchers with respondents — we own and operate our own panel across multiple brands, including Swagbucks, MyPoints, InboxDollars, and more. Because we’ve acquired and run these properties ourselves, we know exactly who our members are and can confidently speak to the quality of every response.
More Than a Survey Panel — It's a Community
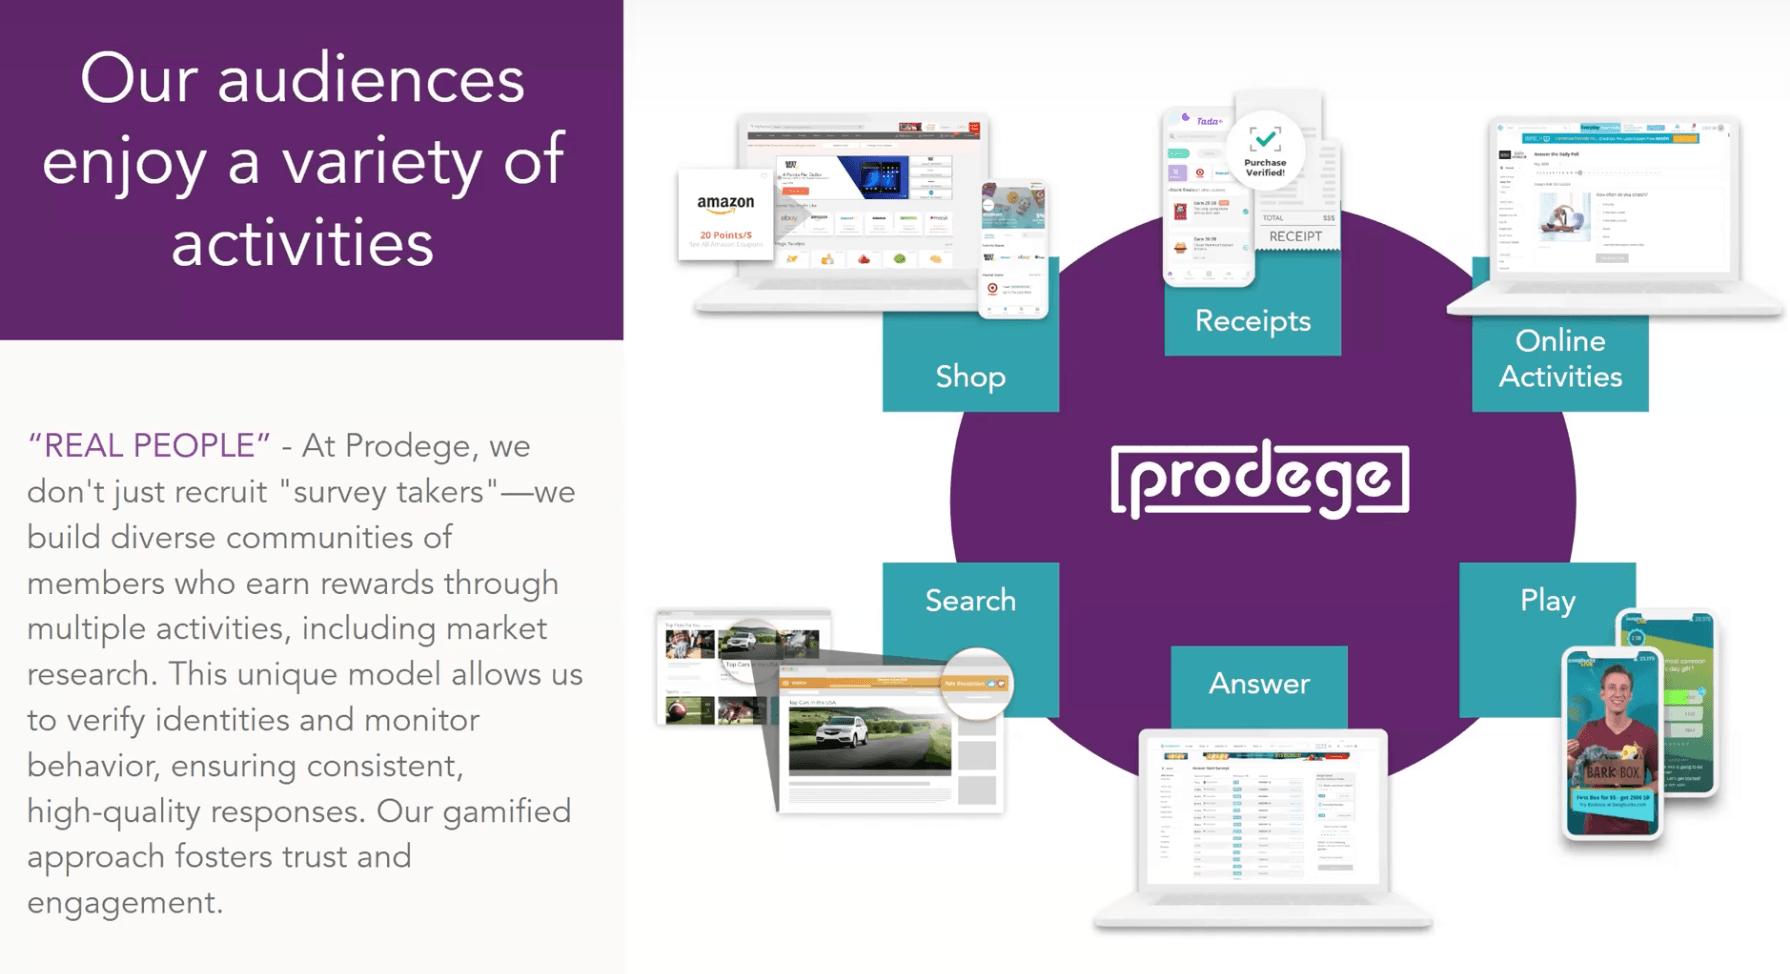
What also makes our approach unique is the experience members have when they join our websites and apps. They're not just signing up for paid surveys, but also joining a community where they can play games, take part in daily trivia, upload receipts, earn cashback from online shopping, engage with our partners, and more.
This creates a much more engaging environment — one that drives higher quality responses and stronger commitment than a standard paid survey panel.
Extensive Audience Reach, Including Hard-to-Reach Groups
With over 100 million respondents across our panel, Prodege gives you access to virtually any demographic. Our targeting capabilities are built to reach audiences that traditional panels struggle with — younger demographics like Gen Z, male respondents, specific ethnic groups, and other underrepresented segments in market research.
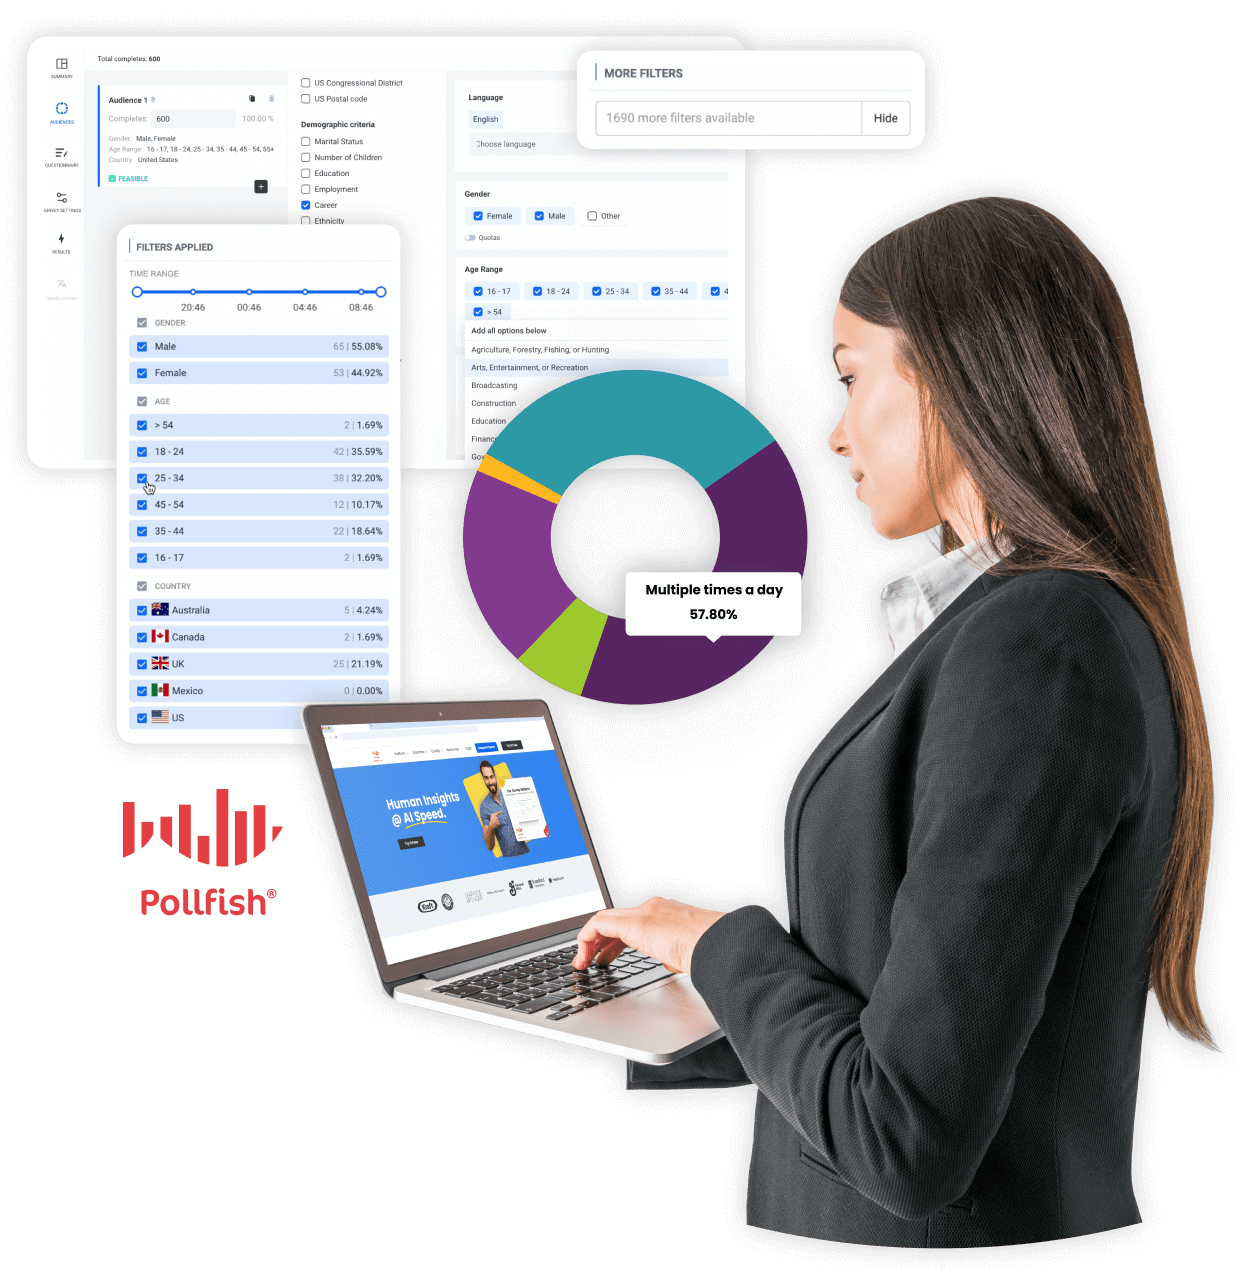
Precise Behavioral Targeting Filters
Prodege's behavioral targeting filters go beyond standard demographics. Because our panel members upload purchase receipts to earn rewards, you can target audiences based on verified, real-world behavior — not just what people say they do.
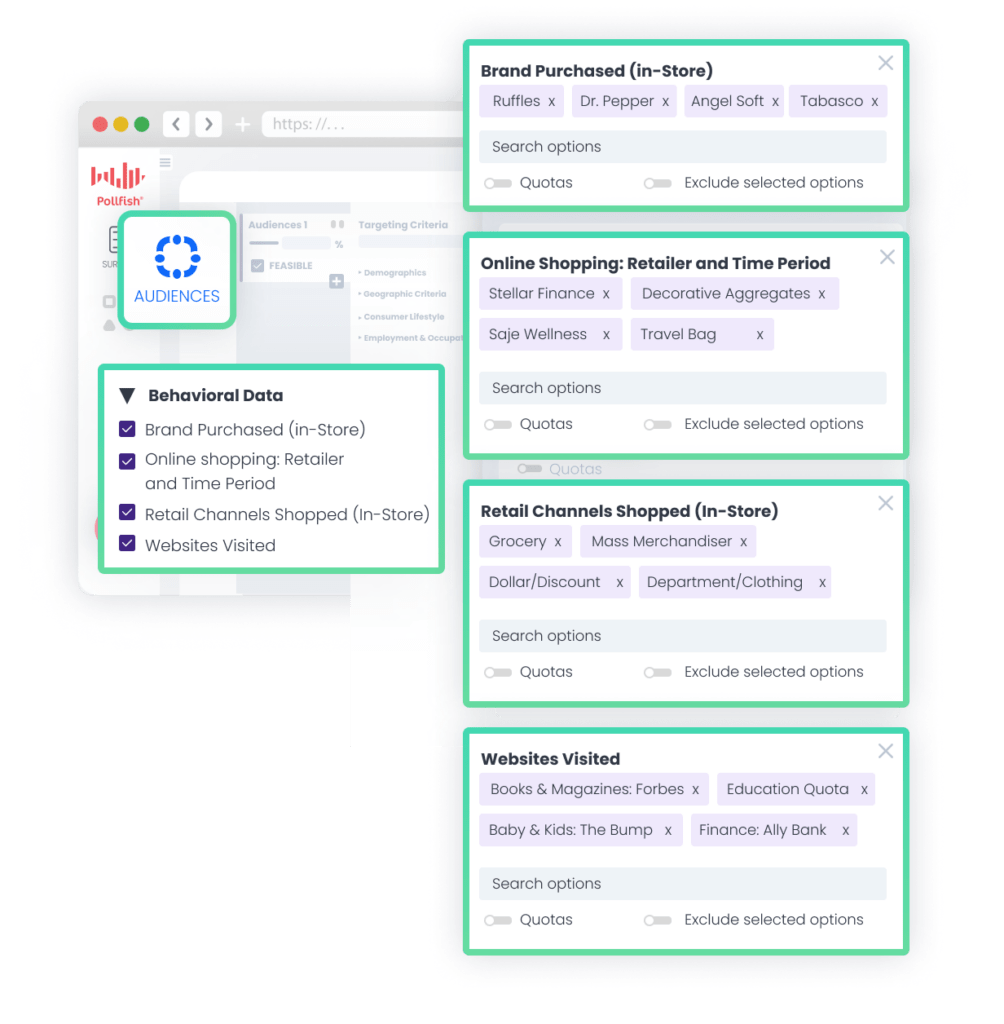
For example, you can filter audiences by:
- Products purchased (e.g., Ruffles, Dr. Pepper, Angel Soft, Tabasco)
- Retail stores visited (e.g., Target, Costco, 7-Eleven, Papa John's)
- Websites visited (e.g., BuyBuyBaby, CNN, Reddit)
This means your targeting is grounded in actual purchase and browsing data rather than self-reported responses, reducing misreporting and giving you cleaner, more accurate data.
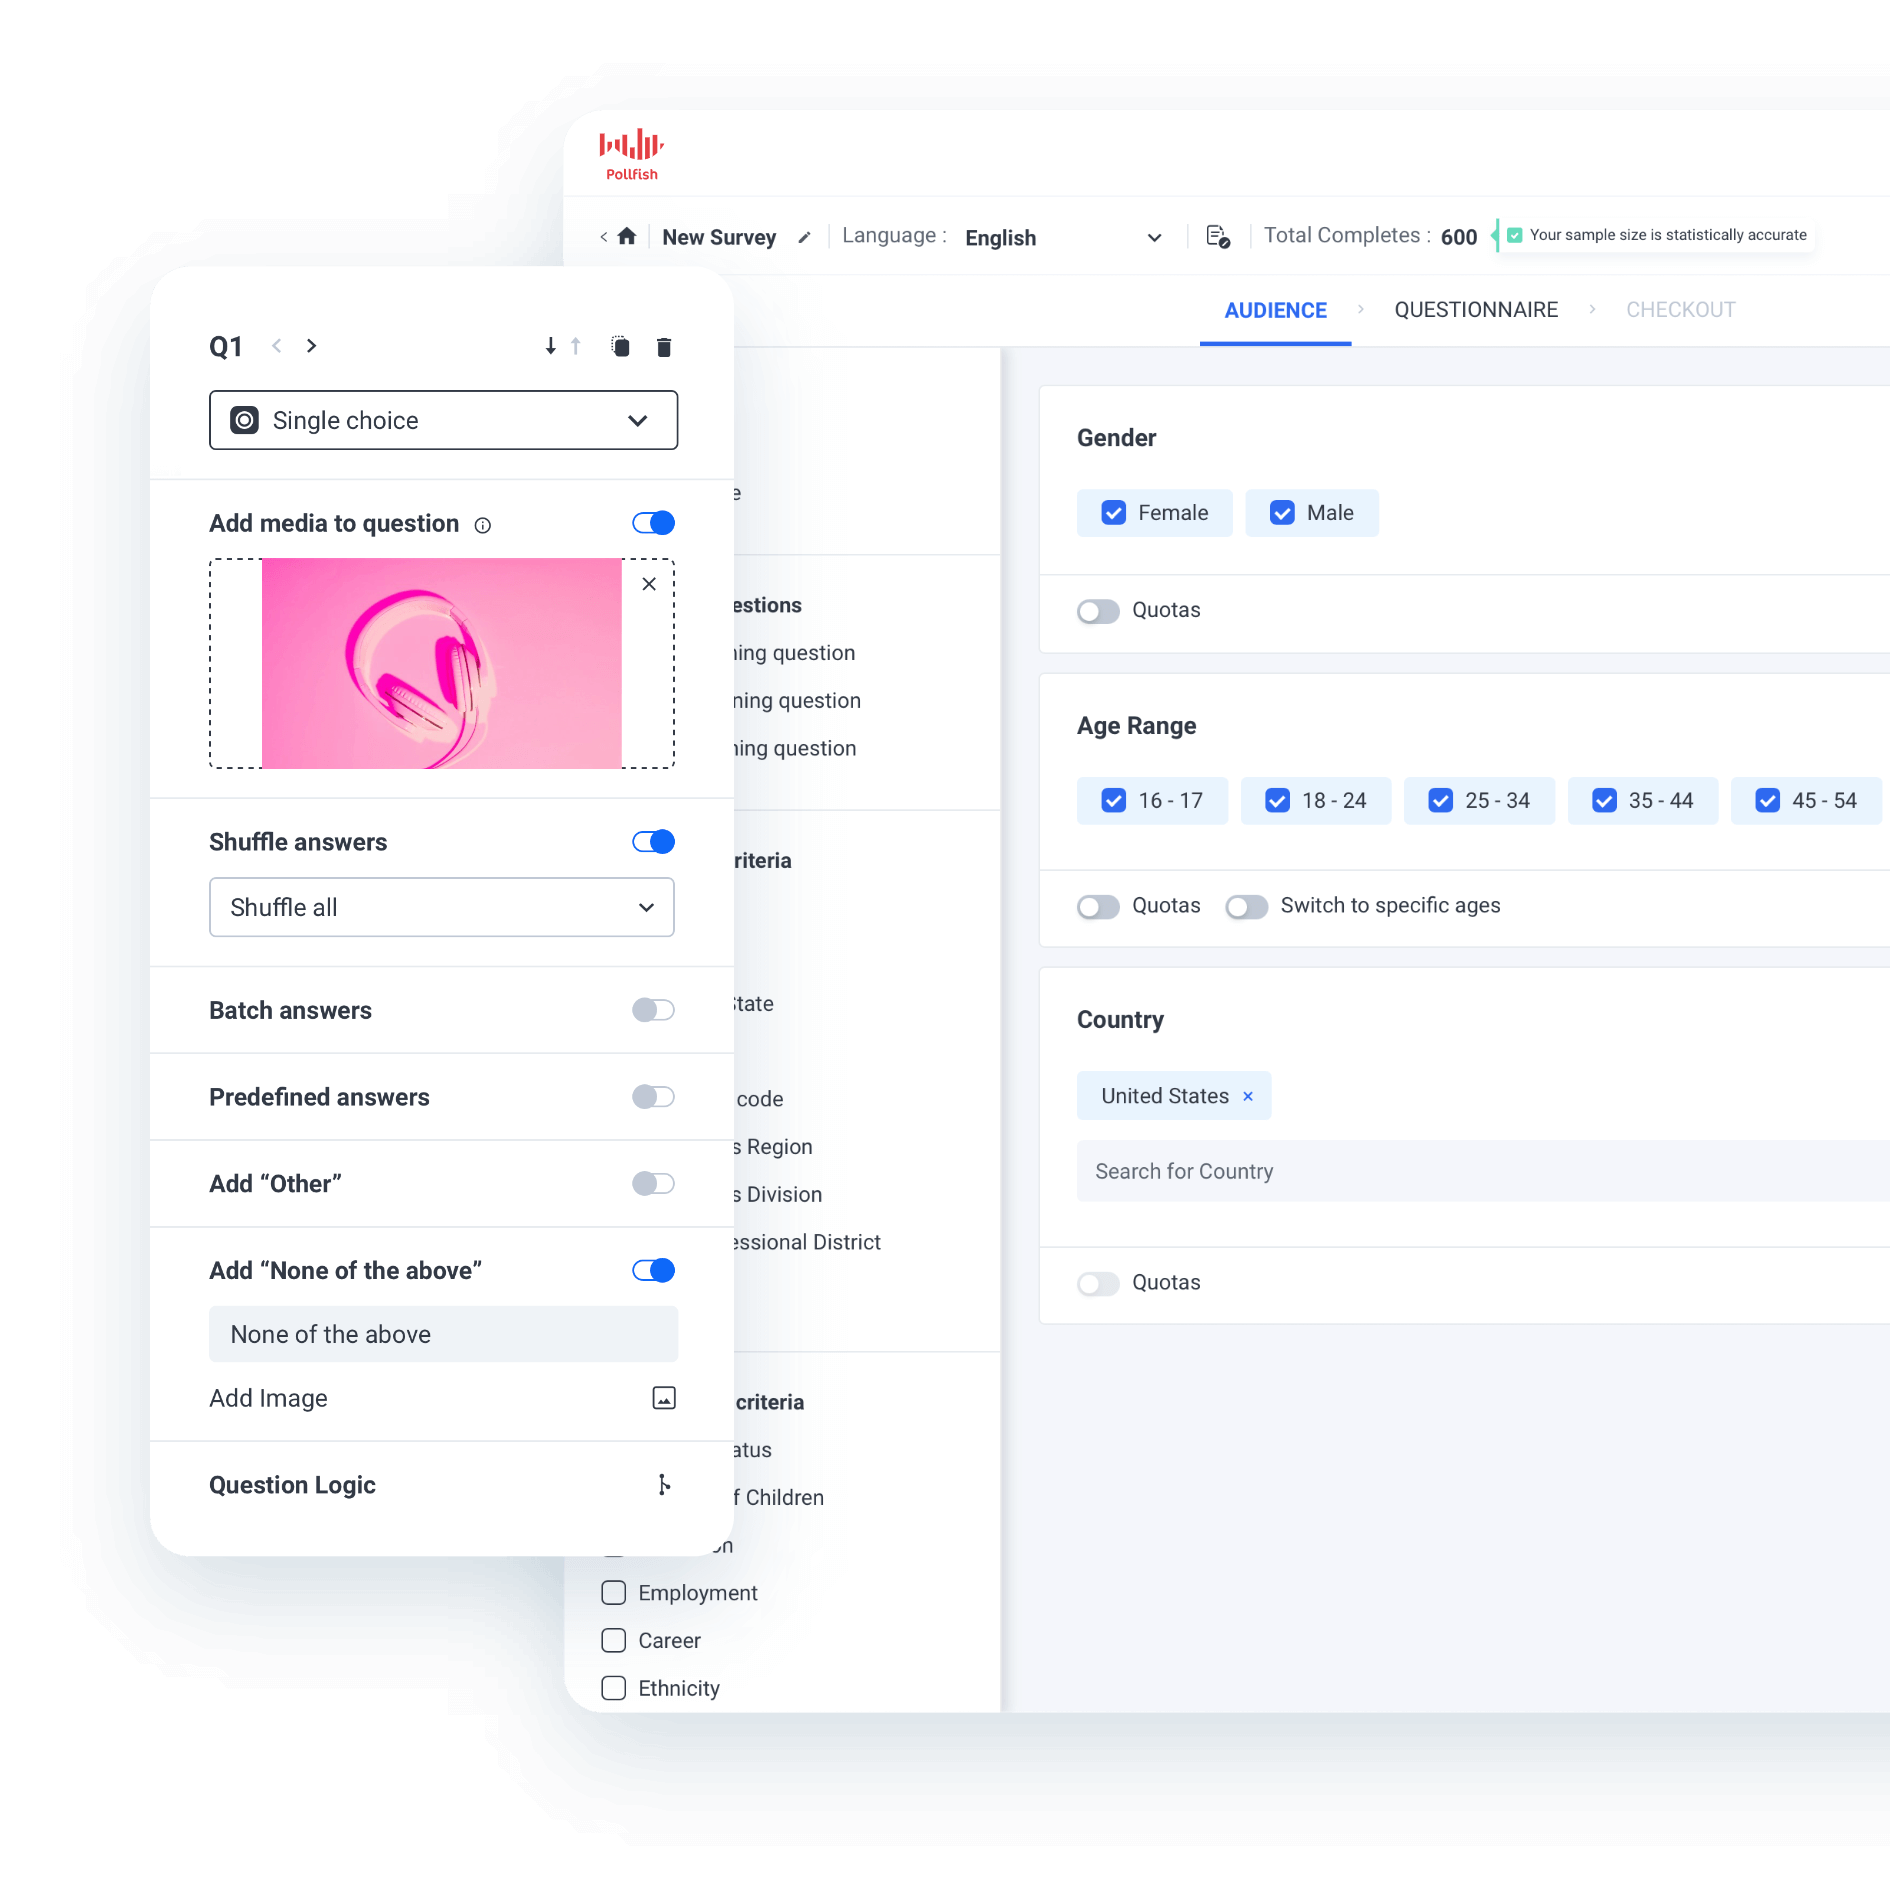
Note: The screenshot above is from Pollfish, our DIY survey tool. Prodege's behavioral audience filters are available to any research project that uses our panel. Pollfish is simply the most direct way to access them. Since Prodege is our parent company, the data is native to our platform with no middleman, which means faster setup and lower cost.
Rigorous Audience Quality Measures
Data quality has been core to Prodege’s DNA for over 15 years. We have a dedicated 40-person Panel Support, Security, and Compliance Department focused entirely on ensuring clean samples and staying ahead of emerging threats to data integrity.
For a deep dive, check out our guide: 3 Survey Data Quality Issues Sabotaging Your Research.
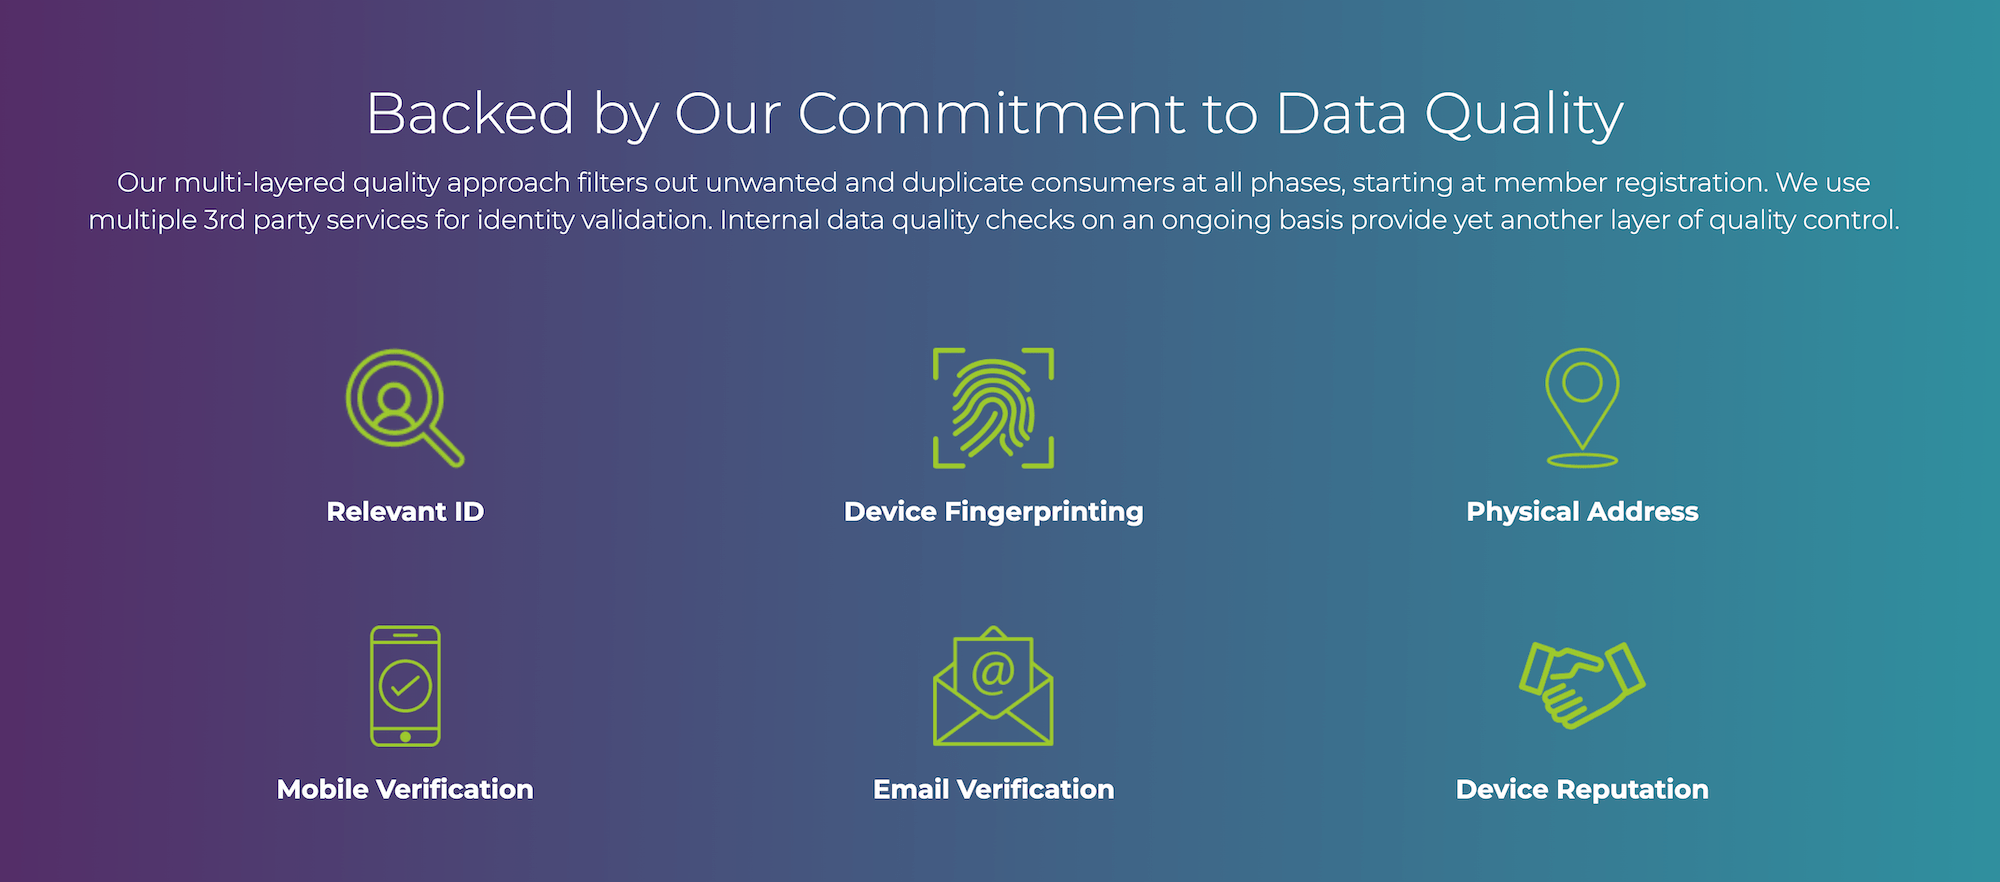
Here's a sampling of the quality control measures we apply:
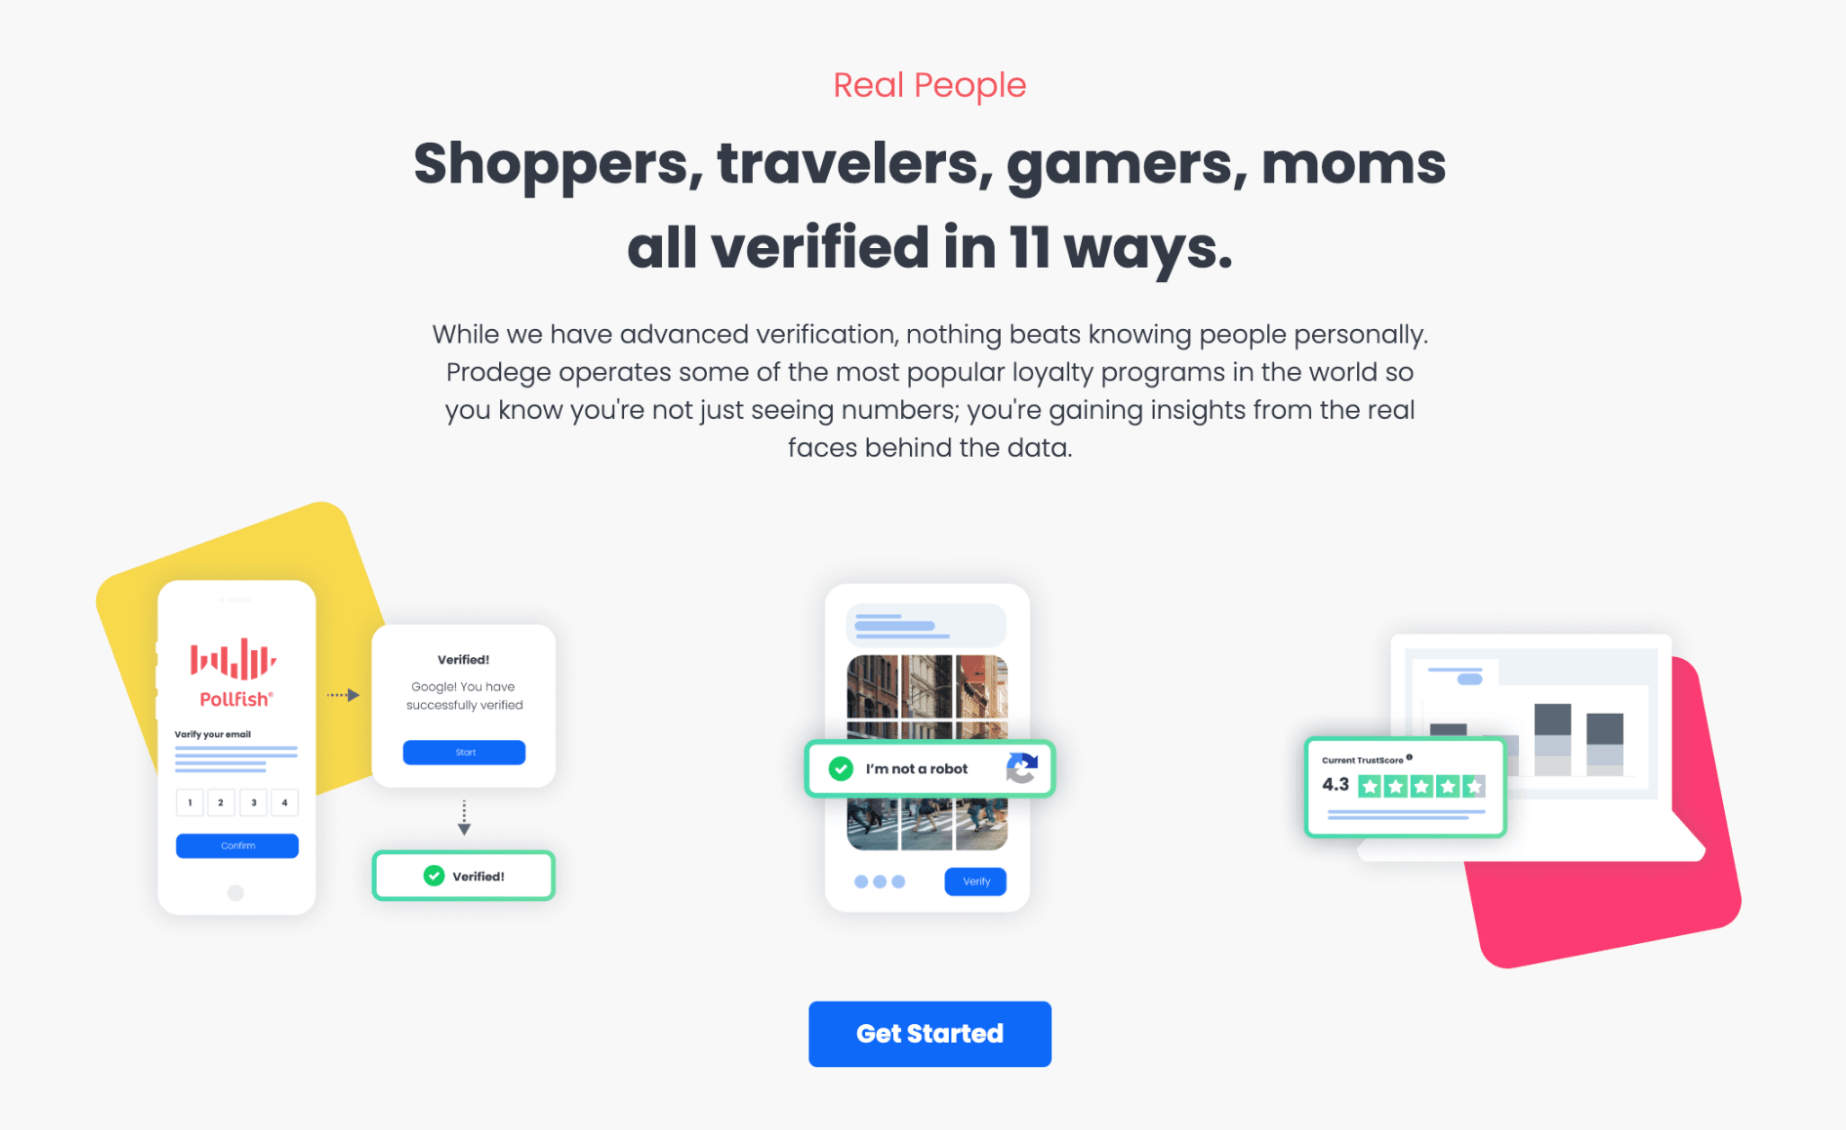
- Verifying respondent identities through diverse activities beyond surveys: Our panel members can earn rewards not only by completing surveys, but also by playing games, shopping online, uploading receipts, and more. This gives us more data points to verify respondent identities and build fuller profiles.
- 14-day evaluation period: New panelists must complete internal quality checks before they can participate in client surveys.
- Trust scores: We have a proprietary machine-learning solution that assigns each panel member a trust score and updates it based on ongoing inputs. Members with low trust scores may have their accounts deactivated and/or require additional identity verification.
- Fraud detection through Prodege QualityShield™: Our proprietary fraud detection system adds another layer of protection. Learn more here.
- Manual review of open-ended responses: Our Project Management Team meticulously reviews open-ended question answers and replaces any respondents who provide low-quality answers, including:
- Random characters or irrelevant text
- Overly brief answers where a detailed response is warranted
- Answers that do not make sense given the context of the question
- Speeding detection: Our system monitors how long respondents spend on each question and flags those who complete the survey much faster than the average time, as this may indicate a lack of thoughtful engagement.
- Straight-lining detection: We identify respondents who select the same answer for multiple questions in a row.
- Red herring questions: We strategically insert red herring questions throughout surveys to ensure respondents are paying attention.
With these measures and many more working behind the scenes, you can trust that the data you're basing your decisions on is accurate and reliable.
Interested in Learning More About Prodege?
We invite you to:
2. Cint

Cint is a survey panel provider known for its exchange-based research marketplace. They help connect you with 3rd party panel providers.
Some of their key benefits and capabilities include:
- Survey participants: Connecting you to respondents and offering 3rd party panel access for your research needs
- Research marketplace: Helps you reach niche audiences and gain actionable insights
- Global scale: Reach audiences across the world to answer your questions
3. Dynata
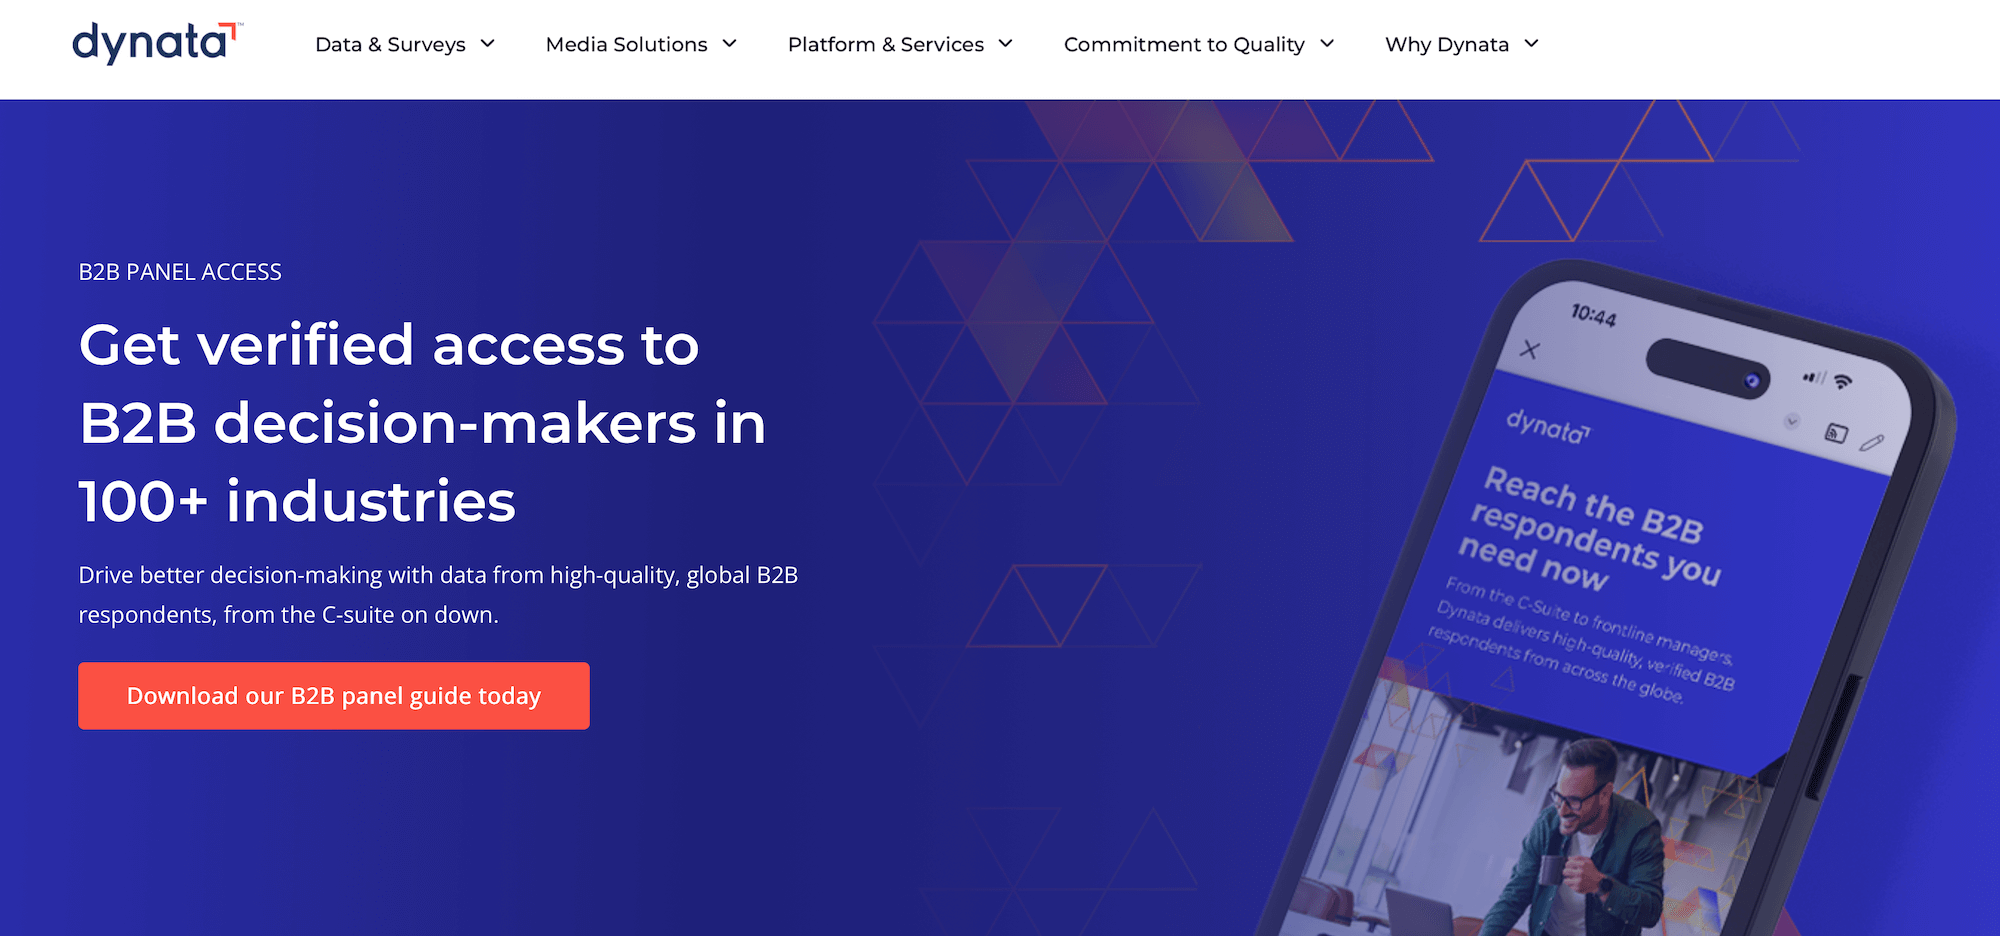
Dynata is a survey panel provider with a global first-party data platform.
Some of the benefits and capabilities of their panel include:
- First-Party Data: Permission-based, research-grade, first-party data
- Technology-Driven Quality: AI-powered fraud detection and multi-layered verification system ensure data integrity
- Flexible Solutions: Multiple buying options from self-service to fully managed help balance cost efficiency with research-grade data quality tailored to business needs
4. DISQO
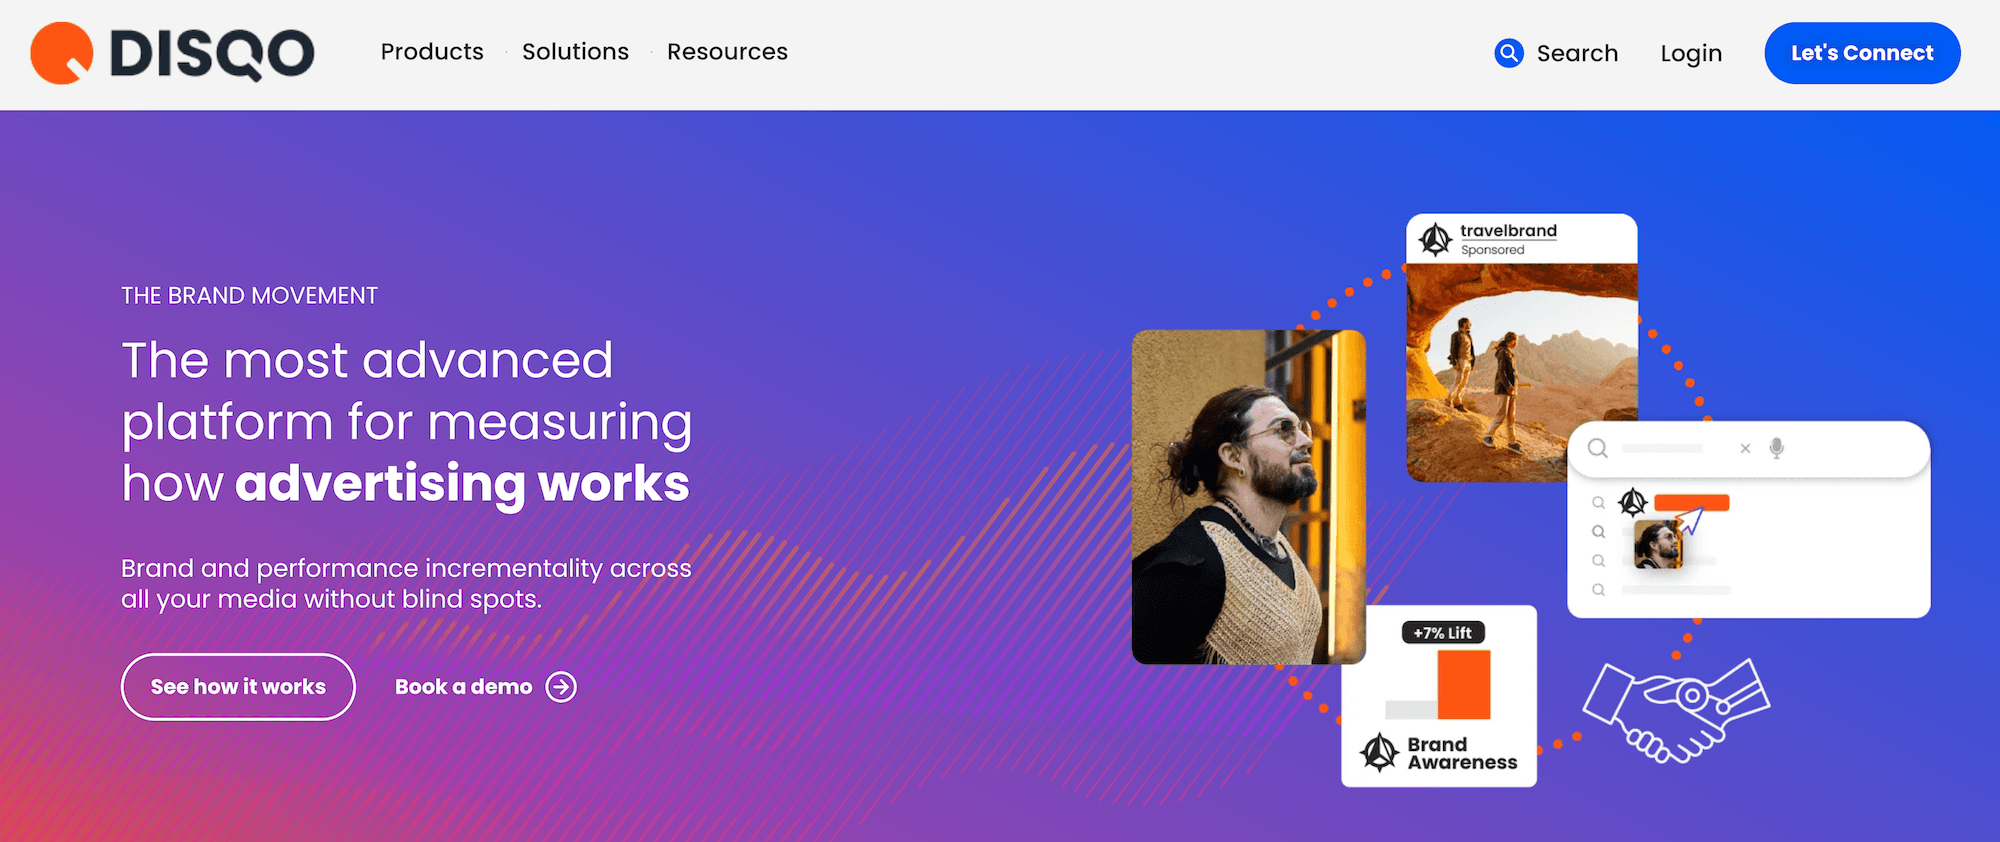
DISQO is a survey panel company that combines opt-in consumer data with behavioral insights.
Some of their products and features include:
- Brand Lift: Measure how advertising shifts consumer attitudes like awareness, consideration, and purchase intent.
- Outcomes Lift: Measure the incremental impact advertising drives to search and site visitation for your brand and category.
- Deterministic Identity: DISQO’s platform is built on deterministic, person-level identity, meaning every impression they track is tied to a real individual.
- Flexible Exposure Capture: DISQO uses tags where possible, direct platform integrations where needed, and tagless technology to make sure exposures are seen and accounted for.
- Brand and Performance Incrementality: DISQO measures the full spectrum of media impact, from awareness and favorability to branded search, site visits, and category exploration.
Category #2: Survey Platforms with Built-In Audience Panels
5. Pollfish
Pollfish is our DIY survey platform, powered by Prodege's first-party audience panels. That means you get direct access to 100M+ respondents with the same data quality standards described in the Prodege section earlier — all built into the platform.
Because Prodege is our parent company, there's no middleman, which means lower costs passed on to you. Everything happens right inside Pollfish: select from our extensive audience filters, launch your survey, and collect responses, all backed by Prodege's verified, first-party respondent data.
Below is a brief overview of what makes Pollfish stand out, with real customer feedback for each. For a deeper comparison of survey platforms, read our article on the Best Survey Software for Market Research.
Rigorous Data Quality Measures
Every survey that runs through Pollfish is protected by the same multi-layered quality controls described in the Prodege section earlier.
For a detailed breakdown on the robust safeguards we implement, see our article: 3 Survey Data Quality Issues Sabotaging Your Research.
As several customers have shared:
“The most important point to make is that I trust the responses of my survey. My target audience was very specific and I could tell that the responses were legitimately coming [from] subjects in my target audience.”
– Read the full review here
“Each time I use this service I am blown away by the speed with which the responses come in and with the detail which most of them include. You can tell that the respondents take this very seriously. They must really enjoy doing it.”
– Read the full review here
“I had to get some data on a product in a tricky sector. It was proving challenging to attract participants to my study. I was able to quickly get results and some insights to be able to move forward with my work using Pollfish.”
– Read the full review here
“I was very satisfied with the results I got from Pollfish. My company was conducting market research and received very insightful help from consumers who were all verified homeowners.”
– Read the full review here
Precise Targeting Filters

Pollfish offers over 50 targeting filters across 6 categories, so you can define your exact audience before launching a survey. If your research requires something more specialized — a hard-to-reach niche, custom screening criteria, or a fully managed study — our team can run the project through Prodege on your behalf. Reach out here.
Some of the targeting filters we offer include:
- Demographics: Age, Gender, Hispanic Origin, Marital Status, Languages Spoken, Education Level, US Voter Registration, Household Income (US), Age & Gender of Child(ren) in Household, Type of Home, Pets in Household, Political Party Support, Hispanic Level of Acculturation, Parental Status / Pregnancy Status, Race, Device Type, Device Operating System (OS), Ethnicity, Number of Children in Household
- Geographic Criteria: US State, US Division, US DMA, US Region, US Statistical Area (CBSA), US County, US Zip Code
- Consumer Lifestyle: Beverage Consumption, Hobbies & Interests, Sports Participation, Gambling Participation, Music Streaming Services Use, Movie Theater Frequency, Home Movie Viewing Frequency, Video Game Participation, Video Game Consoles, Video Game Genres, Travel by Air for Business/Leisure, Vehicle Make/Brand Own or Lease, Vehicle Type Own or Lease, Health Ailment Diagnosis
- Employment & Occupation: Employment Status, Industry Work In, B2B Department, Number of Employees, Job Title
- Behavioral Data: Brands Purchased (In-Store), Online Shopping: Retailer, In-Store Shopper, Category Buyers, Retail Channels Shopped (In-Store), Websites Visited, Retail Channels Shopped (Online)
- Media: Video Streaming Services Used
Note: Click here to learn more about Pollfish’s audience targeting capabilities.
As several customers have shared:
“The surveys were easy to setup, allowed me to select my very specific target and launched right away. Within a couple of days I had my results in an easy to interpret, actionable format well within my budget.”
– Read the full review here
“The ability to easily target specific demographic groups and get completed survey results back within 1-2 days has been game-changing for us.”
– Read the full review here
“When validating the survey and before processing the payment, Pollfish gives you valuable feedback on the structure of the survey and the target audience, so you can improve it before publishing it. This helped me spend my money more wisely and target the right audience.”
– Read the full review here
Transparent Pay-per-Response Pricing Model
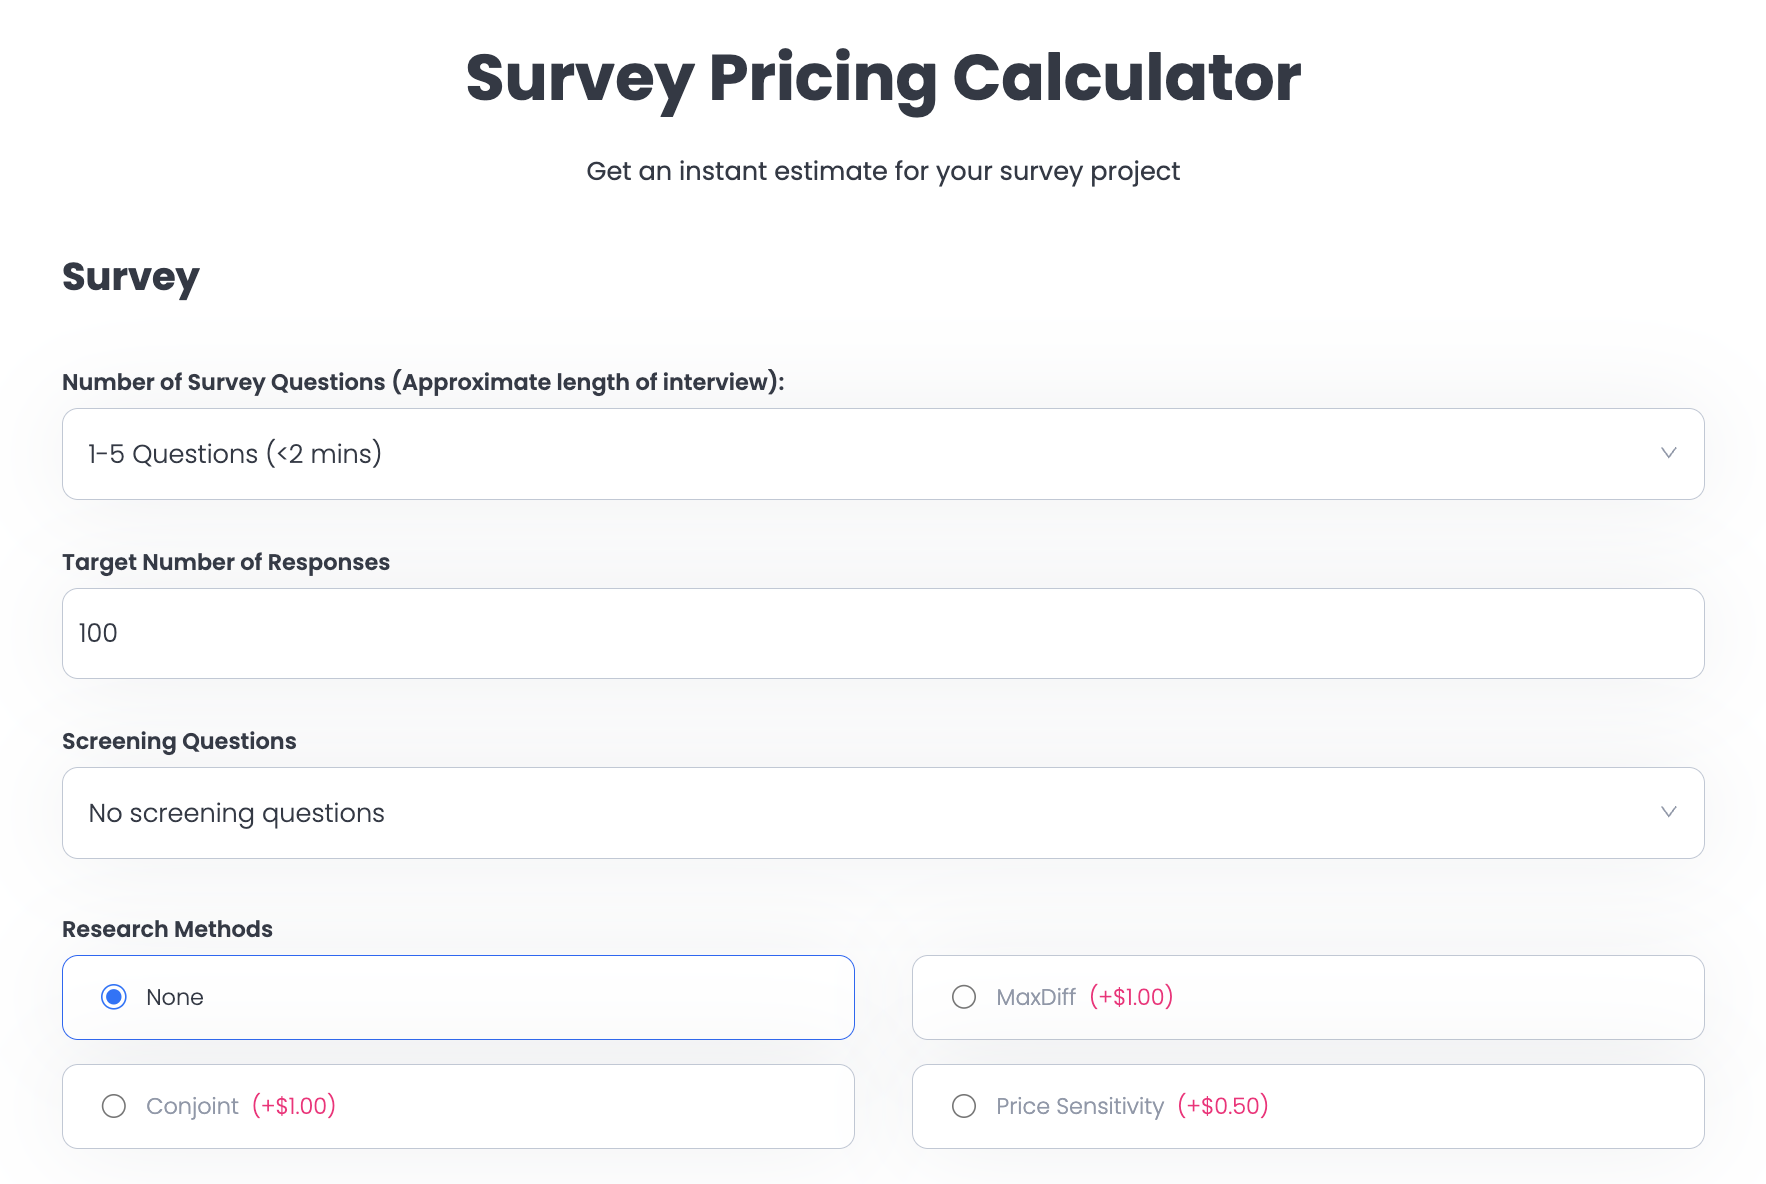
Pollfish uses a pay-per-response pricing model starting at $0.95 per response. There are no subscription fees, no long-term commitments, and no hidden charges. You only pay for the responses you receive, and pricing is always transparent on our dashboard.
You can estimate your total cost before committing using our survey pricing calculator, no account or sign-up required.
As several customers shared:
“They charge based on the completed response. It is very fair and transparent. As a researcher, I have used many survey platforms, but they are the best so far.”
– Read the full review here
“The dollar amount they quote you in their cost calculator tool, and the number they show when you're developing the survey, is the number you pay. I was burned multiple times by [competitor] charging me unexpected amounts and making it difficult to quit an expensive subscription. I'm so happy to have found Pollfish as an alternative. Their support team also responds VERY quickly to chat messages and has been tremendously helpful the few times I had questions.”
– Read the full review here
“The pricing is clear and transparent from the beginning. The results come quickly and can be downloaded in different formats and with different filters. What we like most is the ability to filter the results and analyze them separately for each segment. We highly recommend this platform.”
– Read the full review here
Fast Turnaround Time
Because Pollfish sources respondents directly from Prodege's proprietary panel, surveys field much faster than with most competitors.
General population studies are typically completed in a few hours, while more specialized or niche audiences may take a few days.
Review for a general population survey:
“I needed a 25 question survey answered, and was able to get 500 completed surveys in 8 hours with Pollfish. The presentation of the results is very impressive and the demographics information Pollfish provided is invaluable.”
– Read the full review here
Review for a specialized niche:
“I'm amazed at how quickly the platform was able to deliver rich, segmentable data from over 500 respondents. I had feature-ready insights in only 3 days.”
– Read the full review here
Intuitive, Easy to Use Platform
Pollfish is built to handle complex research without a steep learning curve. Our platform includes advanced questionnaire design, flexible audience targeting, and built-in data analysis capabilities.
With customizable survey templates and powerful AI survey tools, you can go from idea to live survey in minutes.
As several customers have shared:
“Pollfish is probably the single easiest software I’ve ever used. The drag and drop builder is great itself, but the template library also has anything we ever need, so you rarely have to design anything from scratch. The templates are also designed very well, we usually pick one, do a couple edits, and deploy. The whole thing takes less than 10 minutes.”
– Read the full review here
“The surveys were easy to set up, allowed me to select my very specific target and launched right away. Within a couple of days I had my results in an easy to interpret, actionable format well within my budget.”
– Read the full review here
“I have used this platform ~10x over time and find the process easy, their review process helpful, and the insights I get from people valuable as I work through different product concepts in market research. Their pricing is more reasonable than other competitors I've looked into, and am happily going to continue using Pollfish.”
– Read the full review here
Complimentary 24/7 Support From Seasoned Market Researchers
Our customer support team is available anytime, including nights and weekends, to consult with you on anything you need. We go beyond basic technical support to offer guidance on strategic aspects of market research, from audience targeting to data analysis and everything in between.
As several customers have shared:
“The customer service team is super responsive too for those more complex enquiries about the tool and criteria. All in all this experience has been way easier (and cheaper) than any other ‘big players’ out there.”
– Read the full review here
“I love this product. I feel like it gives me enterprise grade market survey tech at a consumer price. Highly recommend. I love how responsive the customer support team is.”
– Read the full review here
“The customer service I received was fantastic. Brilliant guidance that helped get high-quality results. I was really pleased with the outcome and highly recommend using them.”
– Read the full review here
Interested in Learning More About Pollfish?
- Create a free account, no credit card required
- Visit our pricing page and explore our survey pricing calculator to get an instant cost estimate
6. Qualtrics

Qualtrics is a survey platform that offers 3rd-party survey panel access.
Some of Qualtrics’ benefits and capabilities include:
- Insights from a vast audience: Reach a large array of 3rd party survey panel audiences for your research needs.
- Real insights: Based on more than a decade of data and industry benchmarks, their market research panel is consistent over time.
- Help with heavy lifting: Qualtrics takes care of aspects from expert methodology to sourcing and managing respondents, to fielding your study and reporting on the results.
- Qualitative research: Beyond surveys, Qualtrics also offers IDIs and focus group research solutions.
7. SurveyMonkey
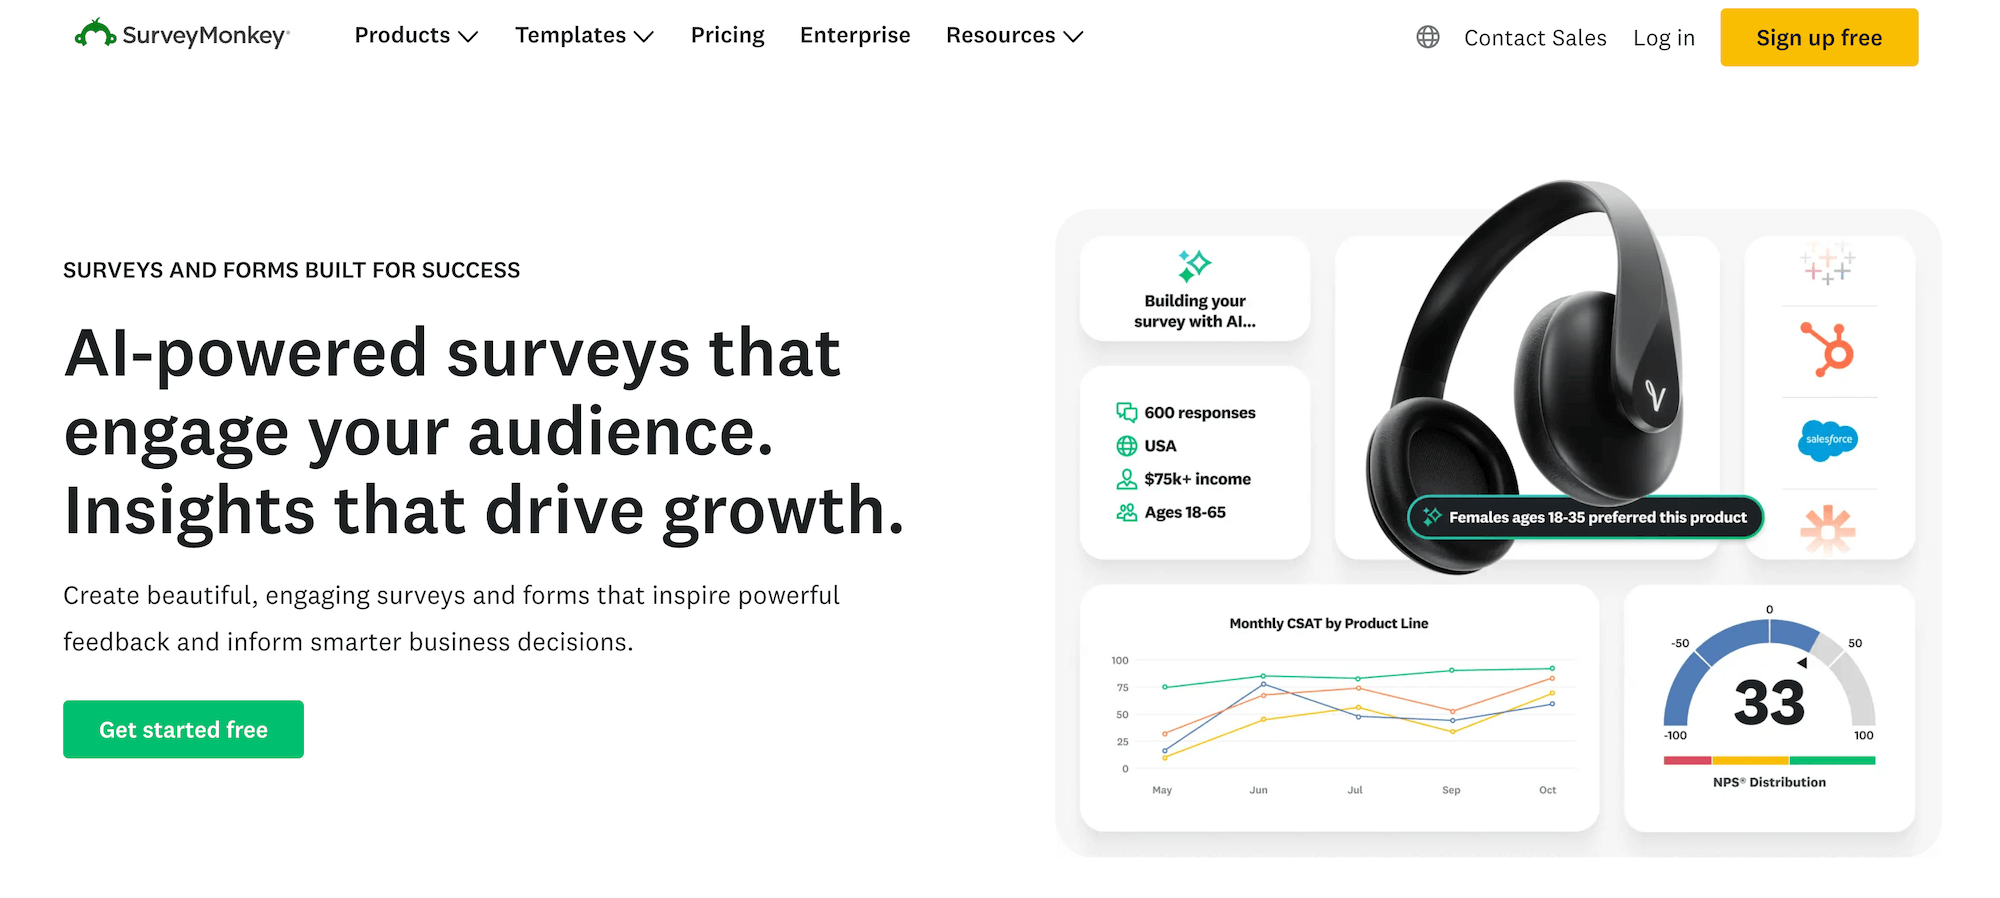
SurveyMonkey is a survey tool that offers 3rd party survey panel access to aggregators like Cint and PureSpectrum.
Some of their benefits and capabilities include:
- Respondent access to 3rd party survey panels: Access to 3rd party online survey panels across multiple countries and regions.
- Pre-profiled audiences: Participants are profiled across demographic and firmographic attributes, among others. This helps ensure high-quality data.
- Audience targeting: Target respondents based on criteria such as age, gender, income, education, and interests, helping with your online research needs.
- B2B targeting: Reach professionals based on job title, industry, and company size to help optimize your research study.
- Flexible sampling options: Use SurveyMonkey Audience or bring your own respondents. They also offer full-service research services.
- Integrated distribution: Manage survey distribution and sample procurement within the platform.
- Real-time reporting: Monitor incoming responses and export data for further analysis. Filter by various targeting options.
8. Alchemer
Alchemer is a survey platform and market research company that offers panel services.
Some of the benefits and functions of their panel include:
- Fulfillment Management: Alchemer’s fulfillment team will help you find the right audience, optimize online survey design to capture the feedback you need, and ensure data quality and better business decisions.
- Data Quality Guarantee: Quality-control checks and the Alchemer Data Quarantine Tool detect unusable responses systematically. They employ sophisticated automation and help eliminate bots.
- Balanced Data: To avoid any bias within your results, Alchemer balances invitations so that they are representative of census numbers for a given country.
- Time Savings: The Alchemer Panel Services team streamlines data collection so you can focus on other areas of survey research.
- Audience Diversity: Alchemer works directly with leading global research panel suppliers, giving you access to respondents in many countries across B2B, B2C, healthcare, and more.
Reach Out to Learn More About Prodege & Pollfish
Looking for a survey panel provider? Book an introductory call with Prodege to learn how our first-party panel of 100M+ respondents can support your research.
Or, if you prefer a self-serve approach, create a free Pollfish account (no credit card required). It's powered by the Prodege panel, so you get the same respondent quality in a DIY format.
5 Best Survey Fraud Detection Software in 2026 (In-Depth Look)
5 Best Survey Fraud Detection Software in 2026 (In-Depth Look)

Survey fraud is a major threat to data quality. Fraudsters are becoming increasingly sophisticated, utilizing automated bots, anonymized networks, and AI to infiltrate surveys. And the problem is getting worse.
To combat this, researchers turn to survey fraud detection software. These providers generally fall into two categories:
Category #1: Panel providers with built-in fraud prevention
These companies own and operate their own respondent panels and have fraud detection woven into the entire respondent lifecycle — from recruitment and registration through survey completion. Because they control the ecosystem, they can verify identities and monitor behavior continuously, not just at the point of survey entry.
For this category, we’ll discuss:
Category #2: Third-party survey fraud detection tools
These solutions can be layered onto existing panels or at any point of a survey (typically the start). They typically focus on specific stages of the process, such as bot detection, post-survey data cleaning, and more.
For this category, we’ll discuss:
The key thing to consider is how early in the process fraud gets caught. If a fraudulent respondent is only flagged during or after a survey, your data may already be compromised. The most effective approach catches fraud as early as possible — ideally before a respondent ever reaches your survey.
Note: Prodege (Pollfish’s parent company) owns and operates one of the largest consumer panels in the U.S., with 100M+ respondents. Prodege QualityShield™ is our multi-layered fraud prevention system built into every project. Book an introductory call to learn more. If you’re in the market for a DIY survey tool, sign up for a free Pollfish account — it’s powered by Prodege’s audience panel with the same fraud protections built in.
Category #1: Panel Providers with Built-In Fraud Prevention
1. Prodege QualityShield™
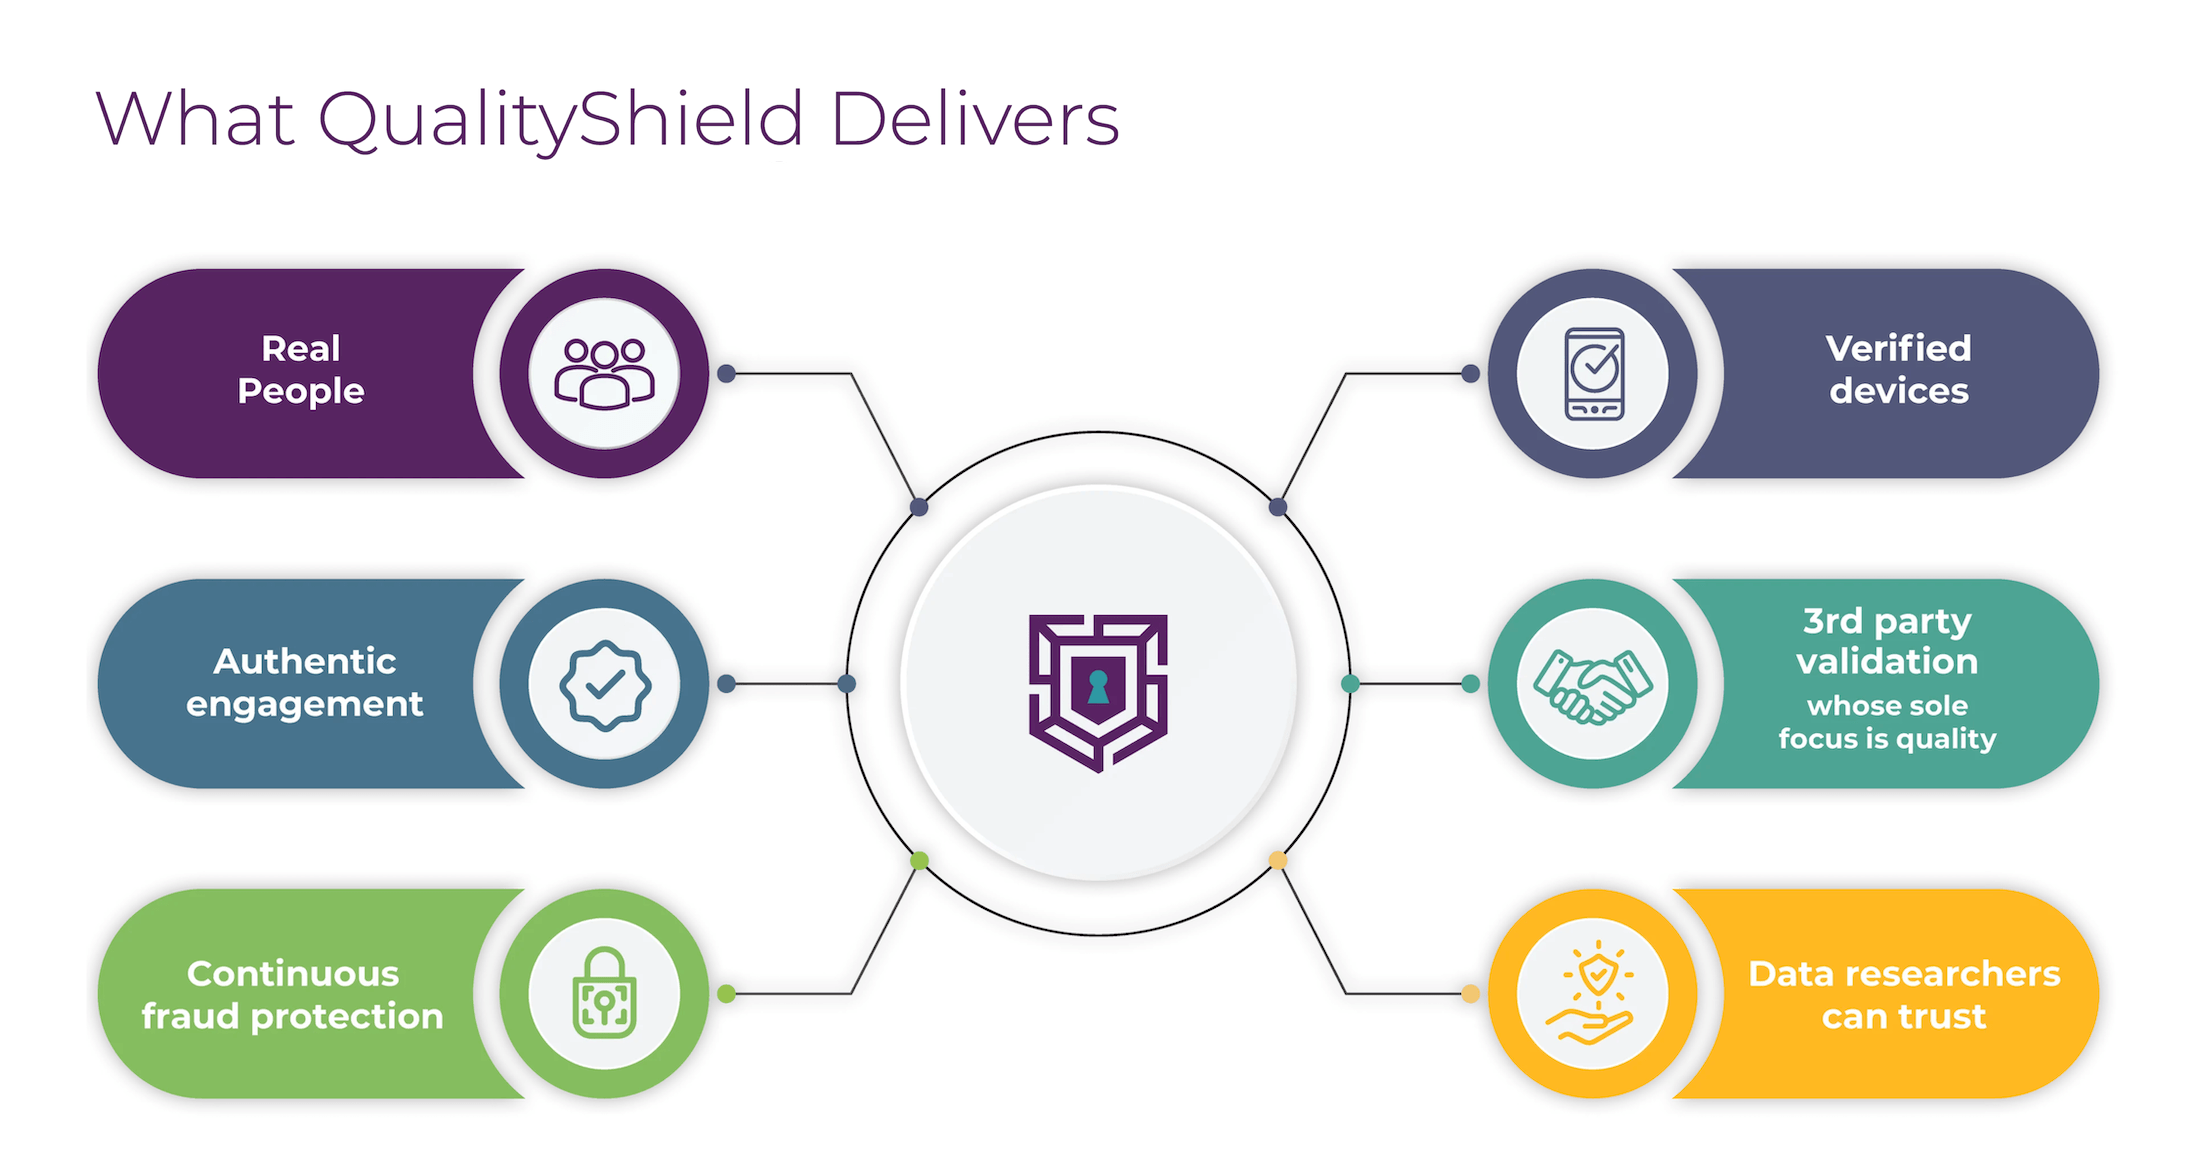
Prodege QualityShield™ is our multi-layered respondent verification and fraud prevention system designed to protect research data from the first point of respondent interaction through final response submission.
It’s built into every Prodege project — whether you’re working with our team on a managed study or using a DIY or programmatic solution — so you get the same top-tier data protection across all your research workflows.
In this section, we’ll cover what differentiates Prodege from other survey fraud detection providers, including:
- The advantage of Prodege’s owned and operated panel
- QualityShield’s triple-layer fraud protection system
- Ongoing respondent verification and quality controls
Why It Starts with the Panel: Prodege’s Owned & Operated Ecosystem
Most survey fraud detection tools are designed to catch bad respondents at the point of survey entry or after.
Prodege takes a fundamentally different approach: because we own and operate our own panel across multiple brands — including Swagbucks, MyPoints, InboxDollars, and more — fraud prevention starts long before a respondent ever sees a survey.
Our panel members aren’t just signing up for paid surveys. They’re joining a community where they play games, take daily trivia, upload shopping receipts, earn cashback from online purchases, and engage with our partners. This creates a much richer relationship than a typical survey panel, and it gives us multiple data points to verify that each member is a real, engaged human being.
This matters because a bot or a fraudulent survey taker can fake a survey registration. But they can’t replicate months of real shopping receipts, consistent browsing behavior, and genuine engagement across multiple real-world activities. If someone uploads a unique shopping receipt image, that alone confirms they’re a real human — a bot couldn’t replicate that behavior.
The result: Prodege has maintained fraud rates well below industry averages for over 15 years, even as other panels have seen rates climb past 25%. The typical percentage of sample cleaned out on Prodege projects is less than 10%, a number we take great pride in. We'd encourage anyone evaluating providers to ask for this number directly. Very few will be able to share it, and even fewer will come close.
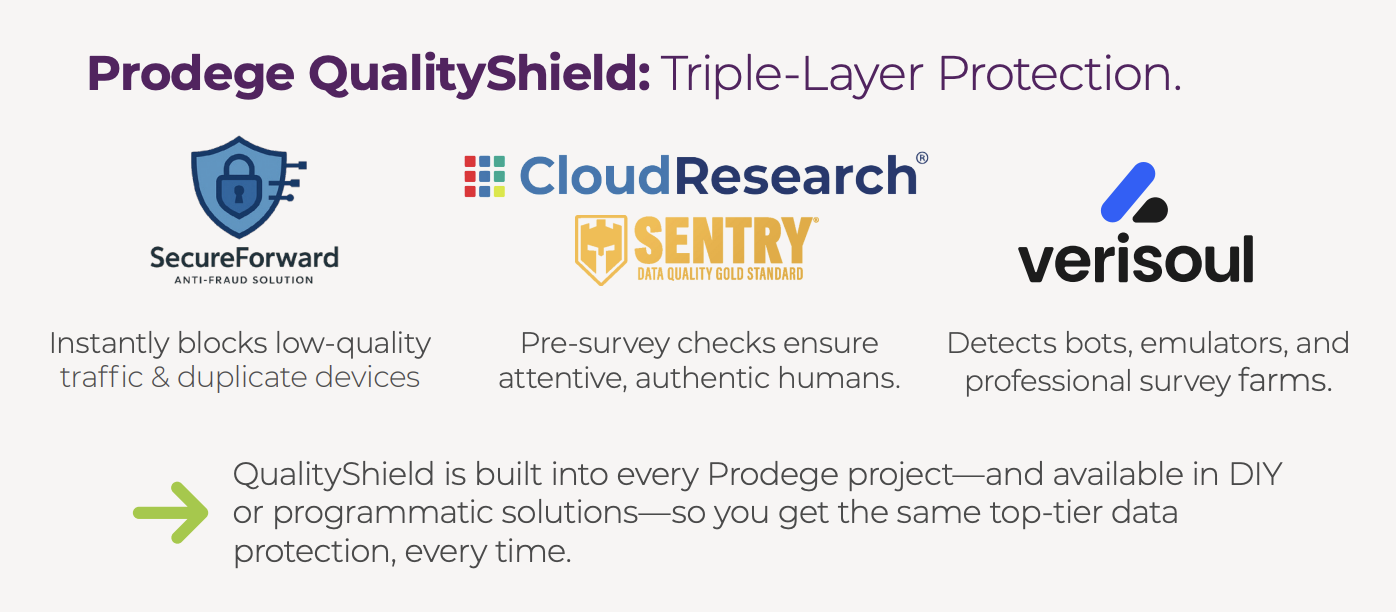
QualityShield’s Triple-Layer Fraud Protection System
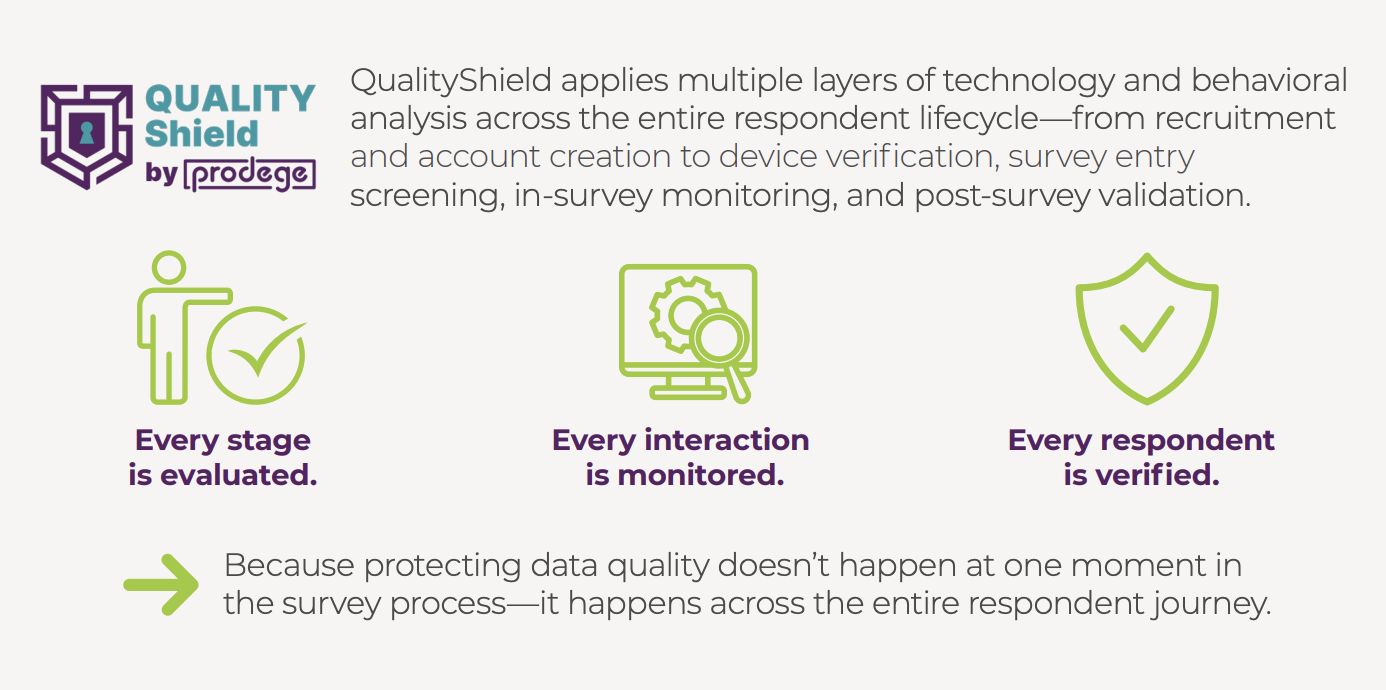
On top of the panel-level verification described above, QualityShield applies multiple layers of technology and behavioral analysis across the entire respondent lifecycle — from recruitment and account creation to device verification, pre-survey entry screening, in-survey monitoring, and post-survey validation.
SecureForward (Network & IP Intelligence)
SecureForward is Prodege’s proprietary first line of defense. Using real-time algorithms rather than static third-party databases, it instantly blocks traffic from proxies, data centers, and low-quality VPNs. It also utilizes advanced device fingerprinting to catch and eliminate duplicate respondents, so the same person can’t take a survey multiple times across different accounts.
Verisoul (Bot and Survey Farm Detection)
Fraudsters often use sophisticated software to hide their true device settings.
Verisoul looks past basic cookies to detect emulators, virtual machines, app-cloners, and browsers operated by automated scripts rather than humans.
Its advanced behavioral and device linking accurately identifies and disqualifies actors who attempt to create dozens of fake accounts to take the same survey multiple times and farm rewards.
Most importantly, Verisoul doesn’t disqualify real people. This is a problem that many competitors in the industry face, whereby their systems throw out real users due to false positives. When real users are removed, a new type of bias is introduced into the dataset.
CloudResearch Sentry (Behavioral Vetting)
Even if a participant is a verified human on a clean device, Sentry ensures only high-quality respondents reach your survey.
Before entering your survey, respondents complete a 5-question assessment developed by academic researchers. This empirically validated ‘pre-survey’ blocks users who exhibit low-effort or fraudulent behaviors.
Sentry also tracks micro-behaviors such as mouse movements, keystrokes, translation tool usage, and multiple open tabs to definitively separate authentic respondents from bots and fraudsters.
Ongoing Respondent Verification & Quality Controls
In addition to QualityShield's triple-layer protection, Prodege applies continuous quality controls across the entire respondent lifecycle — backed by a dedicated Panel Support, Security, and Compliance Department of 40+ people focused entirely on this area.
We cover this in more depth in our article on the 3 Survey Data Quality Issues Sabotaging Your Research.
Here's a snapshot of the measures in place:
- Proprietary Trust Scores: Prodege’s machine-learning system assigns each panel member a Trust Score shortly after registration and updates it continuously based on ongoing behavior and historical data. Members with low Trust Scores may have their accounts deactivated or be required to complete additional identity verification steps.
- Behavioral Data Validation: As we’ve mentioned, because our members earn rewards through activities beyond surveys — uploading receipts, shopping online, browsing, etc. — we can cross-reference what respondents tell us about themselves with their actual behavior. For example, a participant may report being single with no children. But if we observe a sudden, consistent increase in baby product purchases via uploaded receipts, our system flags that profile for potential updates. This keeps demographic data accurate and current.
- Registration Verification: When members sign up, Prodege requires SMS confirmation at least twice — once during registration and once during incentive redemption. Members must also click through email verification. On top of that, Prodege licenses TransUnion's TruValidate to identify suspicious IPs and risky VPNs.
- Manual Review of Open-Ended Responses: Prodege’s project management team manually reviews open-ended answers and replaces respondents who provide low-quality responses — including random characters, overly brief answers, copy-pasted text, and answers that don’t address the actual question.
- Speeding Detection: Our system monitors how long respondents spend on each question and flags those who complete surveys significantly faster than the average, which may indicate a lack of thoughtful engagement.
- Straight-Lining Detection: Prodege identifies respondents who select the same answer for multiple consecutive questions. This is a common sign of disengaged or automated responses.
- Red Herring Questions: Verification questions are strategically inserted throughout surveys to ensure respondents are paying attention and reading each question carefully.
This only scratches the surface. To explore the full picture of how Prodege protects data quality, we invite you to view our webinar: Driving Insights with Quality Audiences.
Interested in Learning More?
Prodege QualityShield neutralizes the threat of bot networks, AI-assisted cheating, and device manipulation, safeguarding the integrity of your data and insights.
But QualityShield is just one part of the picture. It sits on top of Prodege's owned and operated panel, where members aren't just taking surveys — they're playing games, uploading shopping receipts, earning cashback, and more. All of that activity gives Prodege continuous data points to verify who its members are, long before they ever enter a survey.
Together, it's end-to-end fraud protection that covers the entire respondent lifecycle.
We invite you to book an introductory call to learn more about how Prodege continues to be the industry leader in online sample quality.
Also, if you’re in the market for a powerful DIY survey tool, create a free Pollfish account, powered by Prodege’s panel with all the same fraud protections built in.
2. Dynata QualityScore™
Dynata is a global agency with access to first-party panels. QualityScore™ is their data quality and fraud detection solution.
Some of QualityScore’s capabilities and use cases include:
- Detecting fraud before it reaches your survey: QualityScore uses AI/ML to scan various data points in real-time, and removes and replaces poor quality responses before they make it to your dataset. This helps ensure faster fieldwork and less data cleaning.
- Gets smarter with every survey: Every foiled fraud attempt helps the system get smarter. Shady tricks feed their machine learning models so that they can identify emerging fraud patterns and stop the next wave of bad data before it even starts.
- Analyzing behavioral and technical signals: Through a multi-dimensional approach, QualityScore helps track suspicious on-screen movement analysis, nonsensical open-ended responses, survey speeding, IP address patterns, and more.
- AI-generated response detection: Use technology that identifies and filters out fraudulent activity and AI-generated survey responses before they reach your dataset.
- Privacy and security compliant: GDPR compliant and implements rigorous measures to protect member privacy.
Category #2: Integrated Survey Fraud Detection Tools
3. dtect
dtect is a data quality platform that helps prevent survey fraud.
They offer customizable security features based on your specific needs, and help flag and prevent:
- AI Usage: Detect people using AI assistance to answer questions, which helps ensure authentic human responses.
- AI Agents, Bots, and Automation: Prevents automated traffic, bots, and AI agents from reaching your surveys.
- Duplicate Entries: Detects suspicious activity and repeat submissions from the same devices, browsers, or IP addresses.
- Location Masking: Detects VPNs or spoofed locations, with the option to restrict access to approved countries.
- Suspicious Behaviors: Identifies suspicious traffic sources including virtual machines, untrusted browsers, and other fraud tactics.
New features are continually added to address emerging fraud threats.
4. Verisoul
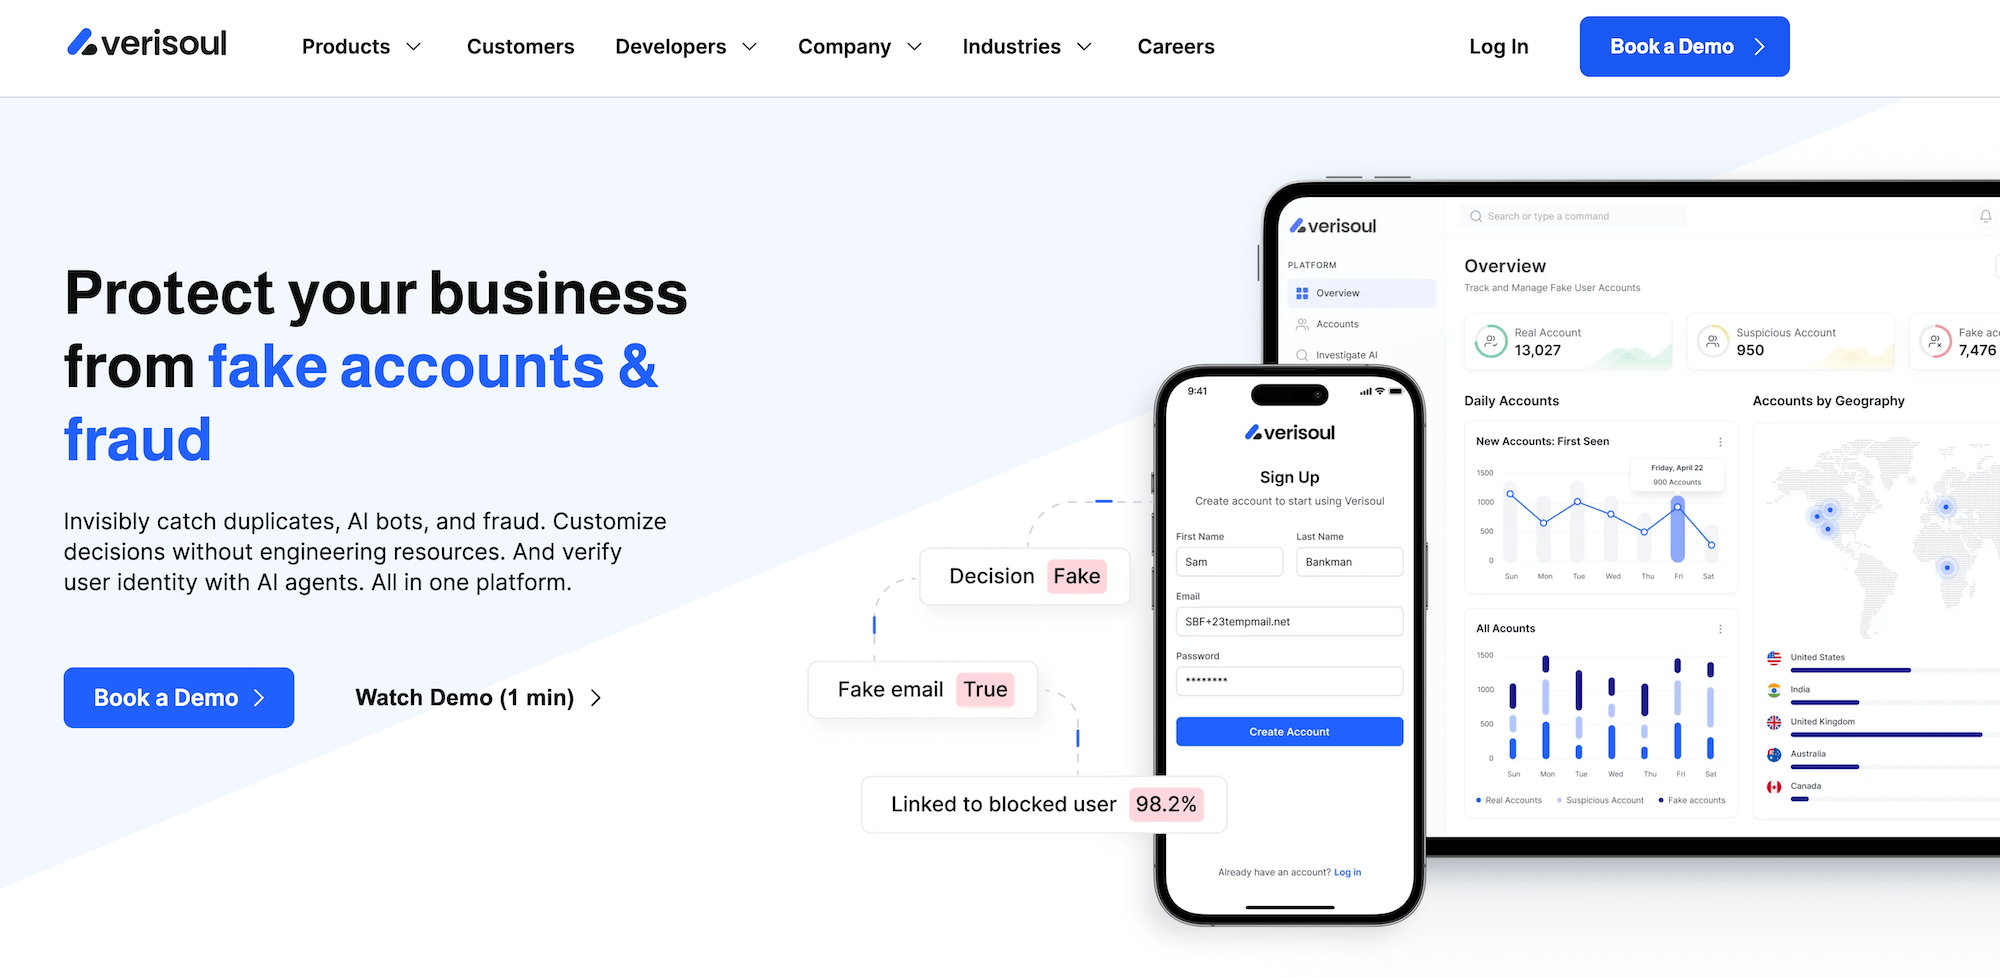
Verisoul can is another platform that can help you catch duplicates, AI bots, and fraud.
Notably, Verisoul is already built into Prodege QualityShield, so when you run a project with Prodege or Pollfish, you get Verisoul’s survey fraud protection layered on top of Prodege's owned-and-operated panel at no additional cost.
Some of Verisoul’s key capabilities and functionality include:
- Device Fingerprinting: Utilizes multiple fingerprints to automatically match accounts. They give you match probabilities, instead of Device IDs, to help minimize false positives and engineering work.
- Account Linking: Helps prevent multi-accounting abuse by visualizing user networks in real-time.
- Location Spoofing: Helps identify the true location of each user and whether it matches what they reported using un-spoofable signals.
- Email Intelligence: Blocks disposable and high risk emails by analyzing key factors such as email age, domain reputation, and more.
- Phone Intelligence: Helps detect VoIP, SIM farms, and burner numbers by cross referencing carrier data with social accounts and online history.
- Bot Detection: Helps prevent attacks from AI agents and automation. Analyzes advanced behavior and device signals.
- ID Check: Helps validate user IDs, prevents deepfakes, and confirms uniqueness. Utilizes document checks with behavioral and device data to prevent ID selling and synthetic fraud.
- FaceMatch:Verifies each person’s unique face with a simple selfie in 10 seconds. Helps prevent camera injection attacks and device spoofing.
5. Research Defender by Rep Data
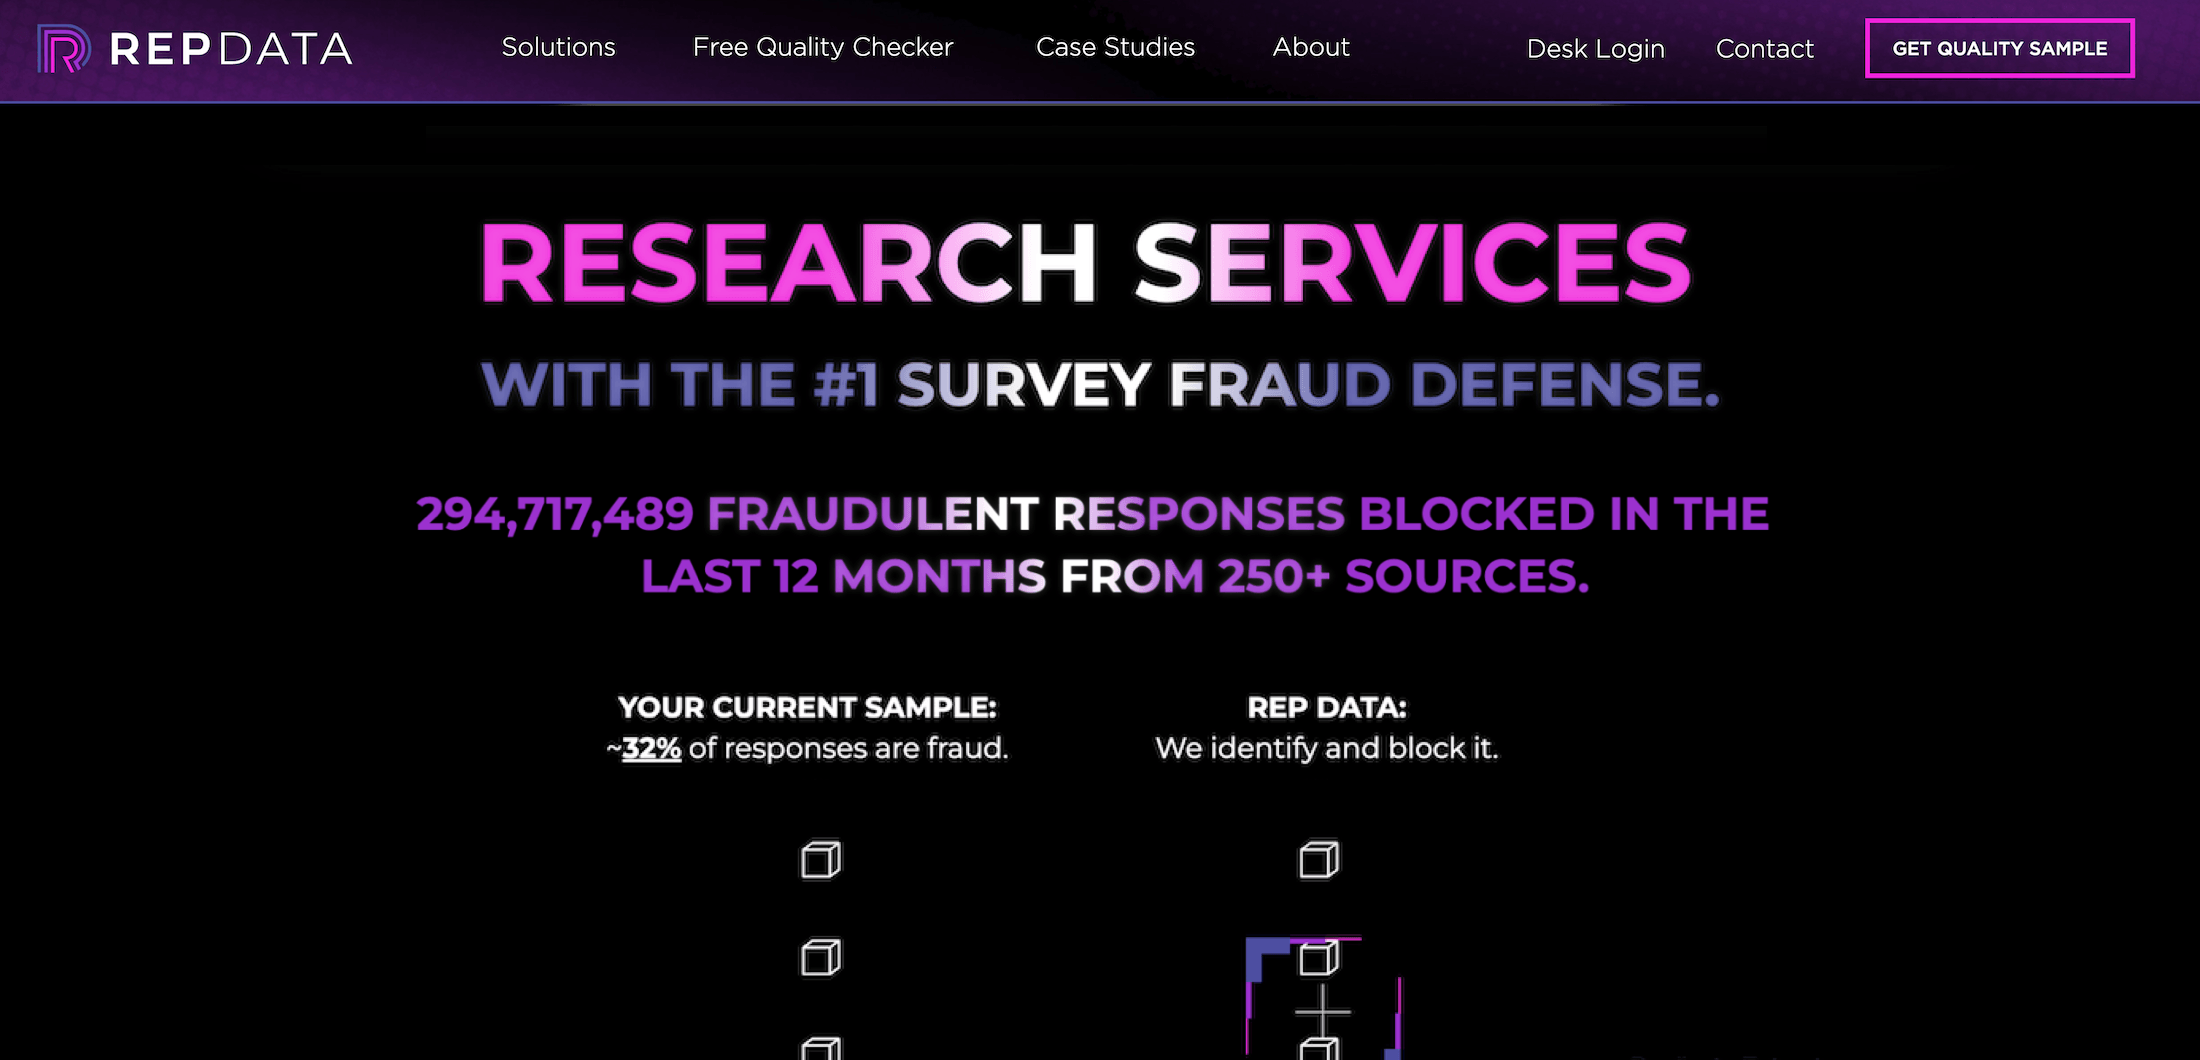
Rep Data is an aggregator that offers various data collection solutions for primary market research. Research Defender is their survey fraud detection offering.
As with any survey fraud detection provider, it’s important to be aware of false positives and verify accuracy.
Some of Research Defender’s key features and capabilities include:
- Signal Digital Fingerprint: Hardware, software, and browser attributes combine to fingerprint fraudsters, thwart their attempts, and help reduce scams.
- Hyper‑Activity Radar: Connects the dots across 200+ panels, marketplaces, and various data sources to stop duplication at an industry-wide supply level. Offers API access and AI-driven capabilities.
- No-Fly List: Makes one strike permanent on all sample sources with a dynamic suppression system.
- Second Shield AI: Learns from every response later overturned in 2 or more reconciliations of the same respondent by different clients, then feeds signals back.
- Suspicious Tech: Identifies emulators, TOR, VPNs, WebDev Tools, automation, proxy rotation, spoofing, crawlers, subnets, navigator webdrivers, obfuscation tech, etc.
- Behavioral Forensics: Tracks teleporting mouse jumps, ruler-straight cursor paths, zero-variance click intervals, machine-precision typing cadence, too-smooth constant-rate scrolling, identical start times across clusters, and more.
- AI Responses: Research Defender has a running list with hundreds of known patterns, with linguistic and signature structures of generative AI.
Interested in Learning More About Prodege’s Survey Fraud Detection Solutions?
Prodege (Pollfish’s parent company) owns and operates one of the largest consumer panels in the U.S., with 100M+ respondents.
Prodege QualityShield™ is our multi-layered fraud prevention system built into every project.
Book an introductory call to learn more about how Prodege continues to be the industry leader in online sample quality!
Brand Health Tracking: Best Practices & Choosing the Right Provider
Brand Health Tracking: Best Practices & Choosing the Right Provider
![]()
Brand health is one of the strongest indicators of long-term growth, yet most companies struggle to measure it in a way that reflects how markets actually move. One-off studies and isolated metrics rarely capture how perception is evolving, or what’s driving the change.
Brand health tracking solves this by providing a continuous, structured way to measure and benchmark how customers perceive your brand over time and whether your marketing and product efforts are actually working. It helps teams spot trends early, detect shifts in perception, and connect brand performance to real business outcomes.
At Prodege (Pollfish’s parent company), we’ve run large-scale tracking programs with organizations across various industries, giving us a front-row seat to what works, what doesn’t, and why.
In this guide, we’ll cover:
- What is brand health tracking?
- Brand health tracking use cases
- What a strong brand health tracking program should deliver
- How our full-service brand health tracking offering works
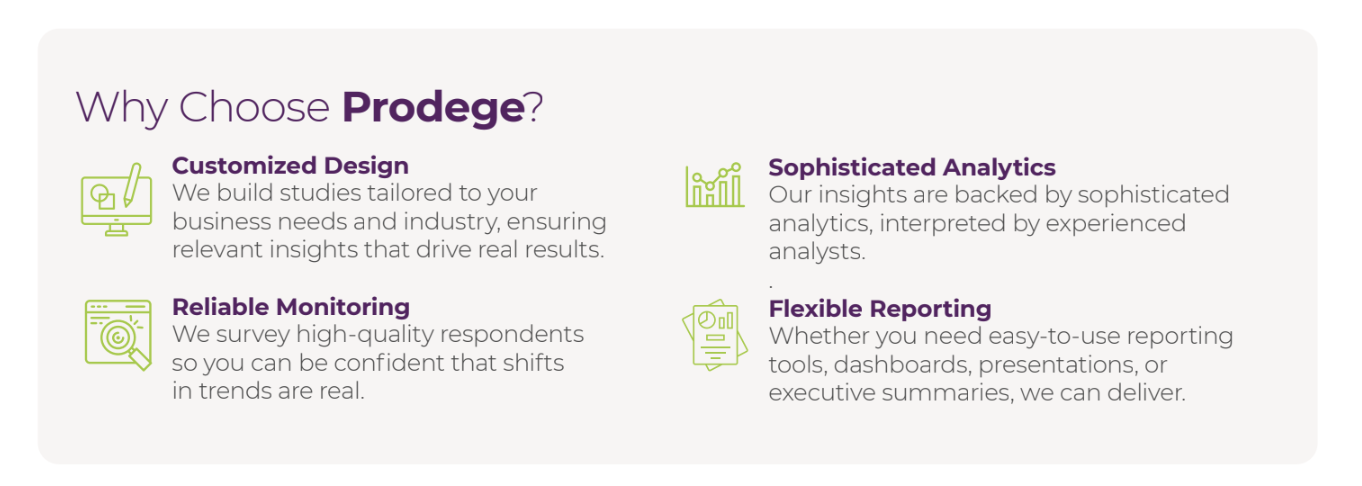
- The Prodege "secret sauce" & key benefits for brand health tracking
- Signs it may be time to transition your brand tracker
- Switching to Prodege from other brand health trackers
Note: Book an introductory call to inquire about Prodege’s full-service brand health tracking offering, where we handle the entire process for you. If you prefer a DIY option, sign up for a free Pollfish account, no credit card required.
What Is Brand Health Tracking?
Brand health tracking is an ongoing, survey-based research program that serves as a regular check-up for your brand. It consistently measures how current and potential customers perceive your brand over time, helping you evaluate whether your marketing, product development, and promotional efforts are actually working.
Unlike one-off research, brand health tracking is continuous. Data is collected in recurring surveys called “waves,” fielded at regular intervals (monthly, quarterly, or semi-annually, depending on category activity) with the same core questions asked each time to enable direct wave-over-wave comparisons.
This longitudinal view is what makes it so powerful: it allows you to identify trends, spot problems early, and measure the real-world impact of strategic decisions.
Brand Health Tracking Use Cases
Some of the most common applications for brand health tracking include:
✅ Validating marketing spend
Brand health tracking helps you determine if your marketing campaigns are communicating the intended message and shifting brand sentiment in the right direction. It can also help you discover if your message is being confused with competitors’ ads.
Example: Through brand health tracking, one Prodege client discovered that their new ads were so generic that consumers misattributed them to their biggest competitor. This insight sparked a creative redesign that saved millions in misdirected messaging.
✅ Diagnosing strengths and weaknesses
Brand health tracking reveals how consumers perceive your brand and whether it aligns or misaligns with your intended brand positioning. This highlights areas to improve brand strength as well as opportunities for strategic pivots.
Example: Through brand health tracking, one Prodege client (a lotion brand) aspiring for a luxury positioning discovered that customers saw them as an everyday value brand. By embracing this perception and offering value packs, they saw sales skyrocket.
✅ Spotting competitive threats
Brand health tracking serves as an early warning system that shows if emerging competitors are gaining share of voice and market share, enabling you to take a proactive defense strategy.
Example: One Prodege client, a category leader, used brand health tracking to discover that new competitors were winning with innovative packaging and flavors. This led them to innovate their own product offerings and retain their leadership position.
✅ Identifying market trends
Brand health tracking uncovers shifts in consumer needs and behaviors so you can capitalize on new trends before the competition does.
Example: In the air freshener category, brand health tracking spotted a major shift from consumers preferring floral scents to clean/fresh scents. This helped one Prodege client shift focus to spotlight their fresh scents and capture massive growth.
What a Strong Brand Health Tracking Program Should Deliver
The success of your brand health tracking program depends on its ability to offer several elements, including:
- Reliable, consistent data you can trust: High-quality data is essential for ensuring that observed trends are real market shifts and not just noise.
- A clear understanding of brand performance across the customer journey: Brand health tracking should look holistically at the entire customer journey — from awareness to loyalty — to pinpoint exactly where your brand is winning or losing potential customers.
- Insights that go beyond metrics to explain what’s driving change: A strong program delivers strategic guidance, not just raw data.
- Accessible, usable insights across the organization: Great brand health tracking makes insights not only more stable but also more visible and actionable.
- A system that evolves with the market: Your brand health tracker should adapt to make room for new and emerging channels, topics, and brand segments.
How Our Full-Service Brand Health Tracking Offering Works
Prodege (Pollfish’s parent company) is our full-service brand health tracking provider known for exceptional data quality, which you can read more about in our article on the 3 Survey Data Quality Issues Sabotaging Your Research.
We serve as a partner, not just a vendor. This is a significant departure from many competitors’ rigid, productized offerings. Here’s how that difference plays out in practice:
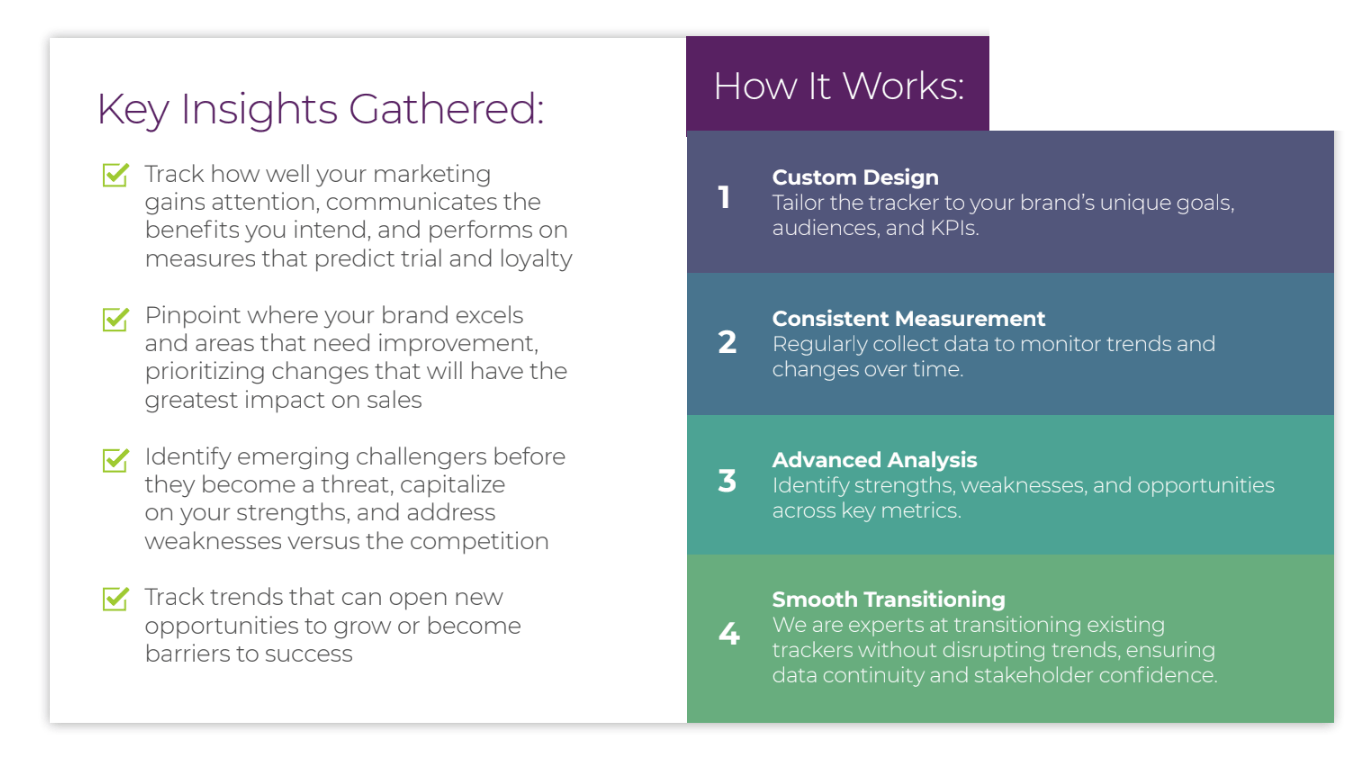
The Prodege Methodology: Building a Better Tracker
We design and execute brand health tracking programs through a structured framework centered on the full customer journey and advanced analytics.
The goal is to understand where a brand is losing potential customers on their journey from awareness to loyalty.
Let’s take a look at each stage in the funnel and how to optimize your brand strategy:
✅ Awareness: “Do people know you exist?”
- What it is: Measures a brand's recall, both unprompted ("Top of Mind") and when prompted from a list ("Aided").
- Why it matters: This is the foundational hurdle; a brand cannot be purchased if it is not known.
- Prodege Advantage: Panel quality is crucial for consistent tracking. When brand awareness changes, our clients can trust it is due to their marketing efforts, not sample inconsistencies.
✅ Familiarity & Perceptions: “Do people know what you stand for?”
- What it is: Assesses what consumers think about the brand and its associations (e.g., "good value," "high quality," "innovative").
- Why it matters: Uncovers critical gaps between the brand's intended message and actual consumer perceptions — the core of brand equity.
- Prodege Advantage: Custom design shines here. We’ll work with you to define unique and category-relevant attributes, providing richer insights than generic templates.
✅ Consideration: “Will people spend their money on you?”
- What it is: Measures brand preference and whether a brand makes the "shortlist" for actual purchase among consumers who are aware of it.
- Why it matters: This is a critical Key Performance Indicator (KPI) that bridges brand perception and consumer action, and helps measure a brand’s success.
- Prodege Advantage: Our consulting expertise adds value by analyzing the "why" behind consideration scores, helping you convert aware non-considerers into customers.
✅ Usage & Loyalty: “Will they come back for more?”
- What it is: Measures trial, customer satisfaction, and likelihood to purchase again or recommend (Net Promoter Score - NPS).
- Why it matters: It is more cost-effective to retain customers than acquire new ones. This stage measures brand "stickiness" and predicts long-term viability, brand loyalty, and customer loyalty.
- Prodege Advantage: Our methodology is flexible. We customize it to match each client's business model and key metrics, whether it's NPS and retention for a subscription service or share of pantry for a snack brand.
From Data to Decisions: The Prodege "Secret Sauce" & Key Benefits for Brand Health Tracking
Beyond the structured brand tracking framework above to measure brand health, Prodege offers several additional benefits that set our program apart:
✅ Key Driver Analysis (KDA)
Instead of just asking consumers what is important, Prodege uses advanced analytics to determine which brand attributes actually predict purchase behavior. This prevents organizations from investing in features that do not truly drive sales.
✅ Actionable recommendations
Our experienced consultants connect the data points to provide strategic direction.
With other brand trackers, your output might be: “Your consideration is down 3%.”
With Prodege, you’ll get a comprehensive recommendation: “Your consideration is down 3% among millennials, and our analysis shows it’s because a competitor is winning on the perception of ‘sustainability,’ which has become a key driver in the category. We recommend testing messaging that highlights your eco-friendly packaging.”
✅ Flex questions
A Flex section is built into your brand health tracker to ask about hot topics, delivering fresh insights and customer feedback in every wave without requiring a separate study. This keeps the tracker relevant and gives stakeholders a reason to engage with each new wave of results.
For a food company, one wave’s flex section might explore consumer attitudes toward GLP-1 medications and their impact on snacking behavior. The next wave might focus on protein perceptions. And so on.
✅ Dynamic dashboards
Unlike many competitors who deliver static reports and data tables, our dynamic Insights Builder empowers you to explore the data yourself. You can filter by demographics, time periods, or custom segments, increasing transparency and keeping insights accessible long after we formally present them to you.
Historical data from previous tracking providers can be mapped into these dashboards as well, so you see your full data history in one place from day one.
✅ High-quality, reliable data
As we explore in-depth in our article on 3 Survey Data Quality Issues Sabotaging Your Research, data quality has been central to Prodege's DNA for over 15 years. We back that commitment with a dedicated 40-person Panel Support, Security, and Compliance Department focused exclusively on maintaining the integrity of our panel and the research it powers.
What makes our approach unique starts with something most providers don’t offer: we own and operate our own first-party audience panels, with over 100 million respondents across 125+ countries. And because our panelists do far more than just take surveys (they upload shopping receipts, play games, watch videos, and more to earn rewards), we can verify identity and engagement quality through real behavioral signals, not just survey responses alone.
Because panelists share real purchase receipts, we can build audience segments based on verified actions rather than claimed preferences. For example, you can target respondents and your target audience by:
- Stores visited: Consumers who’ve visited Target, Costco, 7-Eleven, Papa John's, etc.
- Products purchased: Consumers who’ve purchased Ruffles, Dr. Pepper, Angel Soft, Tabasco, etc.
- Websites browsed: Consumers who’ve interacted with sites like CNN, Reddit, Quora, etc.
Precise behavioral filters ensure your brand health tracker is built on data you can reliably trust, yielding more actionable insights.
✅ Expert white-glove service
Our team consists of consultants with decades of collective market research experience, including members from firms such as Hall & Partners, Ipsos, Kantar, Lieberman Research, Nielsen, NPD, and others. And that experience carries through to every client interaction.
Every project includes a dedicated sample manager and project manager, with additional specialists added based on scope, so you always have a direct line to someone who knows your tracker inside and out.
✅ Better value
Because we own and operate our proprietary audience panels (including Swagbucks, MyPoints, InboxDollars, and others), we can deliver custom solutions at a more competitive price than traditional providers. You get a flexible, tailored program with deeper insights and stronger strategic guidance, without paying a premium for rigid, one-size-fits-all “Big Box” providers.
Signs It May Be Time to Transition Your Brand Tracker
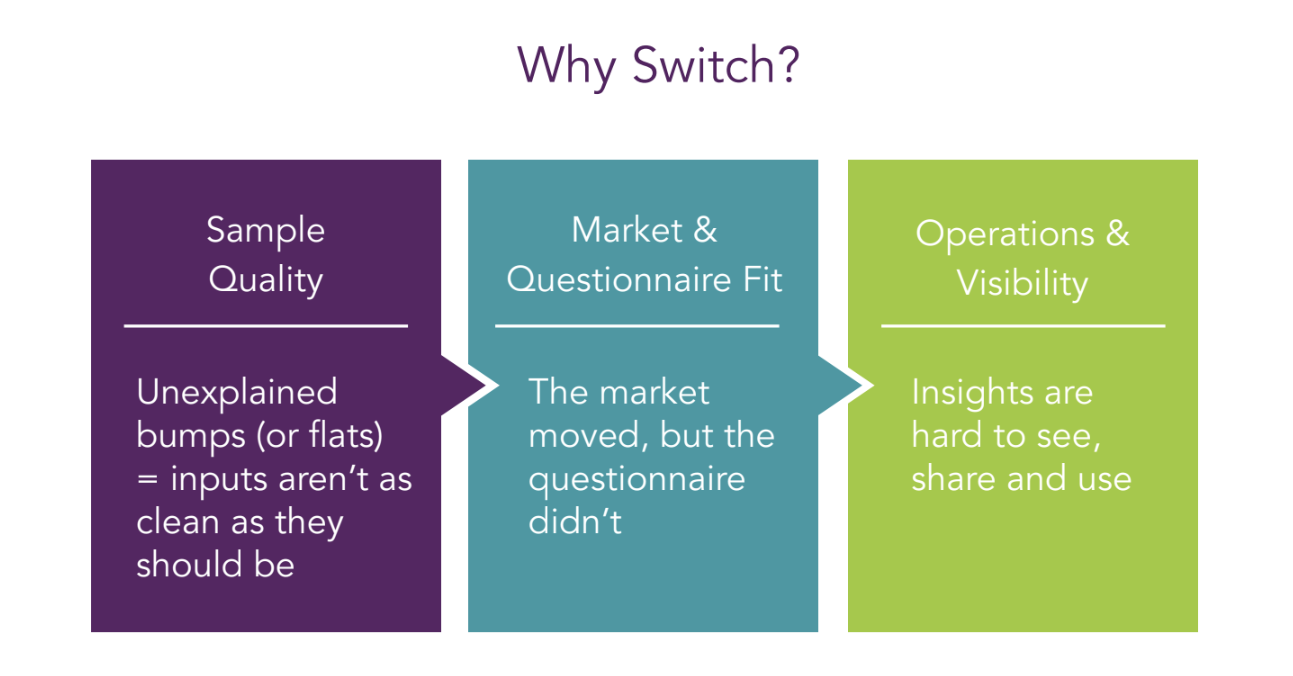
Not every tracking program delivers the value it should. If any of the following signals sound familiar, it may be worth evaluating whether your current setup is still meeting your needs.
Sample Quality: Unexplained bumps (or flats) signal inputs aren’t as clean as they should be
You open your tracker results on Monday morning and see an unexpected jump, but there was no PR event, no promotion, no market shift to explain it. Or the reverse happens: a major campaign launches and your trend line barely moves.
These patterns can be signs of sample quality issues. When the data source isn’t clean or consistent enough from wave to wave, the resulting fluctuations reflect sampling noise rather than genuine market shifts. If your team is regularly debating whether a data movement is “real” or just an artifact, that’s a signal worth taking seriously.
Market & Questionnaire Fit: The market has evolved, but the questionnaire hasn’t
It's a new quarter. The market is evolving. There are new competitors and purchase drivers, new social media channels, and novel ways consumers discover and evaluate products.
Your stakeholders are asking: we see the what, but why is it happening? You scan the survey, and the language feels a step behind. It's capturing yesterday's habits, not today's decisions.
This often happens because teams are understandably hesitant to change questionnaire wording for fear of disrupting trend lines. But the result is a tracker that shows the outcomes without enough of the why, and misses the new forces shaping your market.
Operations & Visibility: Insights are hard to see, share, and use
It’s readout week. Your team is scrambling for exports, screenshots, and email threads. Nobody is sure which data cut is the latest. Stakeholders need specific views of the data, and everything stalls.
The insight might be there, but it’s buried under operational friction.
If accessing and sharing your tracking results requires significant manual effort, the tracker’s practical value to the organization is diminished by how it’s delivered.
None of these signals means anyone did anything wrong. Markets evolve, tools age, and needs change. But if you recognize one or more of these patterns, it’s worth exploring what a transition could look like.
Switching to Prodege From Other Brand Health Trackers
Even when the signs point toward a change, many organizations hesitate to switch brand tracking providers for a couple of key reasons:
- Fear of the unknown: "What will change? What might break?"
- Fear of losing trends: "If we improve, do we lose the history?"
These concerns are legitimate, and we address them directly.
A major advantage of working with Prodege is how easy we make it to switch from other brand trackers without losing important data. We offer a fully documented and transparent transition process designed to protect continuity while making necessary enhancements.
Our transition process is designed to achieve four key outcomes:
- Protect trend lines where they matter.
- Improve quality where it’s safe and necessary.
- Reduce internal lift over time through automation and better tools.
- Provide faster access to results that people actually use.
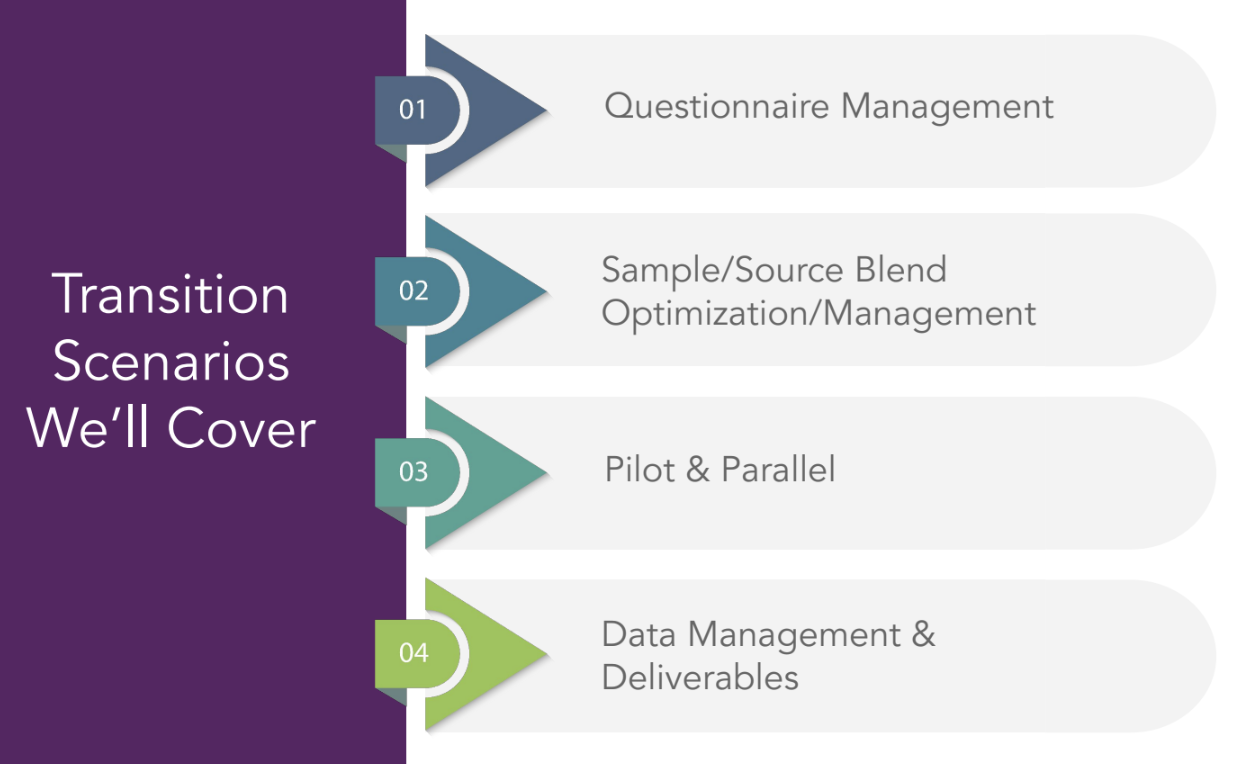
Prodege manages the transition through 4 key scenarios, ensuring a calm and methodical process:
✅ Questionnaire Management
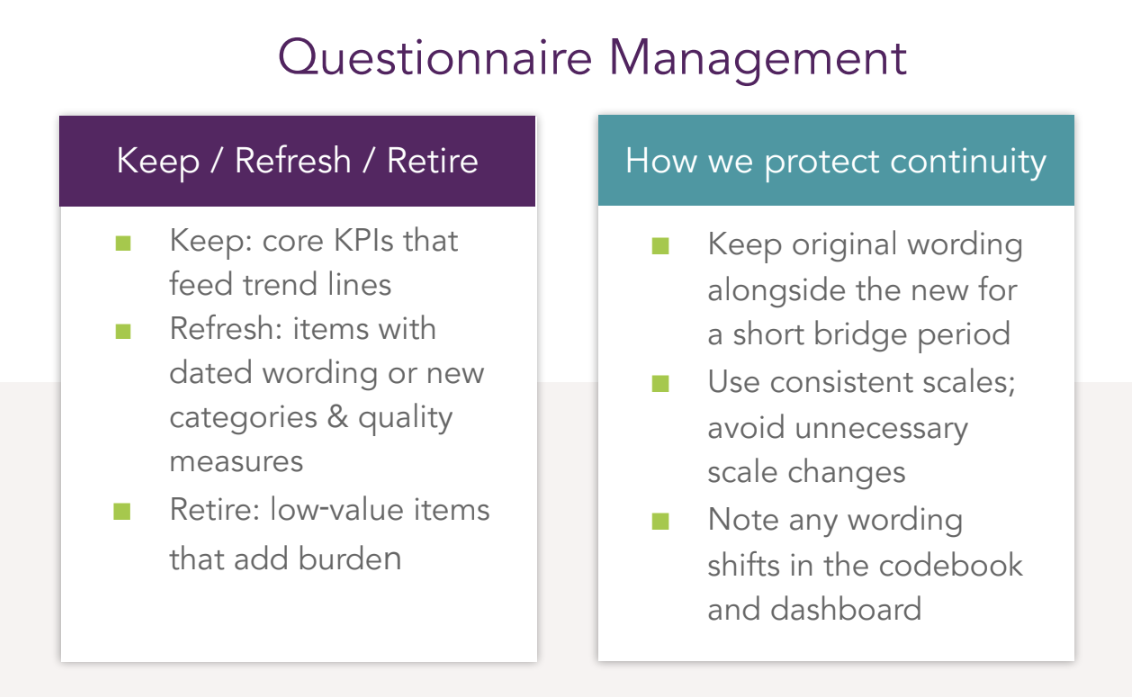
When transitioning a tracker, one of the biggest priorities is balancing continuity with the opportunity to improve. The goal is to protect the integrity of existing insights while enhancing the design, boosting quality, and reducing unnecessary burden.
We don’t want to carry along outdated or low-value questions simply because they’ve always been there. But we also need to safeguard valuable trend data. We approach this through a “Keep / Refresh / Retire” framework:
Keep: Core KPIs are non-negotiable. These are the key brand health metrics that feed your trend lines and are essential for business decisions. They’re preserved exactly as they are — with minimal to no changes in wording, structure, or placement within the questionnaire. This level of consistency is what protects continuity and ensures stakeholders can still rely on long-term trends.
Refresh: Some questions may have dated wording or may be missing newer categories that reflect today’s market reality. For instance:
- Brand lists that need updating
- Product formats or general answer lists that have evolved
- Digital channels that weren’t previously included
If certain responses were previously captured as open ends, this is a good opportunity to incorporate the most frequent mentions into the code frame for cleaner, more actionable data.
This stage is also the perfect moment to strengthen quality controls by introducing or refining attention checks, trap questions, and inconsistency flags. These measures improve data reliability and reduce the time teams spend on manual quality checks.
Retire: Some questions no longer serve a purpose (e.g., items stakeholders don’t actively use, or those that add unnecessary length and complexity to the survey and customer experience). Retiring low-value questions streamlines the respondent experience, reduces survey fatigue, and often improves overall data quality. It also frees up room for new, more relevant items that could provide greater business and brand value.
How we protect continuity:
- Keep original wording running alongside refreshed wording for a short bridge period, allowing direct comparison between old and new results
- Maintain consistent scales, as even a small adjustment to the number of points can disrupt established trends
- Clearly document any wording or design updates in the codebook and dashboards, ensuring full transparency for anyone analyzing or reporting the data
A tracker transition isn’t just about migrating data or switching suppliers. It’s an opportunity to modernize and future-proof your research in real-time. And a trusted, experienced partner can make that process significantly smoother. We provide a second pair of eyes to catch potential issues early, validate survey design changes, and ensure quality measures are applied correctly.
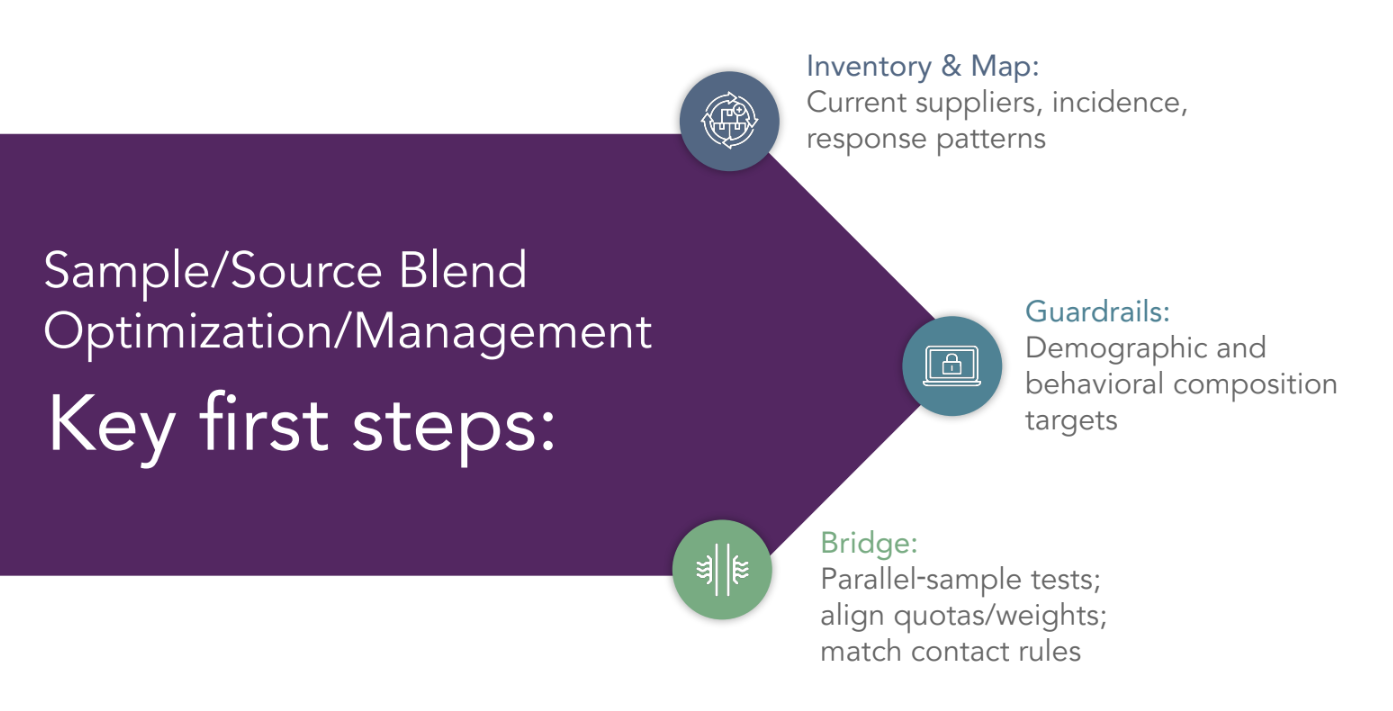
✅ Sample/Source Blend Optimization
When moving a tracker to a new vendor, one of the most sensitive areas is sample and source management. If this isn’t handled correctly, it can create shifts in who you’re hearing from, which risks distorting the trends.
Every online panel is unique. Differences in recruitment methods, validation processes, and the mix of sources each panel relies on (including whether they leverage partner networks) can all influence who ends up in a sample. These variations can have a significant impact on outcomes, so it’s important to understand a panel’s composition upfront to ensure consistency and reliability in the results.
The way to avoid skewing crucial results is to follow a structured transition process:
Inventory & Map: We take a close look at the current supplier mix:
- Who is providing the sample? What are the proportions by provider?
- Are they using owned-and-operated panels or leveraging partner networks?
- What do incidence rates look like per source?
- What have response patterns been historically?
All of this helps establish the baseline you need to match.
Set Guardrails: We set demographic and behavioral targets or quotas to ensure the sample composition reflects the same population you’ve been tracking. This is what prevents sudden changes in the respondent profile.
Bridge: If time allows, we run a bridge test with parallel samples, aligning quotas and weights across all sources. We also match key contact rules like frequency of outreach, exclusions, and targeting schedules so that respondents have a similar experience across all vendors.
✅ Pilot & Parallel Testing
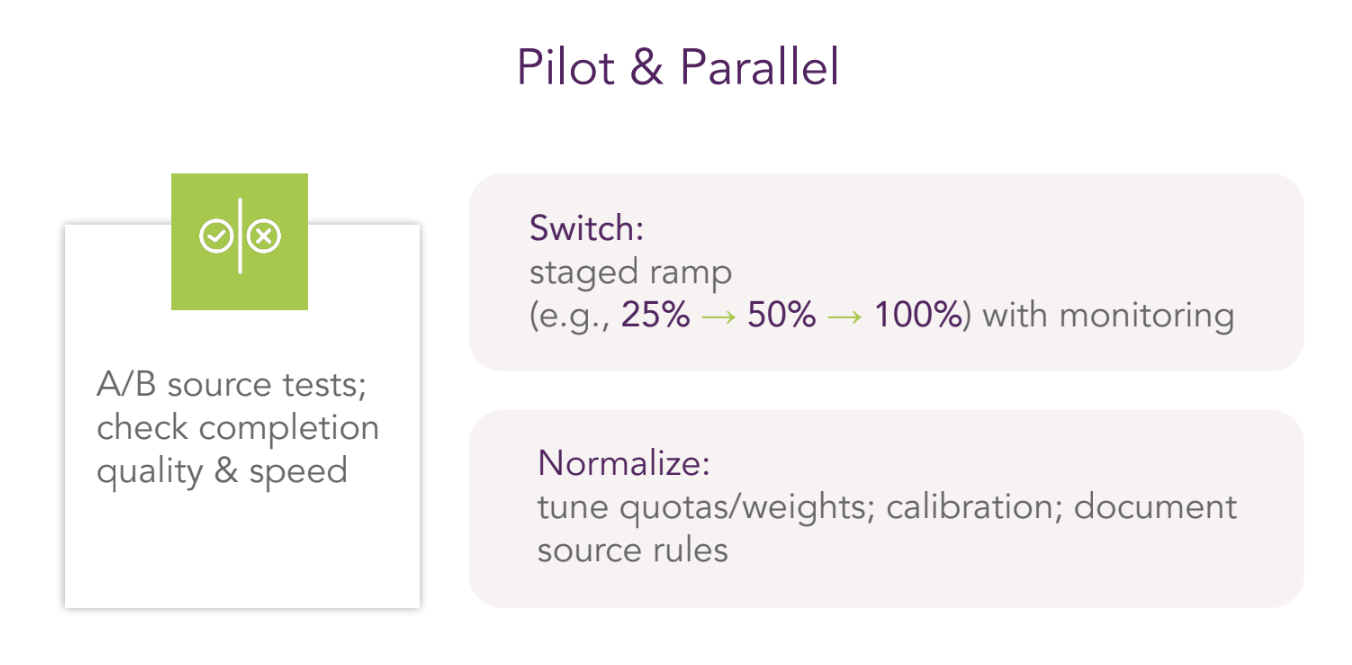
Before making any big moves, it’s a good idea to run A/B source tests in parallel. This lets you compare data side by side — completion quality, speed, and consistency — to confirm the new source can perform at the same level, or ideally better, than the existing ones.
The transition to a new source should never happen as a hard cut. A sudden change can introduce unnecessary risks and make it difficult to pinpoint the cause of any data shifts.
Instead, we recommend a staged ramp-up approach. For example:
- Begin with no more than 25% of traffic from the new source
- Evaluate results, then gradually increase to 50%
- Move to 100% only once stability is confirmed
At each stage, data should be monitored closely — not just for incidence and response rates, but also for demographic balance, speed, and overall quality. This phased approach allows you to identify and resolve any issues early, before they affect the full sample.
If new quality measures are introduced at the same time — for example, enhanced attention checks or trap questions — the staged ramp also allows you to compare results directly between old and new sources. This makes it easier to validate both the quality of the new source and the effectiveness of new checks, giving added confidence before the full switch is complete.
Once the transition is complete, we fine-tune quotas and weights, calibrate where needed, and fully document all source rules. This ensures long-term stability and provides transparency for future teams and audits.
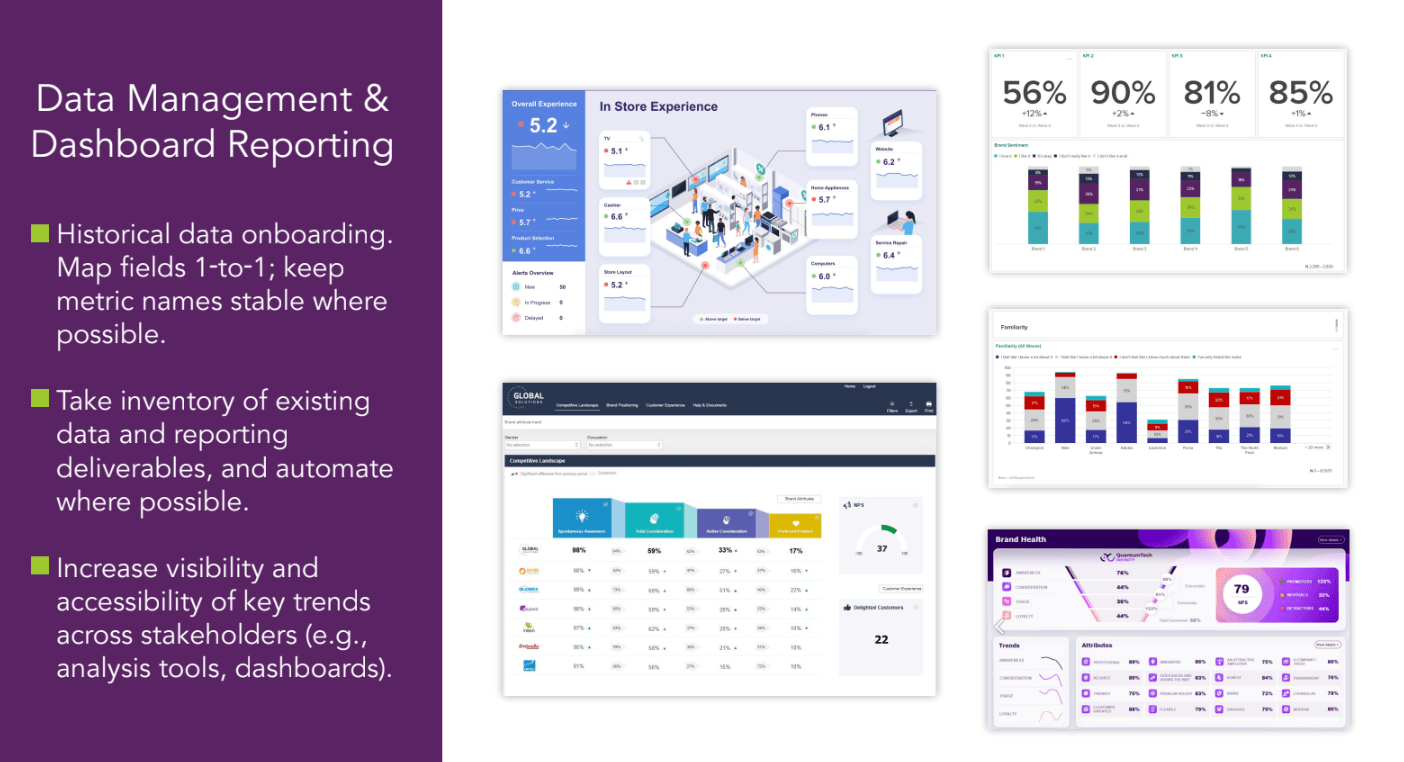
✅ Data Management & Dashboard Reporting
When transitioning a tracker, data management and dashboard continuity are just as crucial as the survey itself.
Start by taking stock of what exists: historical datasets, dashboard views, filters, user groups, exports, and any automated processes. Understanding the current setup gives you a clear roadmap for migration.
Historical data onboarding: All historical data must be onboarded so everything sits in one place. We map fields one-to-one wherever possible and keep metric names consistent. This ensures that historical trends remain interoperable.
Inventory & automation: We take stock of all existing data and reporting deliverables, then automate wherever possible. This reduces manual effort, cuts down errors, and ensures reporting comes out faster and more reliably.
Visibility & accessibility: A transition isn’t just about replicating what you had before. It’s also a chance to increase accessibility of key insights. That might mean surfacing trends in a more user-friendly dashboard and giving stakeholders role-based access. The goal is to make insights not just stable, but more visible and actionable.
A key takeaway is that onboarding historical data isn't just housekeeping — it’s how we make sure stakeholders can trust and read the data easily from day one, while setting the foundation for smoother and improved reporting going forward.
Learn More About Our Brand Health Tracking Offerings
Whether you're just starting out or looking to improve how you're tracking brand health today, we're here to help.
We invite you to:
- Book an introductory call to discuss our full-service brand health tracking offering, fulfilled through parent company Prodege.
- Create a free Pollfish account, no credit card required, to explore our DIY survey tool and launch your brand health tracking survey.

8 Top Full-Service Market Research Companies (In-Depth Look)
8 Top Full-Service Market Research Companies (In-Depth Look)

Companies often turn to full-service market research firms for expert support across various areas, whether that's quantitative surveys, qualitative methods like focus groups and interviews, and more. This can include everything from study design and audience targeting to data analysis and presenting clear, actionable insights.
When choosing a full-service market research company, you should look for:
- A commitment to high data quality: Is data accuracy an afterthought, or is it at the core of the company’s operations and decision-making?
- Reliable audience panel: Does the company own and operate its own first-party audience network to ensure authentic, reliable responses? Or do they rely on third-party audiences with unknown quality standards?
- Dedicated specialists assigned to your project: Will you work with dedicated specialists who know your project inside and out? Or will you be fighting for time working with an employee who is spread too thin over multiple projects?
- Flexible service options: Can you choose between full-service, end-to-end support, or targeted help in specific areas? And does the company offer both quantitative and qualitative methods, such as surveys, interviews, focus groups, and more?
- Powerful data visualization tools: Does the company provide in-depth analysis with custom charts and reports tailored to your needs? Or are you limited to generic, one-size-fits-all templates?
To help you choose the best full-service market research company for your needs, we’ve compiled this list of the top options. We’ll start with our parent company, Prodege.
Best Full-Service Market Research Companies
1. Prodege
Prodege is a full-service market research company renowned for exceptional survey data quality. Prodege is the world’s largest single-panel owner, with over 100 million respondents across 125+ countries. (Learn more about our approach to data quality).
Flexible Service Offerings
We offer two ways to work together:
- An end-to-end service where Prodege manages the entire survey process from start to finish.
- Support with specific areas such as:
- Research design
- Survey programming
- Sample & fielding
- Data processing & analysis
- Reporting
Both quantitative methods (surveys) and qualitative services (interviews, focus groups) are available.
Here's what Remesh had to say about working with us:
Dedicated, Expert Account Specialists
Every Prodege project is assigned its own dedicated specialists to ensure your company gets the attention it deserves. At minimum, this typically includes a sample manager and a project manager, with additional specialized roles added based on your needs.
This means reliable follow-through, fast responses, and expert guidance from seasoned market research professionals — not a single overworked account rep juggling dozens of clients at once.
Pollfish: DIY Survey Software from Prodege
Beyond full-service market research services, Prodege also owns and operates Pollfish, a powerful DIY survey platform built on the same commitment to data quality.
You can learn more about running market research surveys with Pollfish in our article on the best survey software for market research.
Up next, we’ll examine several of Prodege’s key advantages, including:
- Commitment to high data quality
- First-party audience network for reliable data
- Powerful data visualization tools
Let’s dive in.
Commitment to High Data Quality
The Issue: Data quality is arguably the most important factor when choosing a market research partner — especially as AI bots and fraudulent responses have become more common. Even a perfectly designed survey can produce misleading results if response quality is compromised.
When you're basing major business decisions on research findings, poor data quality becomes a costly risk.
Our approach: That's why data quality is foundational to everything we do at Prodege. We have a 40-person Panel Support, Security, and Compliance Department dedicated specifically to this issue. For a deeper look at our approach, see our article: 3 Survey Data Quality Issues Sabotaging Your Research (& How We Fix Them).
First-Party Audience Network for Reliable Data
To ensure the reliability and authenticity of survey responses, Prodege's market research company owns and operates its own first-party audience networks. This is in contrast to many market research firms that purchase responses from third-party networks with unknown quality standards.
Here are some examples of Prodege’s rigorous quality checks:
✅ 14-day evaluation period
New members of Prodege’s audience panel must complete internal test surveys for their first 14 days, allowing us to evaluate response quality. Access to client-facing surveys is granted only after they demonstrate consistently high-quality, thoughtful answers.
✅ Identity verification through purchase receipts
Members earn rewards through multiple activities, including uploading purchase receipts. This behavior is impossible for bots to replicate, confirming members are real people while validating their self-reported preferences. For instance, if someone indicates they follow a vegetarian diet but their receipts regularly include meat products, the system might identify the discrepancy and prompt a profile review.
✅ Opt-in survey participation
Unlike other panels that bombard panelists with aggressive emails and texts, Prodege’s audience members only take surveys when they want to. Our dashboard offers games, videos, and other engaging activities, making surveys just one option among many for earning rewards. Members participate when they're genuinely motivated, resulting in higher-quality responses.
✅ Trust quality scoring
Members who provide consistently thoughtful responses earn access to higher-paying opportunities, creating a clear incentive for quality.
✅ Advanced anti-fraud procedures
Prodege applies a variety of anti-fraud technologies and processes, including unique user IDs, anti-VPN measures, trap questions, speeding prevention, straight-lining detection, manual human review of open-text responses, and many more.
These are just some examples of the many measures Prodege takes to ensure high-quality data.
Powerful Data Visualization Tools
Over the years, Prodege has acquired multiple proprietary tech platforms to deliver faster, higher-quality services at lower costs. One of the platforms Prodege customers have access to is Insights Builder, a powerful data analysis and visualization tool.
Insights Builder lets you manipulate complex survey data, create sophisticated graphs, perform statistical testing, and more, all within minutes and directly within the platform. This saves hours of manual work in external tools, significantly improving both project timelines and costs.
As BuzzFeed has noted:
Interested in Learning More About Prodege?
We invite you to:
2. Drive Research
Drive Research is a full-service market research company.
Some of their services include:
- Online Surveys
- Customer Surveys
- Employee Surveys
- Qualitative Recruiting
- Focus Groups
- In-Home Usage Tests (IHUTs)
- PR Surveys
- Advanced Analytics
Overall, they’re a solid market research agency that offers various market research solutions.
3. Touchstone Research

Touchstone Research is a full-service market research firm.
Some of their services include:
- Qualitative research
- Quantitative research
- Survey Design
- Recruitment and fieldwork
- Insight communities and online panels
- UX research
- Dial testing
- Secure content testing (SCT)
- Youth and family insights
- Global research
- Augmented sampling
- Conversational AI surveys
Overall, they’re a solid provider for gaining consumer insights and understanding market trends across various demographics.
4. ISG

ISG is a full-service market research provider.
Some of their offerings include:
- Service Provider Research
- Software Provider Research
- Benchmarking & Price Research
- Market Intelligence
Overall, they’re a solid data-driven market research firm that can help you get a pulse on public opinion.
5. Research America
Research America is a full-service market research company.
Some of their services and solutions include:
- Innovation and Development
- Ad Tracking and Brand Messaging
- Landscaping and Benchmarking
- Presentation and Reporting
- Health and Sustainability
- Strategic Consulting
- Qualitative Marketing Research
- Quantitative Data Collection
6. Kantar

Kantar is a full-service market research platform.
Some of their solutions include:
- Brand Tracking
- Brand Strategy
- Creative Testing and Optimisation
- Media Effectiveness
- Innovation and Product Development
- Customer Experience
- Research Services and Survey Solutions
- Qualitative research
- Kantar's Consulting Practice
- Sustainability
- Consumer and Shopper Behaviour
- AI-Powered Capabilities
- Qual Research
They’re a solid provider for custom research on your target audience via several methodologies. They serve various industries.
7. Ipsos

Ipsos is a full-service market research firm.
Some of their solutions include:
- Market Strategy & Understanding
- Innovation
- Creative Excellence
- Brand Health Tracking
- Ipsos MMA
- Strategy3
- Channel Performance
- Simstore
- Observer
- User Experience
Overall, it’s a solid consulting firm that can help you make more strategic, smarter decisions.
8. SG Analytics
SG Analytics is a full-service market research provider.
Some of their solutions include:
- Market Segmentation Services
- Product Development Research
- User Acceptance Testing (UAT) Studies
- Concept Testing
- Competitor Analysis
- Ad Effectiveness
- Pricing Strategy
- Customer Satisfaction and Experience
- Market Entry Strategies
- Brand Awareness and Positioning
- Social and Environmental Studies
- Consumer Behavior Research
Overall, it’s a great provider for helping you make strategic decisions.
Interested in Learning More About Prodege?
We invite you to:

7 Best Marketing Survey Software in 2026 (Key Factors)
7 Best Marketing Survey Software in 2026 (Key Factors)

Marketing teams run surveys for a number of reasons, including testing ads, measuring brand perception, validating product demand, and understanding how different segments think, behave, and buy.
When choosing the right marketing survey software, it’s important to pay attention to these factors:
- Data quality: Marketing survey results are often used to justify major business decisions with significant budgets. As bots and survey fraud become more common, survey audience respondent quality is increasingly essential to make sure your decisions are based on solid information.
- Transparent, pay-per-response pricing: The cost of your survey should be transparent, with no hidden fees or unexpected charges.
- Fast turnaround times: It’s important that you get your survey results quickly so you can make decisions and launch without delays.
- Advanced audience targeting: To help you reach the relevant audience (whether that’s general population or hard-to-reach, specialized groups), the right platform should offer granular demographic and behavioral filters.
- Sophisticated questionnaire design tools: Look for a tool that offers advanced question types (e.g., matrix questions, conjoint analysis, multimedia elements) and advanced skip logic and branching, so you have full flexibility in survey design.
- Robust analytics and reporting: To save time analyzing data and creating reports in external tools, choose a software that offers advanced data filtering capabilities, multi-variable charts, and statistical testing directly within the platform.
With these criteria in mind, here is our list of the top 7 marketing survey software, starting with our own marketing survey tool, Pollfish.
Top Marketing Survey Software
1. Pollfish
Pollfish, our marketing survey software, is renowned for its high-quality audience data. We utilize our parent company Prodege’s first-party network of over 100 million respondents across 125+ countries, ensuring reliable data and quick turnaround times.
In this section, we’ll discuss some of the benefits of Pollfish in more detail, including:
- High-quality data you can reliably base decisions on
- Transparent, pay-per-response pricing with no hidden fees
- Fast turnaround times ranging from a few hours for general population surveys (e.g., U.S. adults) and several days for more niche groups (e.g., new parents of infants under 12 months)
- Advanced audience targeting, allowing you to reach the specific group you’re interested in learning from
- Sophisticated questionnaire design tools to meet your exact survey goals
- Robust analytics and reporting directly within the platform — no exporting necessary
Note: Pollfish is our DIY survey platform, but we also offer full-service market research through our parent company, Prodege. We can handle the entire research process (or help in specific areas), freeing your team to focus on other priorities. Contact us about full-service options.
High-Quality Data for Reliable Decision-Making
Many survey platforms fail to address critical data quality issues like:
- Bots posing as real survey respondents
- Outdated demographic information and respondent profiles
- Contradictory or rushed responses
At Pollfish, we prioritize data quality above all else, and have a 40-person Support, Security, and Compliance team dedicated specifically to this area. Learn more in our article: 3 Survey Data Quality Issues Sabotaging Your Research (& How We Fix Them).
Some of our data quality control measures include:
❇️ 14-Day Evaluation Period
New members start with a two-week probationary period, completing internal quality assessments before gaining access to client surveys. We remove members who fail to meet our standards, while those who pass face continued spot checks to maintain quality.
❇️ Behavioral Data Validation
Our audience panel members don't just complete surveys — they also upload shopping receipts, play games, and perform other activities to earn rewards.
This behavioral data helps us validate what respondents tell us about themselves.
For example, if someone claims to be a regular coffee drinker but their purchase history (based on uploaded receipts) shows no coffee purchases over several months, our system may flag the discrepancy. This ongoing validation keeps respondent profiles accurate and current.
❇️ Manual Review of Open-Ended Responses
Our team manually reviews open-ended responses, filtering out obvious problems such as nonsense or single-word answers.
Beyond that, we also identify responses that seem legitimate but lack substance. This includes things like generic text copied from other sources, answers that don’t address the actual question, or feedback that appears to have been given with minimal thought.
By removing these low-effort responses, we ensure your surveys only contain thoughtful, genuine feedback.
❇️ Fraud Detection Technologies
We use multiple layers of fraud detection technologies to stop low-quality responses. These include:
- CAPTCHA
- Device ID Reputation
- 100% Double Opt-In
- Carrier/targeting alignment check
- Single user IDs
- Sophisticated anti-VPN measures
And many more.
As several of our customers shared on Trustpilot:
“The most important point to make is that I trust the responses of my survey. My target audience was very specific and I could tell that the responses were legitimately coming [from] subjects in my target audience.”
“Each time I use this service I am blown away by the speed with which the responses come in and with the detail which most of them include. You can tell that the respondents take this very seriously. They must really enjoy doing it.”
Transparent, Pay-per-Response Pricing
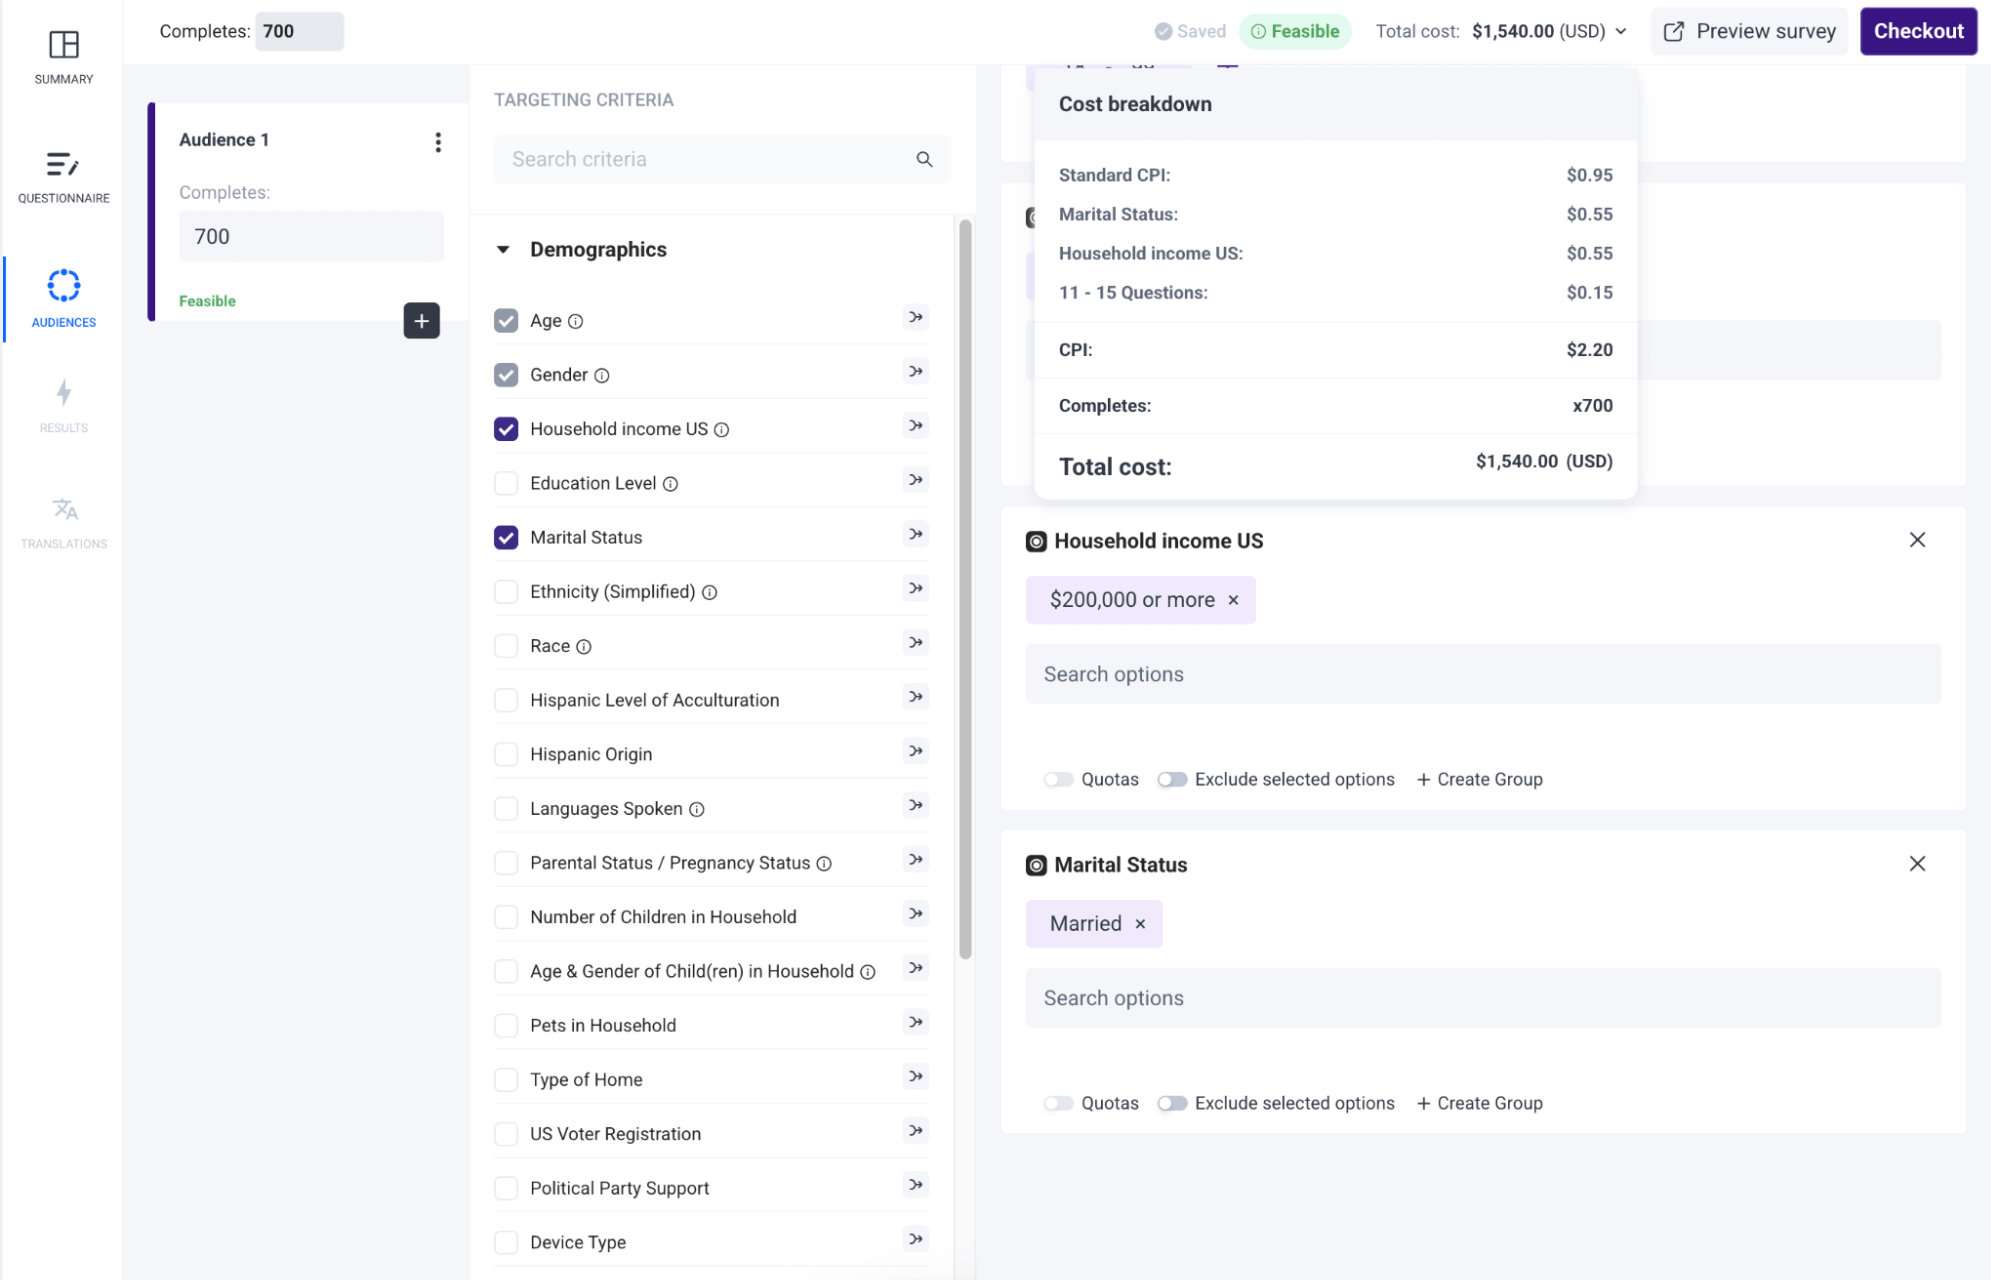
🚫 Many platforms charge high monthly subscription fees, with significant additional costs for each new user.
❇️ In contrast, Pollfish charges only per response and allows unlimited seats at no extra cost.
❇️ Pricing is displayed upfront as you build your survey with no hidden fees.
In the above example, you can clearly see that:
- The standard cost per response is $0.95
- Each additional filter added (in this case, marital status and household income) adds $0.55 per question
- There is a charge of $0.15 for adding 11 - 15 questions
- The total cost per response comes out to $2.20
- For a survey with 700 responses, the final cost is $1,540. This is shown clearly as you build your survey, so you always know exactly what you'll pay — no guessing, no hidden fees.
As several Pollfish customers stated on Trustpilot:
“The dollar amount they quote you in their cost calculator tool, and the number they show when you're developing the survey, is the number you pay. I was burned multiple times by [competitor] charging me unexpected amounts and making it difficult to quit an expensive subscription. I'm so happy to have found Pollfish as an alternative. Their support team also responds VERY quickly to chat messages and has been tremendously helpful the few times I had questions.”
– Read the full review here
“The pricing is clear and transparent from the beginning. The results come quickly and can be downloaded in different formats and with different filters. What we like most is the ability to filter the results and analyze them separately for each segment. We highly recommend this platform.”
“They charge based on the completed response. It is very fair and transparent. As a researcher, I have used many survey platforms, but they are the best so far.”
Fast Turnaround Times
Because we work with our parent company Prodege’s first-party audience network, our survey responses come in much faster than many other providers.
Surveys targeting a broad audience, such as all U.S. adults, come back in only a few hours.
Niche audiences take longer. For example, a survey targeting pet owners in Missouri with household incomes over $100,000 might take several days. But even for hard-to-reach groups, we're still faster than most alternatives.
As some of our customers have shared on Trustpilot:
“I needed a 25 question survey answered, and was able to get 500 completed surveys in 8 hours with Pollfish. The presentation of the results is very impressive and the demographics information Pollfish provided is invaluable.”
“The thing that amazes me most is how quickly you can get your data results back. So fast! Usually in a couple of hours.”
“I’m amazed at how quickly the platform was able to deliver rich, segmentable data from over 500 respondents. I had feature-ready insights in only 3 days.”
“I’ve used Pollfish before so when I needed to test concepts for a new business pitch in 5 countries over the holiday, I turned to Pollfish. The surveys were easy to set up, allowed me to select my very specific target and launched right away. Within a couple of days I had my results in an easy to interpret, actionable format well within my budget.”
Advanced Audience Targeting
Our advanced targeting options let you reach the exact audience you want, whether it’s a broad or a highly targeted niche audience.
❇️ Choose from 50+ Audience Filters in 6 Categories:
- Demographics: Age, Gender, Hispanic Origin, Marital Status, Languages Spoken, Education Level, US Voter Registration, Household Income (US), Age & Gender of Child(ren) in Household, Type of Home, Pets in Household, Political Party Support, Hispanic Level of Acculturation, Parental Status / Pregnancy Status, Race, Device Type, Device Operating System (OS), Ethnicity, Number of Children in Household
- Geographic Criteria: US State, US Division, US DMA, US Region, US Statistical Area (CBSA), US County, US Zip Code
- Consumer Lifestyle: Beverage Consumption, Hobbies & Interests, Sports Participation, Gambling Participation, Music Streaming Services Use, Movie Theater Frequency, Home Movie Viewing Frequency, Video Game Participation, Video Game Consoles, Video Game Genres, Travel by Air for Business/Leisure, Vehicle Make/Brand Own or Lease, Vehicle Type Own or Lease, Health Ailment Diagnosis
- Employment & Occupation: Employment Status, Industry Work In, B2B Department, Number of Employees, Job Title
- Behavioral Data: Brands Purchased (In-Store), Online Shopping: Retailer, In-Store Shopper, Category Buyers, Retail Channels Shopped (In-Store), Websites Visited, Retail Channels Shopped (Online)
- Media: Video Streaming Services Used
❇️ Set Custom Quotas to Ensure Balanced Samples
Audience quotas ensure representative findings across key segments like age, region, and income. For example, you can set quotas so 25% of responses come from each age bracket, rather than letting any single age group dominate.
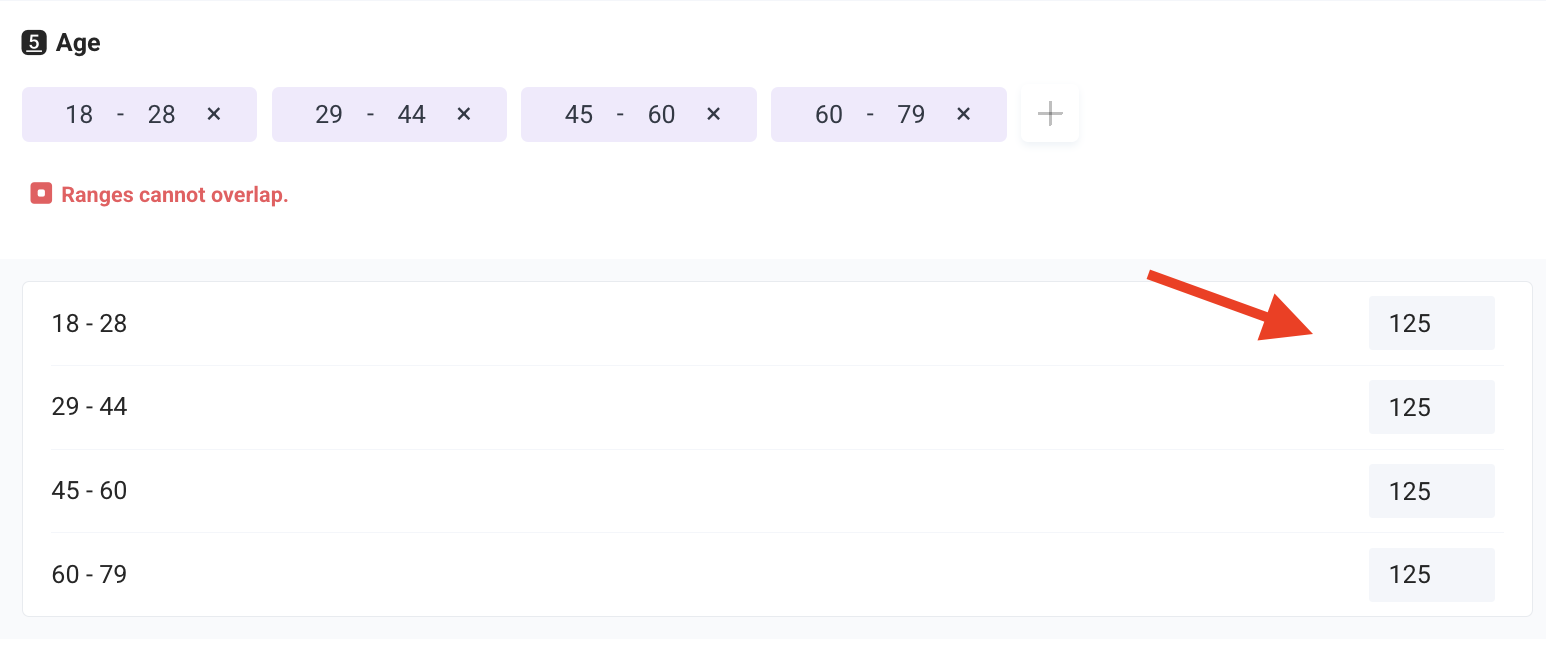
❇️ Audience templates
Pick from a library of audience templates that speed up your selection.
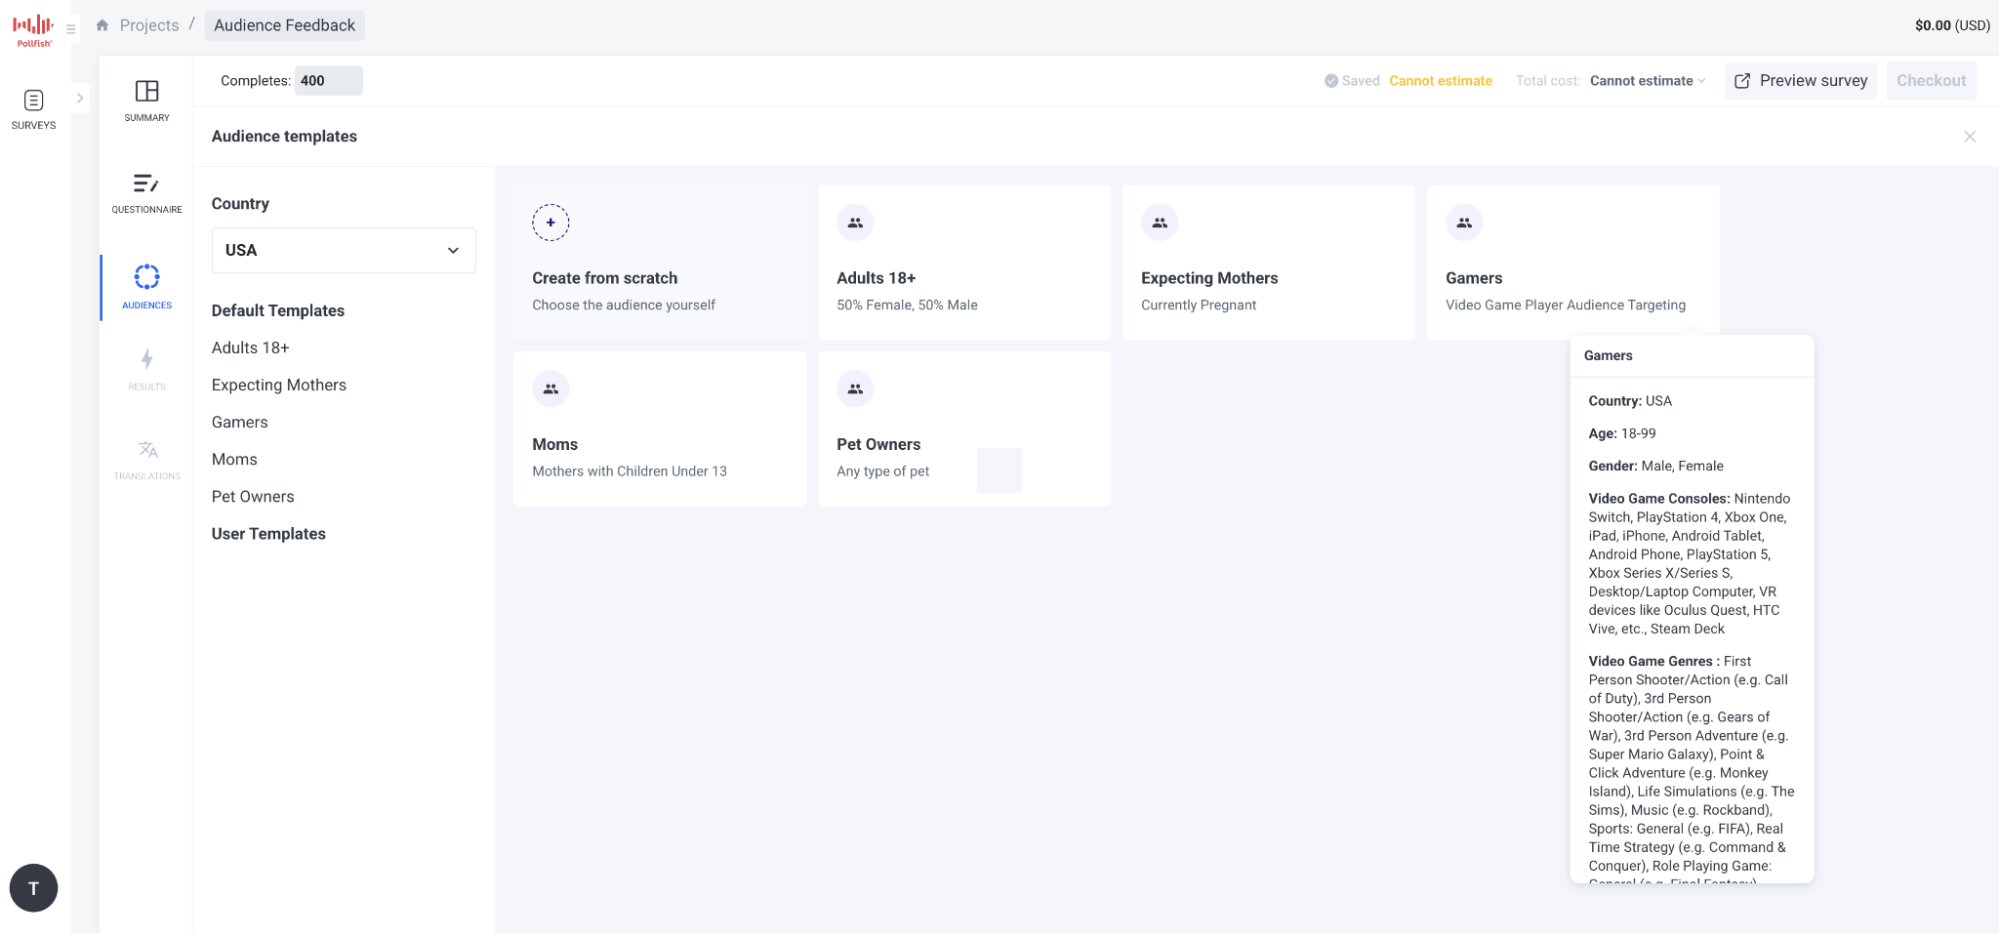
Sophisticated Questionnaire Design Options
Pollfish offers a wide range of question types and survey design options so you can program your survey to meet your exact requirements.
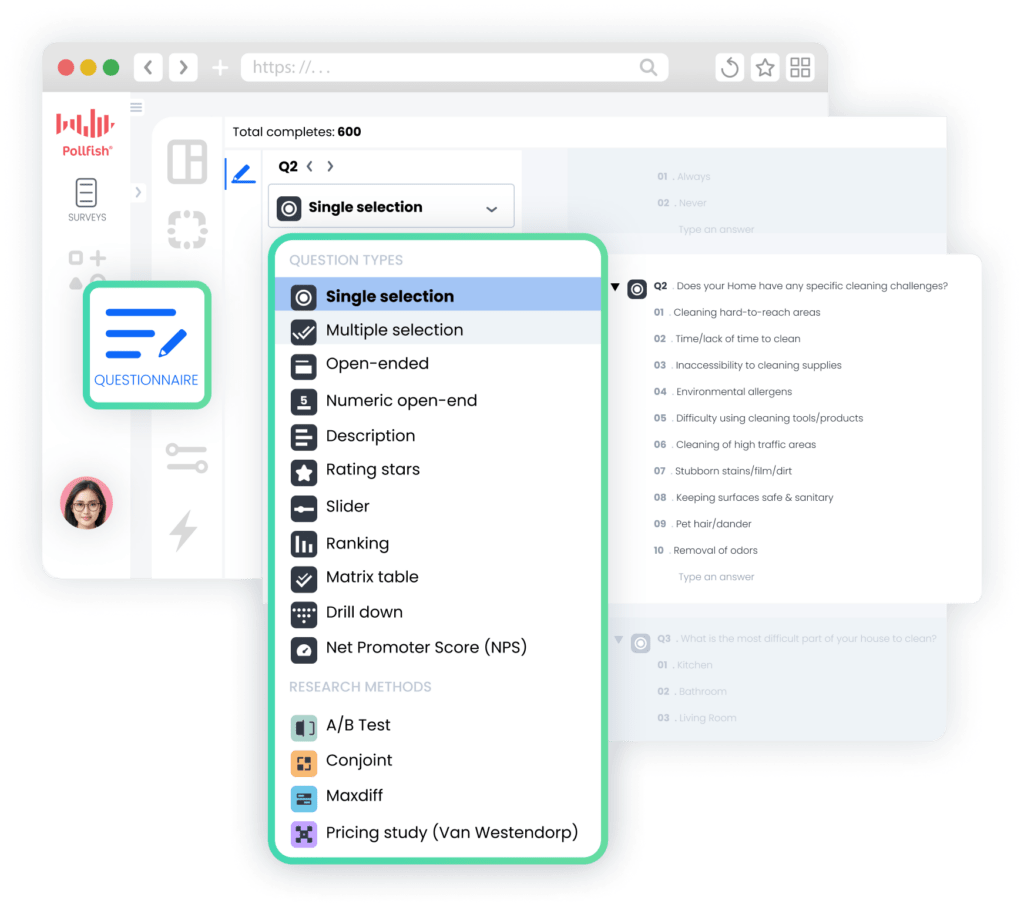
❇️ 16 Question Types
Our marketing survey software lets you choose from 16 question types, including:
- Conjoint Analysis
- MaxDiff (Maximum Difference Scaling)
- Pricing Study (Van Westendorp)
- Net Promoter Score (NPS)
- Constant Sum
- Ranking and Matrix Table
- A/B Testing
- Conversational AI (Allows for qualitative moderation at scale)
Note: Explore the full list of question types here.
❇️ Advanced Questionnaire Design Features
Some of Pollfish’s advanced questionnaire design features include:
- Skip Logic Branching
- Screening Questions
- Answer and question shuffling
- Mutual Exclusions
- Survey Preview & Advanced Controls
Note: Explore Pollfish’s additional survey design capabilities here.
Robust Analytics and Reporting Directly Within the Platform
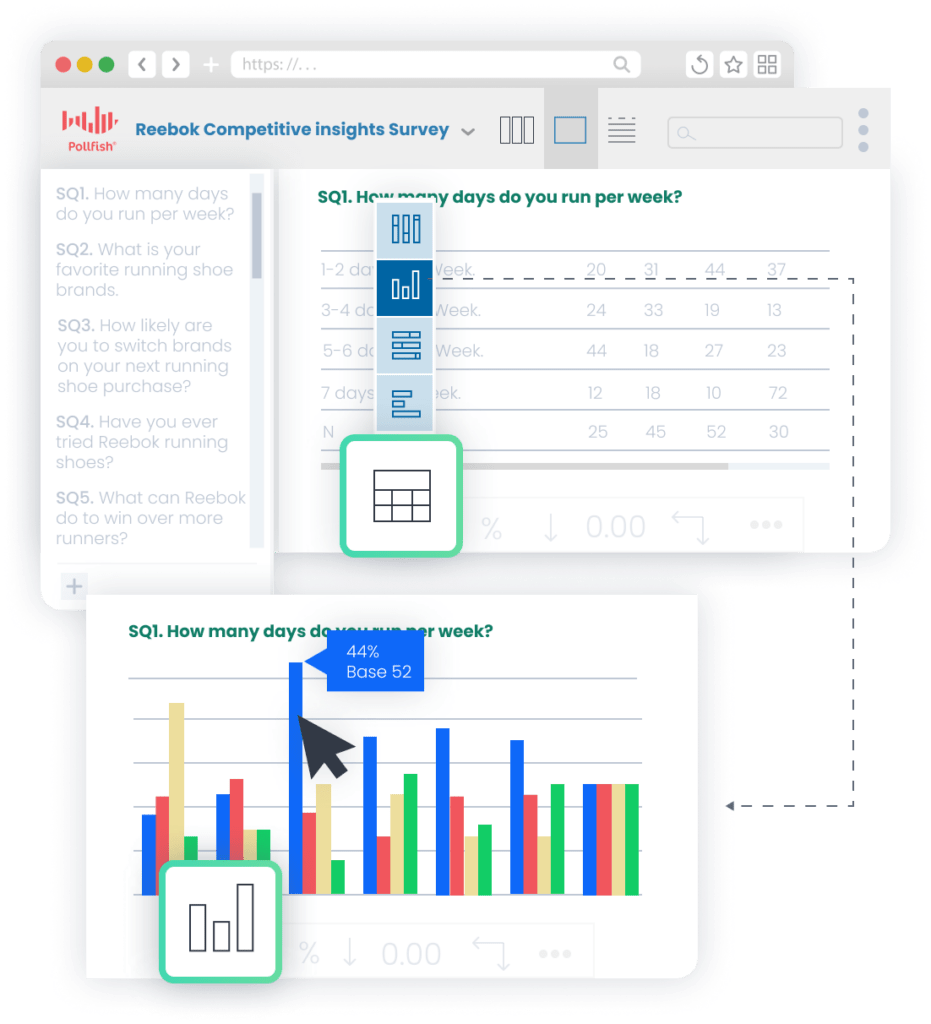
As responses roll in, you can analyze them in real time directly within Pollfish's intuitive platform. No need to export data to external software — though if you prefer to, we offer flexible export options as well.
❇️ Targeted insights through response-based and demographic filtering
Pollfish makes it easy to filter survey responses in order to dig deeper into your data and surface relevant insights. You can:
- Filter responses by answers to specific questions. For example, you might choose to see only the responses of those who answered “No” when asked if they already own a laptop.
- Filter by demographic information, such as males aged 18-22, in order to identify trends unique to that demographic.
- Layer multiple demographic filters for more precision, such as males ages 18-22 who live in California and spend at least 5 hours a day online.
❇️ Advanced Insights Builder
Pollfish's Insights Builder (available for large-scale and full-service projects) lets you create sophisticated multi-variable charts in seconds. Combine multiple variables such as income, location, age, behavior, and more without having to rely on external tools.
The interface is intuitive and beginner-friendly.
❇️ Statistical Significance Testing
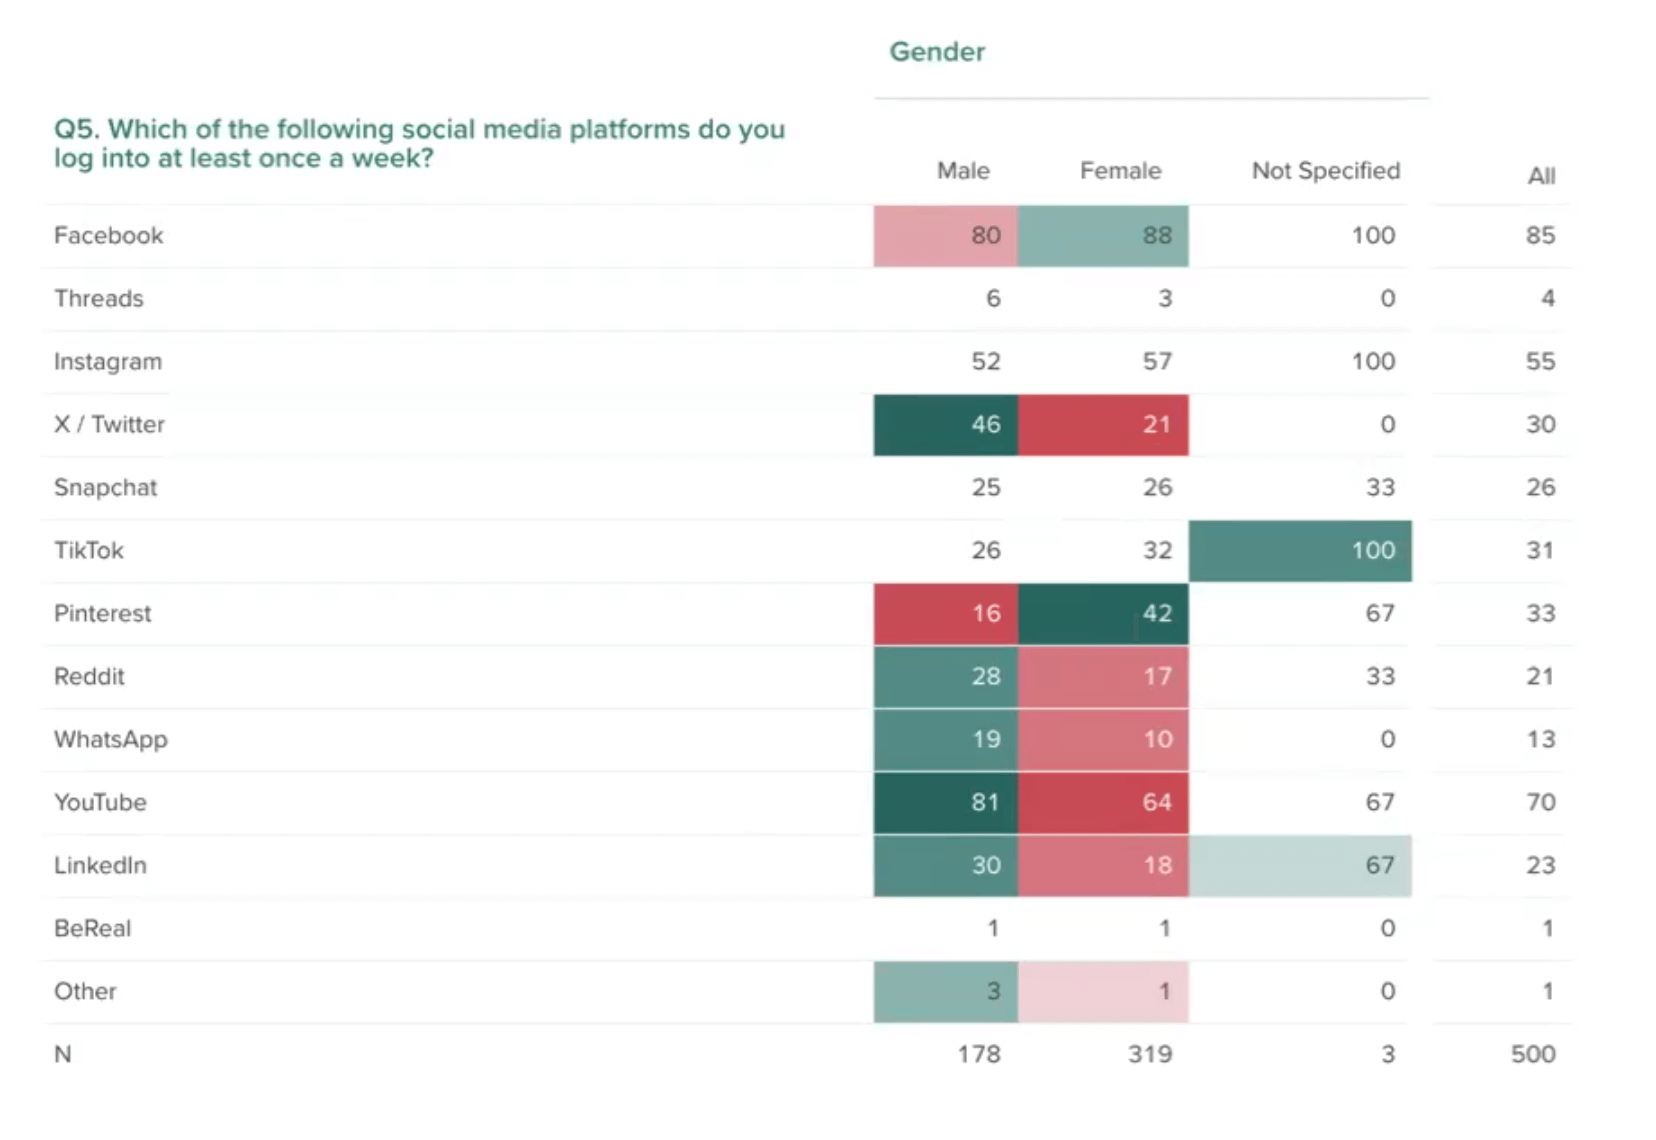
Pollfish makes it easy to see whether survey results are statistically significant by color-coding data to highlight meaningful differences.
For example, the chart above shows significant statistical differences in answers to the question, “Which of the following social media platforms do you log into once a week?”. Males log into X/Twitter at a higher rate than females (45% vs. 21%), while females log into Pinterest more (42% vs. 16%). These differences are clearly visible through color-coded notation.
❇️ AI Survey Analysis (Coming Soon)
Our AI Survey Analysis tool generates stakeholder‑ready insights and reports, grounded in your questionnaire and data.
Each report gives you executive summaries and in‑depth reports with evidence, charts, and plain‑language takeaways.
❇️ Custom branding
Pollfish lets you easily apply your own brand colors and fonts to your visualizations, so your reports stay consistent and stakeholder-ready.
❇️ Flexible export options
We offer a variety of export options, including PDF, Excel, Crosstabs, and SPSS, so you can work with your data however you prefer.
Want to Learn More About Pollfish?
To get started with Pollfish’s marketing survey software, we invite you to:
- Create a free account (no credit card required).
- Inquire about our full-service offering fulfilled through our parent company, Prodege.
2. Qualtrics
Qualtrics is a survey software that can be used by marketing professionals.
Their products include:
- Voice of Customer
- NextGen CX
- CX for Locations
- CX for Contact Center
- Experience Agents
- Employee Experience
- Employee Engagement
- Manager Effectiveness
- Talent Support
- 360 Development Feedback
- Strategy & Research
- NextGen Market Research
- User Experience Research
- Product Research
- Brand and Communication Research
- Audiences
To learn more about how Pollfish compares to Qualtrics, read our article on the 11 Best Qualtrics Competitors & Alternatives.
3. Alchemer
Alchemer is a survey tool that can be used for marketing.
Some of their products and services include:
- Survey
- Digital
- Pulse
- Integrations & Automations
- Dashboard
- Chatmeter
- Research Solutions
- Brand Health Tracker
- Professional Services
- Training
To learn more about how Pollfish compares to Alchemer, read our article on the 7 Best Alchemer Alternatives & Competitors.
4. Sawtooth
Sawtooth is a survey platform that can be used in the marketing industry.
Some of their research methods include:
- Conjoint Analysis
- Choice-based Conjoint (CBC)
- Adaptive Choice-based Conjoint (ACBC)
- MaxDiff
- Menu-based Choice (MBC)
Overall, it’s a solid tool for marketers to collect feedback and make more informed decisions.
5. SurveyMonkey
SurveyMonkey is an online survey builder that can be used for marketing surveys.
Some of their key features and capabilities include:
- AI
- Integrations
- Admin and Security
- Data analysis
To learn more about how Pollfish compares to SurveyMonkey, read our article on the 13 Best SurveyMonkey Alternatives & Competitors (Paid & Free).
6. QuestionPro
QuestionPro is a research and survey software with solutions for marketing professionals.
Some of their products include:
- Survey Software
- Research Suite
- Customer Experience
- Employee Experience
Overall, it’s a solid data collection tool for marketers and can help optimize results.
7. Typeform
Typeform is a survey tool that can be used by marketing professionals.
Some of their tools include:
- Form builder
- Survey maker
- Quiz maker
- Test maker
- Poll builder
- Application form builder
- Landing page builder
- NPS form builder
- Registration form builder
- Short form builder
Overall, it’s a solid platform for marketers to collect in-depth customer feedback, and they offer various AI-powered functionality and app integrations.
Want to Learn More About Pollfish?
We invite you to:
- Create a free account (no credit card required).
- Inquire about our full-service offering fulfilled through our parent company, Prodege.

8 Best Survey Software for Market Research Agencies in 2026
8 Best Survey Software for Market Research Agencies in 2026

When choosing survey software, market research agencies should prioritize:
- High-quality data and respondents: Your agency’s reputation hinges on the reliability of your market research results. The right survey platform should offer rigorous audience vetting and fraud detection.
- Advanced survey design and targeting: Client projects demand more than basic questionnaires — you'll need advanced question types, sophisticated branching logic, and precise audience targeting (whether you’re reaching broad or highly niche audience segments). Make sure the platform can handle it all.
- Fast turnaround time: Agencies need results quickly, especially on tight client deadlines. You can't afford to wait weeks for survey responses to come in.
- Transparent pricing and unlimited seats: Agencies need to know exactly what surveys will cost upfront — no hidden fees. Also, adding team members shouldn't mean paying extra.
- Sophisticated built-in analysis and reporting: Many agencies waste hours exporting data to Excel and manually building charts. The right platform lets you filter, cross-tabulate, and visualize results directly — so you can deliver insights faster without toggling between tools.
To help you choose the best survey software for your market research agency, we put together this list of the top 8 options. We’ll start with our own DIY survey software, Pollfish.
Top Survey Software for Market Research Agencies
1. Pollfish
Pollfish, our DIY survey software, offers transparent pay-per-response pricing rather than high monthly subscription fees, with discounts available for high-volume agencies. Your cost updates in real time as you build your survey — no hidden fees, no surprises when budgeting client projects.
In this section, we’ll dive deeper into:
- How to use Pollfish’s intuitive DIY survey builder, including:
- Step 1: Designing your questionnaire — Choose from a variety of market research templates, 16 question types, and advanced questionnaire design features.
- Step 2: Selecting your target audience — With 50+ audience filters across 6 categories, you can target the exact audience each client requires, no matter how broad or specific.
- Step 3: Analyzing results — Slice and dice your data and create multi-variable charts and visualization in just a couple of clicks, all within our platform.
- Other notable benefits of Pollfish include:
- High data quality standards for reliable survey results you and your clients can trust.
- Fast turnaround time ranging from a few hours to a few days for niche audiences.
- Transparent, pay-per-response pricing with unlimited seats.
Let’s dive in.
Advanced Questionnaire Design Features
Pollfish offers a robust suite of advanced survey design features to handle any client requirement.
❇️ 16 Question Types
We offer a total of 16 question types, including basic and more advanced:
- Conjoint Analysis
- MaxDiff (Maximum Difference Scaling)
- Pricing Study (Van Westendorp)
- Net Promoter Score (NPS)
- Constant Sum
- Ranking and Matrix Table
- A/B Testing
Note: Explore the full list of question types here.
❇️ Advanced Questionnaire Design Features
Pollfish makes it easy to add complex survey logic and other design features to help you collect unbiased data and offer a tailored survey experience for each respondent. Some of our questionnaire design features include:
- Skip Logic Branching
- AI Survey Creation
- Screening Questions
- Answer and question shuffling
- Mutual Exclusions
- Survey Preview & Advanced Controls
Note: Explore Pollfish’s additional survey design capabilities here.
❇️ Market Research Templates
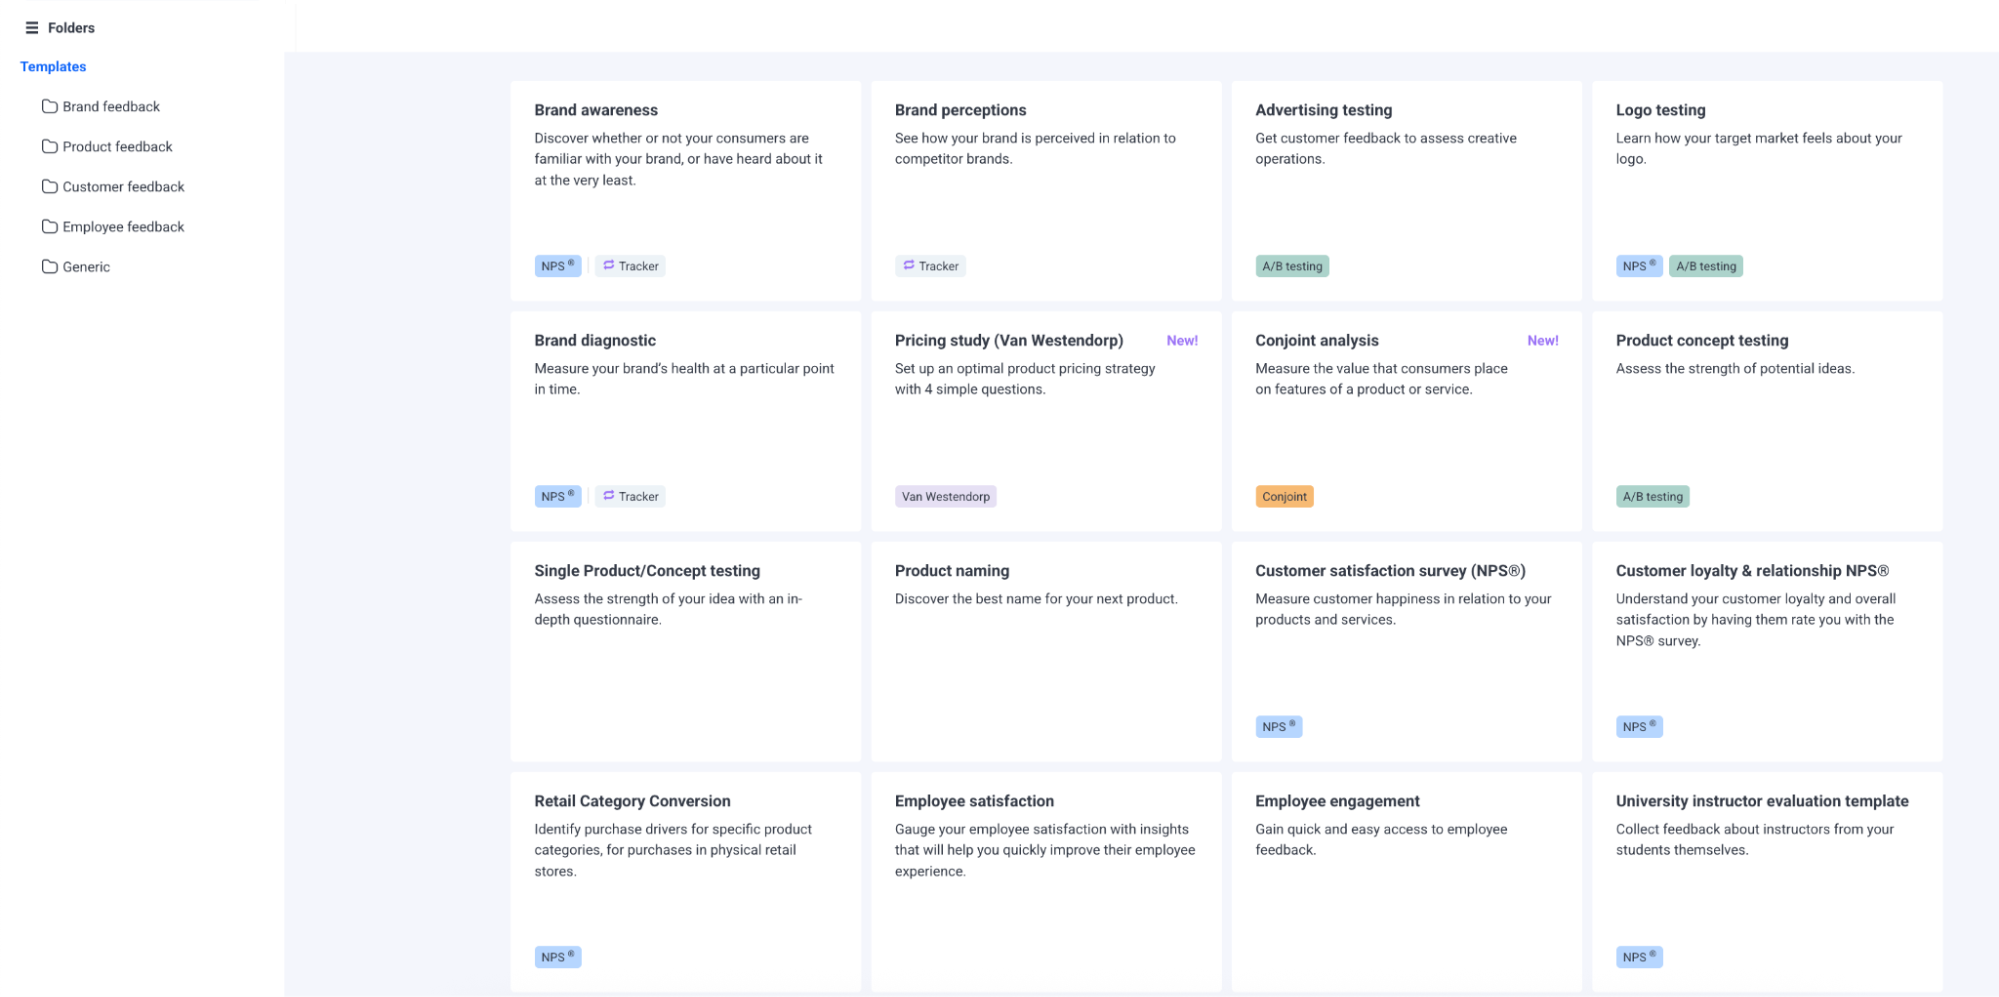
We offer a library of ready-made survey templates to speed up survey creation — time savings that add up quickly across multiple clients. Categories include:
- Brand feedback
- Brand awareness
- Brand perceptions
- Advertising testing
- Logo testing
- Brand diagnostic
- Product feedback
- Pricing study (Van Westendorp)
- Conjoint analysis
- Product concept testing
- Single product/concept testing
- Product naming
- MaxDiff analysis
- CPG brand awareness and perceptions
- CPG store choice drivers
- CPG path to purchase
- Customer feedback
- Customer satisfaction survey (NPS®)
- Customer loyalty & relationship NPS®
- Retail category conversion
Advanced Audience Targeting Features
As an agency, your clients will have vastly different audience needs — from broad demographics like U.S. adults 18+ to highly specific segments like pet owners who've switched brands in the past six months or IT decision-makers at mid-size companies.
Pollfish lets you define audiences at any level of specificity, so you can deliver on any client requirement.
❇️ 6 Targeting Options
We offer over 50+ targeting filters across 6 categories:
- Demographics: Age, Gender, Hispanic Origin, Marital Status, Languages Spoken, Education Level, US Voter Registration, Household Income (US), Age & Gender of Child(ren) in Household, Type of Home, Pets in Household, Political Party Support, Hispanic Level of Acculturation, Parental Status / Pregnancy Status, Race, Device Type, Device Operating System (OS), Ethnicity, Number of Children in Household
- Geographic Criteria: US State, US Division, US DMA, US Region, US Statistical Area (CBSA), US County, US Zip Code
- Consumer Lifestyle: Beverage Consumption, Hobbies & Interests, Sports Participation, Gambling Participation, Music Streaming Services Use, Movie Theater Frequency, Home Movie Viewing Frequency, Video Game Participation, Video Game Consoles, Video Game Genres, Travel by Air for Business/Leisure, Vehicle Make/Brand Own or Lease, Vehicle Type Own or Lease, Health Ailment Diagnosis
- Employment & Occupation: Employment Status, Industry Work In, B2B Department, Number of Employees, Job Title
- Behavioral Data: Brands Purchased (In-Store), Online Shopping: Retailer, In-Store Shopper, Category Buyers, Retail Channels Shopped (In-Store), Websites Visited, Retail Channels Shopped (Online)
- Media: Video Streaming Services Used
❇️ Set Audience Quotas
Our platform lets you set quotas to ensure balanced representation across audience segments.
For example, if your client is comparing brand perceptions across age groups, you can set quotas so each group — Gen Z, Millennials, Gen X, and Baby Boomers — makes up exactly 25% of your sample.
Sophisticated Built-In Data Analysis Tools
If your agency already has an established analysis workflow, we offer flexible export options to fit right in. That said, many agencies find our built-in tools advanced enough to replace Excel entirely.
You can filter data, build multi-variable charts, and create branded visualizations — all within our platform, quickly, and with ease.
For high-volume agencies, the time savings add up fast. We'd be happy to walk you through it on a demo call.
Below are a few of our key data analysis tools, though this is just a sampling of what's available.
❇️ Automatic Chart Creation
As responses come in, Pollfish automatically visualizes your results via tables, pie charts, and column charts, all updated in real time. This lets you get a head start on analysis while the survey is still in the field.
❇️ Targeted Insights Through Filtering
In order to surface insights about specific respondent groups, you can easily filter your results in several ways:
- Response-Based Filtering: View only those who responded to a question with a particular answer. For example, you might choose to filter your responses by people who answered “Yes” to a question like “Are you in the market for a new dog toy?”
- Demographic-Based Filtering: Filter survey results by age, location, income, and more. You can also layer multiple filters for deeper insights. For example, you could view responses only from Gen X males in Arizona with household incomes of over $250,000.
❇️ Multi-Variable Analysis and Visualization
Insights Builder (available for large-scale research needs and full-service projects) lets you easily create sophisticated, multiple-variable charts for a deeper understanding of your data.
It’s intuitive and easy to use, eliminating the need for expensive and time-consuming external analysis tools.
❇️ AI Survey Analysis (Coming Soon)
Our AI summary reports give you insights right away, while our data visualization tools allow you to look at the data in graphical formats that you can customize according to your data needs and brand colors for direct “copy and paste” use in executive presentations.
❇️ Custom Branding
When exporting visualizations, you can apply your agency's custom colors and fonts, so charts are client-ready without extra formatting work.
❇️ Flexible Export Options
With Pollfish, you can easily export your data in a variety of formats, including PDF, Excel, Crosstabs, and SPSS. This gives you flexibility in how you analyze and share your survey results.
Next, let’s explore additional advantages of Pollfish’s survey software for market research agencies.
High Data Quality Standards for Reliable Survey Results
As an agency, your reputation hinges on the accuracy of the survey results you deliver. Unreliable data means damaged client trust.
At Pollfish, high data quality is our top priority. Through our parent company, Prodege — the world's largest single-panel owner — we implement rigorous quality control measures across every survey.

We cover a few of them below, and go into more detail in our article on 3 survey data quality issues sabotaging your research (& how we fix them).
❇️ 14-Day Evaluation Period
When new members join our audience panel, they can only participate in internal surveys for the first 14 days. We give them access to client surveys only after they have shown consistent, high-quality participation during this period.
❇️ Dynamic Trust Scores
We use AI to assign each panelist a dynamic trust score that updates in real time as they take surveys and engage in other activities. Higher scores unlock more opportunities, incentivizing thoughtful responses.
❇️ Behavioral Data Validation
Self-reported respondent profiles may change over time, affecting whether or not a participant is relevant for a particular survey. To keep our panelists’ profiles up to date, we combine profile data with real behavioral signals like uploaded shopping receipts and online activity patterns.
For example, if a respondent identifies as a parent of young children but their purchase history shows no baby or kids' products, our system may flag the mismatch. This ensures that audience attributes remain accurate and up to date.
❇️ Fraud Detection Technologies
We employ multiple layers of fraud detection, including:
- CAPTCHA
- Device ID Reputation
- 100% Double Opt-In
- Carrier/targeting alignment check
- Single user IDs
- Sophisticated anti-VPN measures
❇️ Manual Review of Open-Ended Responses
Our team manually reviews all open-ended responses to catch not only nonsensical or one-word replies, but also rushed, low-quality answers.
This includes generic answers copied from other sources, responses that don't actually address the question, and feedback that shows minimal thought.
This hands-on review has a major impact on data quality.
As several of our customers shared on Trustpilot:
“The most important point to make is that I trust the responses of my survey. My target audience was very specific and I could tell that the responses were legitimately coming [from] subjects in my target audience.”
“Each time I use this service I am blown away by the speed with which the responses come in and with the detail which most of them include. You can tell that the respondents take this very seriously. They must really enjoy doing it.”
Fast Turnaround Time Ranging From A Few Hours To A Few Days
Because we use a first-party audience network through our parent company Prodege (rather than relying on third-party panel providers), survey responses come back significantly faster than with many other platforms.
For agencies juggling multiple client projects and tight deadlines, this speed can be a major advantage.
You can expect results in as little as a few hours for broad audiences (e.g., U.S. adults) or a few days for more niche segments (e.g., pet owners over 55 with household incomes above $100K).
As some of our customers shared on Trustpilot:
“I needed a 25 question survey answered, and was able to get 500 completed surveys in 8 hours with Pollfish. The presentation of the results is very impressive and the demographics information Pollfish provided is invaluable.”
“The thing that amazes me most is how quickly you can get your data results back. So fast! Usually in a couple of hours.”
“I’m amazed at how quickly the platform was able to deliver rich, segmentable data from over 500 respondents. I had feature-ready insights in only 3 days.”
“I’ve used Pollfish before so when I needed to test concepts for a new business pitch in 5 countries over the holiday, I turned to Pollfish. The surveys were easy to set up, allowed me to select my very specific target and launched right away. Within a couple of days I had my results in an easy to interpret, actionable format well within my budget.”
Transparent, Pay-Per-Response Pricing With Unlimited Seats
For market research agencies, predictable pricing is essential for accurate budgeting and quoting. A pay-per-response model lets you price out surveys with confidence, avoid surprise fees that eat into margins, and scale your team without paying extra for each new user.
❇️ No Long-Term Contracts Or Minimum Spend
Our pricing model is strictly pay-per-response — no long-term contracts, no monthly subscription fee, and no minimum spend.
❇️ See Your Total Cost Update In Real Time As You Build Your Survey

As you build your survey, your price will update in real time for easy, transparent budgeting.
In the example above, you can see that:
- The starting cost per response is $0.95
- Each targeting filter adds a charge of $0.55 (in this case, one for household income and one for pets in household)
- The total cost per response comes out to $2.05
- For 600 responses, the survey cost is $1,230 — what you see is what you pay.
❇️ Add Unlimited Seats For Free
Pollfish offers unlimited seats at no extra cost, so no matter the size of your agency, every member of your team can access our platform.
As several of our customers have stated on Trustpilot:
“The dollar amount they quote you in their cost calculator tool, and the number they show when you’re developing the survey, is the number you pay. I was burned multiple times by [competitor] charging me unexpected amounts and making it difficult to quit an expensive subscription. I’m so happy to have found Pollfish as an alternative. Their support team also responds VERY quickly to chat messages and has been tremendously helpful the few times I had questions.”
“The pricing is clear and transparent from the beginning. The results come quickly and can be downloaded in different formats and with different filters. What we like most is the ability to filter the results and analyze them separately for each segment. We highly recommend this platform.”
“They charge based on the completed response. It is very fair and transparent. As a researcher, I have used many survey platforms, but they are the best so far.”
Get Started with Pollfish
Ready to try Pollfish for your market research agency?
Create a free account to explore the platform (no credit card required).
2. Qualtrics
Qualtrics is a survey software that can be used by market research agencies.
Their key features and capabilities break down into three categories:
1. Customer Experience
- Voice of Customer
- Omnichannel Experience Management
- Digital Experience Analytics
- Website & App Feedback
- Location Experience Hub
- Online Reputation Management
- Contact Center Analytics
- Quality Management & Compliance
- Agent Coaching
- Edge Instant Insights
2. Employee Experience
- Employee Engagement
- Employee Pulse
- Employee Research
- Candidate Experience Management
- Employee Onboarding & Exit
- 360 Development Feedback
- Employee Retention Analytics
- Continuous Employee Listening
3. Strategy & Research
- Strategic Market Research
- Product Research
- Brand and Communication Research
- User Experience Research
- Edge Audiences
To learn how Pollfish compares to Qualtrics, see this article.
3. Alchemer
Alchemer is a survey tool that can be used by market research agencies.
Some of their key features and capabilities include:
- Advanced customization
- Logic and branching
- Advanced question types
- Multichannel deployment
- Instant reporting
- Easy segmentation
- Automation workflows
- Data security and protection
To learn how Pollfish compares to Alchemer, see this article.
4. Sawtooth
Sawtooth is a survey software that can be used by market research agencies.
Some of their research methods include:
- Conjoint Analysis
- Choice-based Conjoint (CBC)
- Adaptive Choice-based Conjoint (ACBC)
- MaxDiff
- Menu-based Choice (MBC)
5. GWI
GWI is a consumer research and survey platform for market research agencies and more.
Some of their services include:
- Brand tracking
- Market segmentation
- Audience profiling
- Analyst and reporting services
Their platform includes:
- GWI Spark
- GWI Canvas
- Audience builder
- Custom charts
- Dashboards
- Crosstabs
Overall, it’s a solid online survey tool for data collection with AI-powered features.
6. QuestionPro
QuestionPro is a survey software with solutions for market research agencies.
Some of their products include:
- Survey Software
- Research Suite
- Customer Experience
- Employee Experience
Overall, it’s a solid survey tool to help optimize results and gain actionable insights.
7. Opinion Stage
Opinion Stage is a survey software that can be used by market research agencies.
Some of their tools include:
- Quiz Maker
- Survey Maker
- Form Maker
- Poll Maker
- Test Maker
8. Suzy

Suzy is a survey tool that can be used by market research agencies.
Some of their key capabilities and functionality include:
- Attitudes and Usage
- Tracking
- Feature Testing
- Package Testing
- Price Testing
- Positioning
- Message Testing
- Path to Purchase
- Retailer Sell-in
- Heatmapping
Note: To learn how Pollfish compares to Suzy, see this article.
Want to Learn More About Pollfish?
We invite you to create a free account and explore the platform, no credit card required.

Top 7 Enterprise Market Research Tools in 2026
Top 7 Enterprise Market Research Tools in 2026

Unlike smaller companies, enterprises require market research tools that can handle scale, complexity, and global reach. Special considerations for choosing an enterprise market research tool include:
- Scalability and global reach: Can the platform handle large respondent volumes, multiple geographies, and multilingual studies?
- Data quality and reliability: What guardrails are in place to ensure responses are valid, representative, and free from fraud or bias?
- Pricing model & transparency: Does the platform provide transparent, pay-per-response pricing that’s clearly visible as you build your surveys so that there are no surprises after the survey is complete? Can you add unlimited team members at no extra cost?
- Expert support and services: Can you choose between managing your own DIY surveys or having a dedicated team handle everything for you from end to end? Also, is there a dedicated account manager regardless of which option you choose?
- Advanced analytics and customization: Can you easily filter survey data and create custom charts with multiple variables in just a few clicks, without needing external tools?
In this article, we explore the top 7 enterprise market research tools, including:
If you’re looking for other types of market research tools, such as data aggregator platforms, social media sentiment tools, competitor research software, and more, check out our article on the 14 best market research tools by category.
Let’s start with Pollfish, our own enterprise survey platform.
1. Pollfish
In this section, we’ll take a detailed look at how Pollfish works and discuss key benefits for enterprise companies, including our:
- Global first-party respondent communities
- Rigorous fraud detection and data reliability
- Transparent pay-per-response pricing
- Unlimited seats & dedicated account manager
- Complete team onboarding
Note that enterprises can choose between three flexible usage options:
- Self-service DIY: Build and manage your own surveys. A dedicated account manager is also available to help at any time.
- Full-service offering: We’ll handle custom research projects for you from start to finish, including survey programming, sample & fielding, data processing & analysis, reporting, and more.
- Volume discounts: Available for budgets of $25,000+ across both service types.
How to Use Our Enterprise Market Research Platform to Build a Survey
Before getting into the details, here’s a brief overview of how you can use Pollfish’s user-friendly platform to create a market research survey:
- Choose your target audience: Layer options from six categories of targeting filters to reach as broad or specific an audience as you want.
- Build your survey: Choose from 16 question types and a variety of advanced questionnaire design features to craft your survey. Need a jumpstart? Use our AI survey builder to build a survey off a simple prompt.
- Review and analyze your results: Filter responses, compare segments, and create custom branded charts using multiple variables, all within the Pollfish platform.
Now, let’s take a look at each step in more detail.
Step 1: Define Your Target Audience
One of the most important parts of crafting a strong market research survey is choosing an audience that accurately reflects your target market.
Pollfish's survey software offers a wide variety of targeting options, so you can reach the precise audience you need.
❇️ 6 Main Targeting Options
Pollfish’s extensive targeting criteria allow you to collect data from broad groups (e.g., all adults in the U.S.) or hyper-specific populations (e.g., millennial parents in NY who earn over $100k and regularly shop for pet food), depending on your needs.
Targeting filters are broken down into 6 categories:
- Demographics
- Geographic Criteria
- Consumer Lifestyle
- Employment & Occupation
- Behavioral Data
- Media
Note: Pollfish is on a mission to avoid longer surveys. Many of the targeting criteria will be delivered in your final data set by default, so you don’t have to ask respondents to select their gender, age, or education, among other demographic data points.
❇️ Audience Quotas for Balanced Samples
Pollfish’s audience quota feature helps enterprises control sample balance, ensuring results aren’t skewed toward any one demographic. This is especially valuable for large organizations that need representative market insights across key segments like age, region, or income for informed decisions.
For example, you could set quotas to ensure equal representation from millennials and Gen X audiences, preventing results from being dominated by one customer segment.
Step 2: Craft Your Survey
Pollfish offers extensive, customizable survey programming features to help you design your surveys to your exact specifications and needs.
❇️ 16 Question Types
Some of the question types we offer include:
- Conjoint Analysis: Important for enterprises testing feature bundles, subscription tiers, or product variations at scale. It reveals which trade-offs matter most, guiding pricing and product strategy. (Learn more in our article on the best conjoint analysis software.)
- MaxDiff (Maximum Difference Scaling): Helps enterprises prioritize attributes (e.g., what matters most in packaging, messaging, or features) without the bias of rating everything “important.”
- Pricing Study (Van Westendorp): Crucial for pricing strategy in competitive markets, especially for new products or tiered services.
- Net Promoter Score (NPS): Widely adopted at the enterprise level to track brand loyalty, benchmark performance, and tie results to financial metrics.
- Constant Sum: Useful for budget allocation insights, showing how potential customers distribute spend across categories or features.
- Ranking and Matrix Table: Efficient ways to evaluate multiple features or service attributes at once, supporting prioritization and benchmarking.
- A/B Testing: Valuable for iterative optimization of marketing campaigns, product interfaces, or ad creatives at scale.
Read the full list of question types here.
❇️ Advanced Questionnaire Design Features
For enterprise market research, some of the most relevant features are the ones that ensure data quality, representative samples, and complex logic handling at scale.
Advanced survey design features Pollfish offers include:
- Skip Logic Branching: Enables complex survey flows that adapt to respondent answers, reducing noise and improving data relevance.
- Screening Questions: Prevents unqualified respondents from skewing results.
- Answer and question shuffling: Randomize the order of survey answers and questions to reduce bias.
- Mutual Exclusions: Ensures logical consistency in responses, which matters when analyzing at enterprise scale.
- Survey Preview & Advanced Controls: Safeguards against errors before large, costly deployments.
Explore Pollfish’s additional survey design capabilities more in-depth here.
Step 3: Extract Valuable Insights from the Survey Data
As soon as survey responses start coming in, you can explore the data directly on the Pollfish platform — no need to export data unless you want to. Choose from a variety of tools for exploring, visualization, filtering, and sharing your market research findings.
❇️ Filter by Segment or Response
In just a few clicks, Pollfish lets you break down your data by specific audience segments or individual responses.
For example, you could compare purchase intent among U.S. versus European respondents, or isolate how CIOs in the finance sector rated product usability compared to IT managers in healthcare. You can also filter by specific answer choices, for instance, viewing only respondents who selected “strongly agree” when asked about switching providers.
❇️ Create Charts Using Multiple Variables with Insights Builder
Insights Builder, available for high-volume users and full-service projects, allows you to effortlessly manipulate, sort, and graph data directly within our platform, as seen in the image below:
You can create advanced, custom charts with multiple variables (e.g., income + location + age + behavior) without requiring external tools like Excel.
❇️ Statistical Testing
Statistical testing outcomes are easy to interpret, with differences highlighted through color coding and letter-based notation.
If you wanted to compare product adoption rates across industries, Pollfish would automatically highlight statistically significant differences. For example, it could show that finance executives (highlighted in dark green with capital “A” notation) adopt your solution at a much higher rate than healthcare administrators (marked with lowercase “b”).
❇️ Export Your Data (PDF, Excel, SPSS, Crosstabs)
Export survey results in multiple formats, including PDF, Excel, Crosstabs, and SPSS. This is especially useful for enterprises that rely on established analytics pipelines and statistical tools.
❇️ Build Presentations Directly in Our Platform
With Pollfish, you can build and export PowerPoint presentations directly in our platform, reducing the need to juggle multiple tools and making it quicker and easier to incorporate charts into your reports.
Next, let’s explore some of Pollfish’s additional key benefits for enterprise market research.
Large First-Party Audience Network
Pollfish sources responses from audience panels owned and maintained by our parent company, Prodege. This audience spans across 125+ countries and 100 million people.
The scale, reach, and control of this respondent community means enterprises get:
❇️ Global Coverage at Scale
Enterprises often need to run studies across multiple countries, regions, and demographics. Having access to 100 million respondents in 125+ countries ensures you capture diverse, representative data rather than relying on small, localized panels.
❇️ Speed and Efficiency
Proprietary access means faster turnaround times. General population survey results typically come back within just a few hours, while niche or highly targeted audience surveys usually take only a few days.
As some of our customers shared on Trustpilot:
“I needed a 25 question survey answered, and was able to get 500 completed surveys in 8 hours with Pollfish. The presentation of the results is very impressive and the demographics information Pollfish provided is invaluable.”
– Read the full review here“The thing that amazes me most is how quickly you can get your data results back. So fast! Usually in a couple of hours.”
– Read the full review here“I’m amazed at how quickly the platform was able to deliver rich, segmentable data from over 500 respondents. I had feature-ready insights in only 3 days.”
– Read the full review here“I’ve used Pollfish before so when I needed to test concepts for a new business pitch in 5 countries over the holiday, I turned to Pollfish. The surveys were easy to set up, allowed me to select my very specific target and launched right away. Within a couple of days I had my results in an easy to interpret, actionable format well within my budget.”
– Read the full review here
High Audience Data Quality You Can Rely On
Since our audience network is owned and maintained by parent company Prodege, Pollfish can enforce higher standards for respondent recruitment, engagement, and fraud prevention. You can be confident that the data is trustworthy and can help guide high-stakes business decisions.
❇️ In-house Panel Support, Security, and Compliance Team
Our research staff includes former Hall & Partners, Ipsos, Nielsen, Lieberman Research, NPD, and Kantar researchers who use best practices and methods to align with industry standards.
❇️ Manual Review of Open-Ended Responses
Pollfish’s research team reviews all open-ended survey responses, removing and replacing low-quality answers like gibberish, irrelevant text, or one-word replies. Unlike platforms that rely only on automation, this extra layer ensures enterprises aren’t left with incomplete or unusable data.
❇️ 14-Day Evaluation Periods
Before new panelists can join client surveys, they complete a series of internal quality checks during their first 14 days. Those who fail to meet our standards are removed, while ongoing spot checks ensure only vetted, reliable respondents remain in the panel.
❇️ Trust Scores
Pollfish assigns each panelist a dynamic Trust Score, updated with AI and machine learning to track response quality and engagement. Low scores lead to removal or extra verification, while high scores unlock more earning opportunities, incentivizing long-term accuracy and reliability for enterprise studies.
❇️ Fraud Detection Technologies
Pollfish employs multiple fraud detection technologies to ensure the reliability of your survey responses, including:
- Unique User IDs
- Anti-VPN
- Device fingerprinting
- Straight-lining detection
- Speeding prevention
And so much more.
❇️ Behavioral Data Validation
Instead of relying only on self-reported profiles, Pollfish actively cross-checks respondents using behavioral data such as purchase receipts and browsing activity. If someone reports not having children but starts consistently buying baby products, for example, our system may flag the mismatch.
As several of our customers shared on Trustpilot:
“The most important point to make is that I trust the responses of my survey. My target audience was very specific and I could tell that the responses were legitimately coming [from] subjects in my target audience.”
– Read the full review here“Each time I use this service I am blown away by the speed with which the responses come in and with the detail which most of them include. You can tell that the respondents take this very seriously. They must really enjoy doing it.”
– Read the full review here
Unlimited Seats at No Extra Cost & Transparent Pricing
Many enterprise survey platforms add steep fees for each additional user, and survey pricing is not completely transparent. Pollfish takes a different approach.
❇️ Unlimited Seats at No Extra Cost
Pollfish includes unlimited user seats at no extra charge, which is essential for large enterprises where multiple teams and employees need access to create surveys or review findings.
❇️ Transparent Pay-Per-Response Pricing
Pricing is always transparent as you design your survey, so you’ll never encounter hidden costs or unexpected fees. The dynamic pricing calculator updates instantly as you add or remove filters.
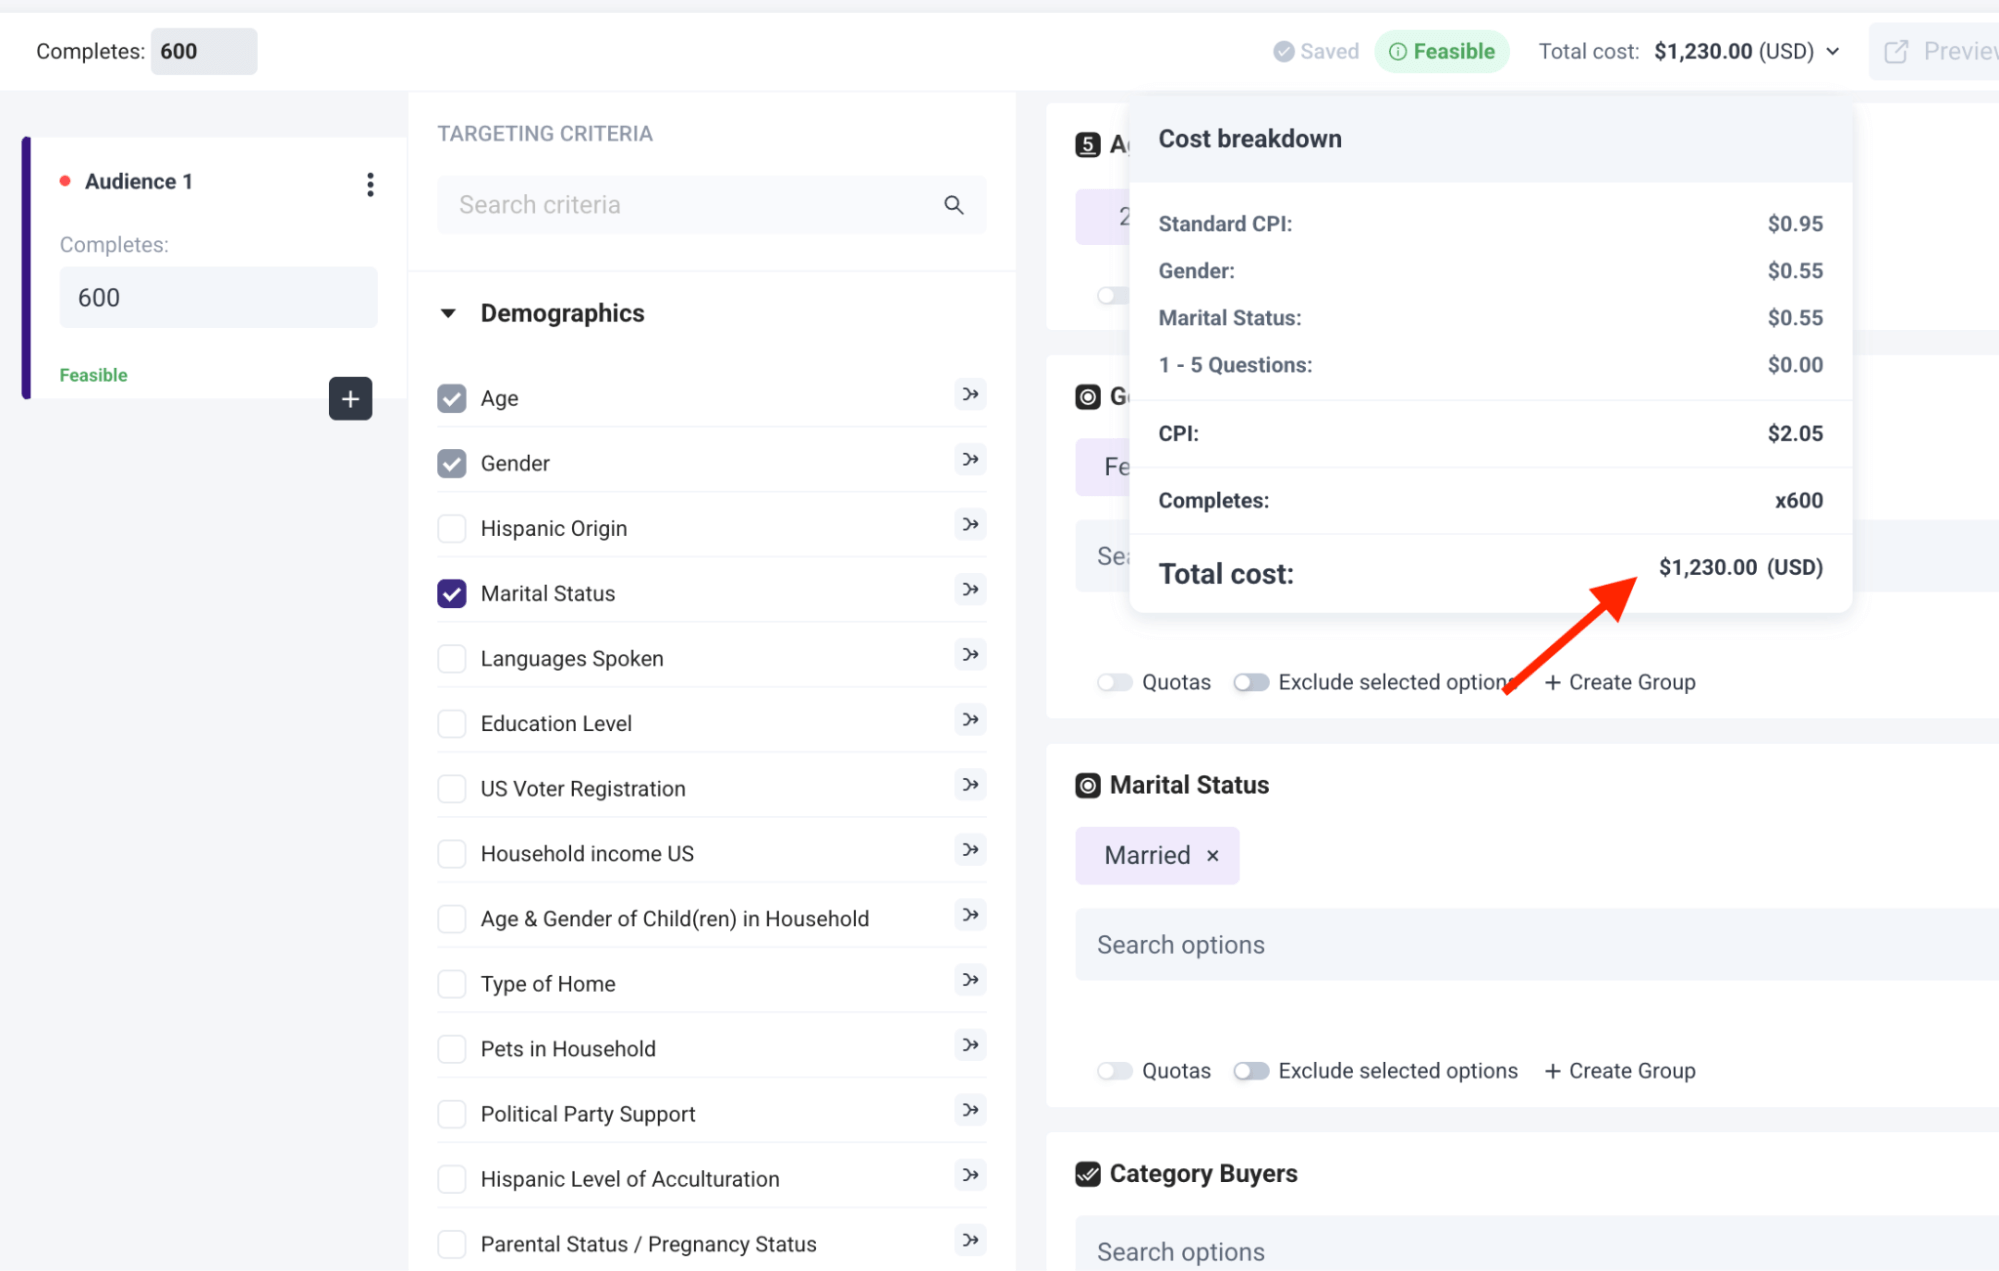
Here’s how it breaks down for the example above:
- Base Cost: Each response starts at $0.95.
- Added Filters: Two extra filters (Household Income, Pets in Household) each add $0.55 to the cost per response.
- Updated Cost: With these filters, the cost per response is now $2.05 ($0.95 + $0.55 + $0.55).
- Total Survey Cost: For 600 completed responses, the total survey cost is displayed upfront as $1,230 ($2.05 x 600).
As several of our customers have stated on Trustpilot:
“The dollar amount they quote you in their cost calculator tool, and the number they show when you’re developing the survey, is the number you pay. I was burned multiple times by [competitor] charging me unexpected amounts and making it difficult to quit an expensive subscription. I’m so happy to have found Pollfish as an alternative. Their support team also responds VERY quickly to chat messages and has been tremendously helpful the few times I had questions.”
– Read the full review here“The pricing is clear and transparent from the beginning. The results come quickly and can be downloaded in different formats and with different filters. What we like most is the ability to filter the results and analyze them separately for each segment. We highly recommend this platform.”
– Read the full review here“They charge based on the completed response. It is very fair and transparent. As a researcher, I have used many survey platforms, but they are the best so far.”
– Read the full review here
Full Service Market Research (through Our Parent Company, Prodege)
As mentioned, for enterprises that prefer fully done-for-you market research services, we can take care of:
- Survey programming
- Sample & fielding
- Data processing & analysis
- Reporting
Each project will receive dedicated specialists, including a sample manager and a project manager, with additional specialized roles added based on your specific service needs.
Learn More About Pollfish & Create a Free Account
You have three easy options for getting started:
- Create a free account, no credit card required
- Schedule an introductory call
- Inquire about full-service enterprise market research through Prodege
2. Qualtrics
Qualtrics is an enterprise-grade Experience Management (XM) platform that combines customer, employee, brand, and market research into one system, powered by AI and analytics.
Key Features
- Advanced survey tools (MaxDiff, Conjoint, TURF, etc.)
- AI-driven text and sentiment analytics at scale
- Global panel access (via Qualtrics Audience)
- Predictive analytics and automated recommendations
- Enterprise-grade compliance (GDPR, HIPAA, FedRAMP)
- Integrations with CRM, ERP, analytics, and HRIS platforms
- Dashboards and collaboration tools
Done-for-You Service? Yes, Qualtrics offers full-service research and consulting via its XM Institute and Research Services team. Enterprises can outsource design, sampling, analysis, and reporting, or run fully DIY within the platform.
Note: To learn how Pollfish compares to Qualtrics, see this article.
3. Suzy
Suzy is an AI-powered consumer insights platform combining quantitative and qualitative research in a single ecosystem.
Key Features
- Proprietary vetted consumer panel (Crowdtap) for high-quality data sets
- AI‑driven survey templates, MaxDiff, Data Explorer, video open‑ends, automated analysis, PowerPoint/Excel exports
- Combines quant, qual, live interviews, retargeting, and trend signals in one platform
- Support from a “Center of Excellence” team ensuring research rigor.
Done‑for‑You Service? Yes. Suzy provides managed services and expert support for methodology, design, and project execution through its enterprise offerings.
Note: To learn how Pollfish compares to Suzy, see this article.
4. SurveyMonkey
SurveyMonkey is a popular survey platform offering AI-powered survey building, audience access, and advanced analytics.
Key Features
- 500+ templates
- Global panel access
- Advanced logic and branching
- Real-time analytics with AI insights
- 200+ integrations (Salesforce, Tableau, Slack, etc.)
- Enterprise-grade security and admin tools
Done-for-You Service? Yes, via SurveyMonkey Audience and Market Research Solutions, enterprises can get managed services for sampling, survey design, and insights delivery.
Note: To learn how Pollfish compares to SurveyMonkey, see this article.
5. Manus
Manus is an autonomous AI agent that takes high‑level prompts and can help deliver full market research reports.
Key Features
- AI‑powered, fully autonomous report generation
- Real‑time data analysis across social sentiment, pricing, regulatory updates, and consumer behaviors
- Professional, interactive web report output
- Significant efficiency gains versus traditional methods (minutes vs. weeks)
Done‑for‑You Service? According to Manus’s website, they are primarily a DIY AI platform. We recommend you reach out to their support to inquire if they provide a full-service offering.
6. Typeform
Typeform is a visually appealing, conversational form/survey builder known for one‑question‑at‑a‑time design, rich interactivity, and deep integrations.
Key Features
- Interactive survey design with logic jumps and multimedia support
- AI-powered “Smart Insights” for analytics and narrative summaries
- Extensive integrations (500+) for workflow automation
- Enterprise-grade features include SSO, GDPR/HIPAA compliance, dedicated support, custom branding & domains, EU data hosting
Done‑for‑You Service? Mostly DIY, but the Enterprise tier offers VIP support, onboarding, and training.
7. Qualaroo
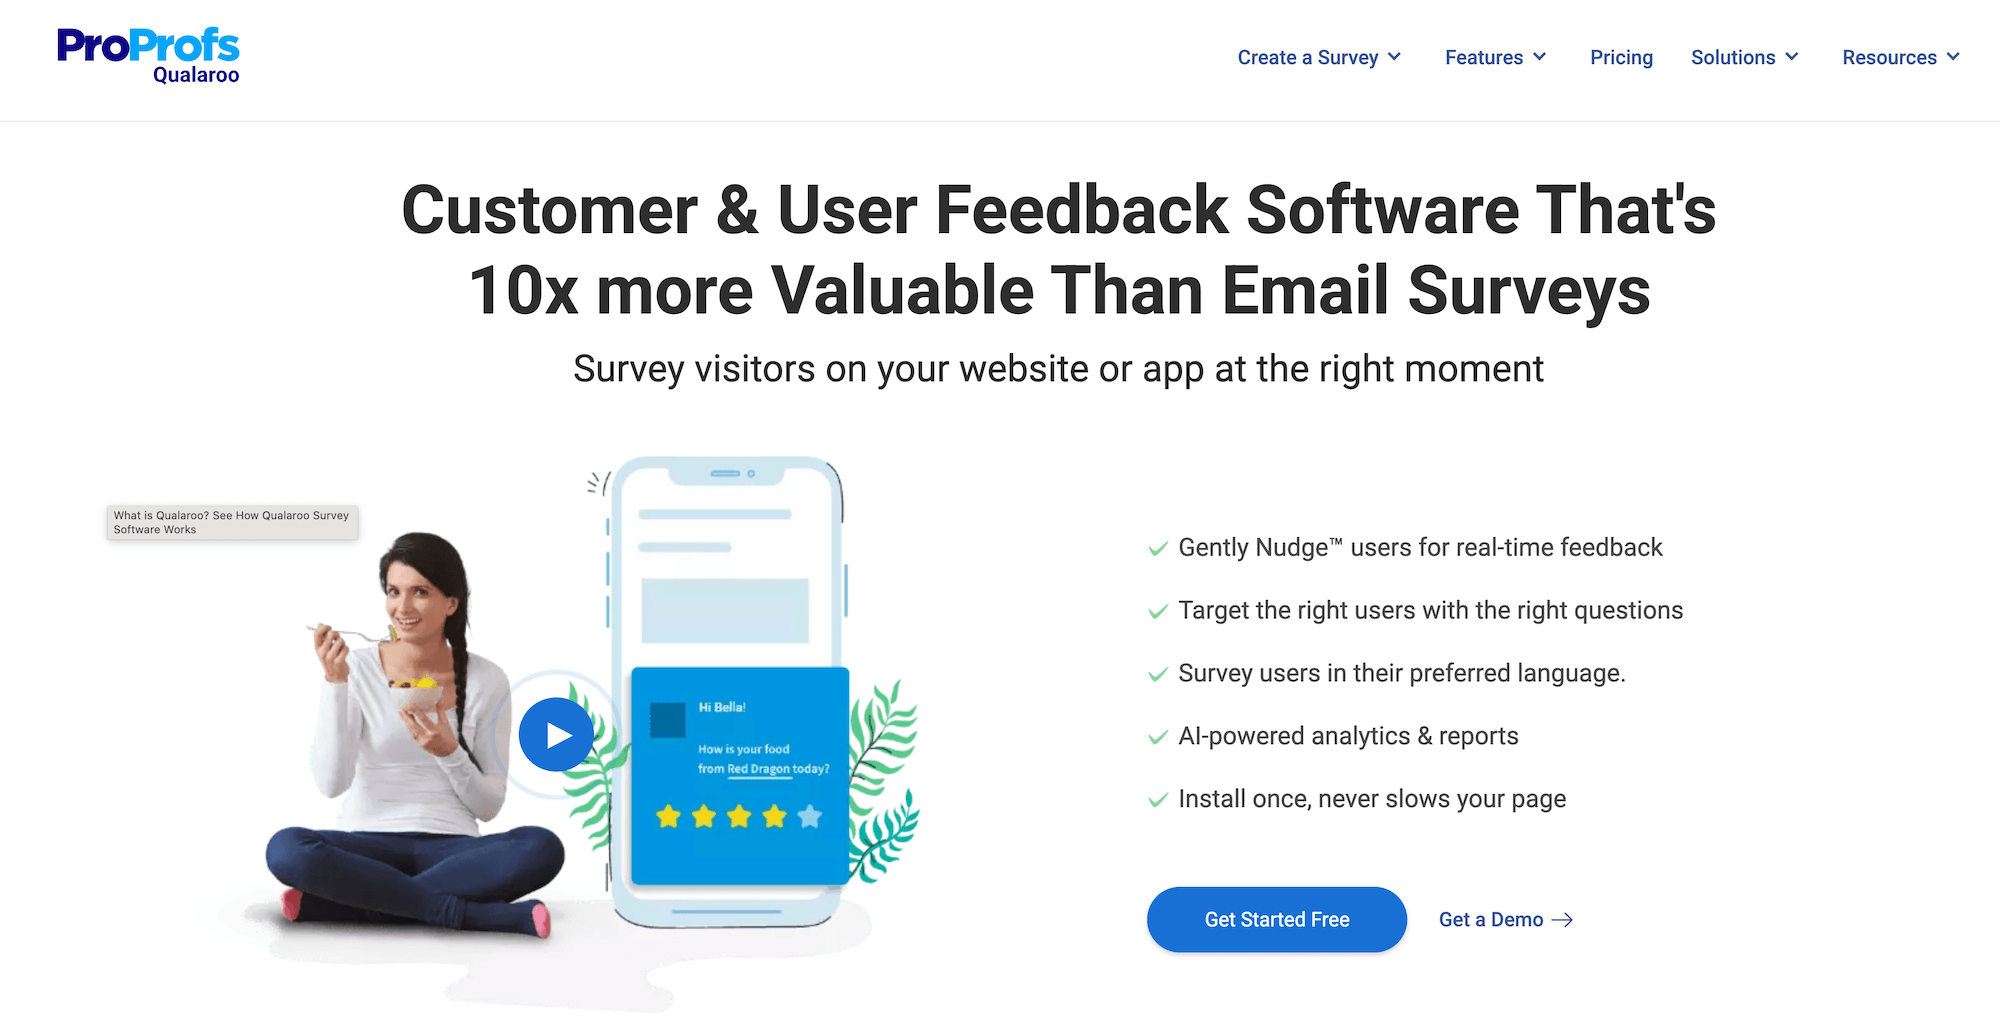
Qualaroo is a website/app feedback and user research tool that captures real-time insights via “Nudges™.” It’s intended for Product Development, UX, and growth teams seeking contextual customer feedback to uncover pain points and optimize digital experiences.
Key Features
- In-app, on-site, and prototype surveys
- Behavior-triggered nudges and branching logic
- IBM Watson-powered sentiment analysis
- Multi-language support and custom branding
- Integrations (HubSpot, Salesforce, Tableau, etc.)
Done-for-You Service? Qualaroo is primarily a DIY tool. We recommend you reach out to their support to inquire if they provide a full-service offering.
Ready to Learn More About Pollfish?
We invite you to create a free Pollfish account (no credit card required) and/or book an introductory call.
6 Best Enterprise Survey Software in 2026
6 Best Enterprise Survey Software in 2026

When selecting an enterprise survey software, consider these key elements:
- Advanced survey capabilities: Enterprise solutions should provide sophisticated questionnaire design tools and precise audience targeting options. If any of these areas are lacking (e.g., you’re unable to set up sophisticated branching logic or the software is missing filters to target your exact audience), then your data quality can suffer as a result.
- Powerful analytics tools: Look for platforms that make it easy to create custom charts (using multiple variables) and build presentation-ready visualizations in your brand’s colors, without requiring external software.
- Service model flexibility: In some cases, you might prefer running DIY surveys independently. However, when needed, you should have access to full-service options. This is particularly valuable when you're facing tight deadlines, lack internal expertise, and need to ensure the highest quality standards for critical research initiatives.
- Clear & transparent pricing: The cost of your survey should be transparent and clearly visible as you build it, ensuring no unexpected charges or hidden fees.
- Unlimited seats & no license fees: The best enterprise survey platforms allow you to add an unlimited number of team members without incurring additional costs.
- Administrative & collaboration features: The best enterprise platforms should make it easy to add and manage users, share survey access and collaborate across different departments, create organized project folders, enable easy and secure employee sign-in via SSO (Single Sign-On), etc.
- High-quality audience data, rapid turnaround times, and other enterprise-grade essentials.
In this post, we’ll start by discussing the key advantages of choosing Pollfish, our enterprise survey software. Then, we’ll discuss other solutions to help you make an informed decision.
Best Enterprise Survey Software
1. Pollfish

Pollfish, our market research survey platform, is renowned for its superior audience data quality. We achieve this by owning and operating our respondent communities through our parent company, Prodege, and by implementing rigorous quality control measures. This includes 14-day evaluation periods, panelist trust scores, verifying self-reported information through purchase receipt uploads, and more.
This ensures that the decisions you make based on your survey data are sound and dependable, and it’s a key reason why enterprise companies choose Pollfish.
Beyond reliable data quality, Pollfish offers enterprise clients a comprehensive suite of advanced features and capabilities:
- Volume discounts
- 5% IR (no premium)
- 2x survey priority (faster)
- Conjoint analysis
- MaxDiff analysis
- Van Westendorp (PSM)
- Custom survey themes
- Crosstab designer
- Live BigQuery export
- Language translations
- Single Sign-on (SSO)
- Unlimited seats
- Account budgets
- Dedicated Account Manager
- Complete team onboarding
- Ad-hoc trainings
- Quarterly survey meetings
- Access to Services Team
There are two methods to collect survey responses with Pollfish:
- Purchase audience responses from our existing audience panel. Use our global Prodege network to reach the right audience for your survey.
- Distribute a survey to your own audience. Create a survey and share the link with your own list via email, social media, landing page, and so on. You can also use screening questions to ensure only the most relevant participants complete the surveys.
Up next, we’ll provide in-depth information on:
- Pollfish’s Flexible Service Models: We offer DIY, assisted, and fully-managed survey options. Volume-based discounts are available and can be applied across all service tiers.
- Pollfish’s Advanced Functionality: We provide advanced questionnaire design, audience targeting, and data analysis & reporting features.
- Additional Benefits:
- High-quality audience data
- Transparent pay-per-response pricing model
- Unlimited seats & no license fees
- Fast turnaround time
- Powerful administrative and collaboration tools
Let’s dive in.
Pollfish’s Flexible Pricing: Pay-As-You-Go DIY or Enterprise Packages That Include Volume Discounts & Full-Service Agency for Custom Projects
Pollfish provides flexible service tiers for enterprise companies, designed to match your research needs and capacity:
❇️ DIY Access
Manage your surveys independently with priority support from research experts that are on call 24/7. Pricing starts at $0.95 per response, with no monthly fees and transparent pricing visible during survey creation (ensuring no hidden or surprise charges).
❇️ Enterprise Pricing Plans
Enterprise clients enjoy volume discounts, exclusive features, and access to a dedicated account manager who can help with everything from complete team onboarding to custom projects handled by our in-house agency. It’s a completely done-for-you service from start to finish. The process involves:
- Share your objectives (brief, email, or call)
- Receive a detailed proposal (design, pricing, timeline)
- We execute the project end-to-end (programming, reporting)
❇️ Volume-Based Discounts
If you plan to spend $25,000 or more, we offer volume-based discounts. These funds can be utilized across our DIY or fully-managed services.
Note: To learn more about our market research services (fulfilled through parent company Prodege), visit this article.
Robust Questionnaire Design Features

Pollfish offers extensive, customizable questionnaire design features, allowing you to program surveys exactly as you envision:
❇️ 16 question types
Explore our guide on when to use Pollfish’s various question types, including Single selection, Multiple selection, Open ended, Numeric open ended, Description, Rating stars, Slider, Ranking, Matrix single selection, Matrix multiple selection, Net Promoter Score (NPS), A/B test, Conjoint analysis, Max Diff, and Van Westendorp.
❇️ Sophisticated Branching Logic
Explore our guide on applying advanced skip logic to single-select questions, matrix questions, multi-selection questions, and more.
❇️ Screening Questions
Read our guide on how to use screening questions like a pro with Pollfish (to ensure only relevant participants take your survey).
❇️ AI Survey Builder
Read our guide on how to create surveys faster using Pollfish’s AI builder. Simply enter a prompt, and Pollfish will generate a well-formatted survey that you can then customize to your liking.
❇️ Survey Templates
Read our guide on Pollfish’s 17 survey templates, ranging from categories like brand feedback, product feedback, customer feedback, employee feedback, and more.
❇️ Conversational AI
Read our guide on how to carry real-time, one-on-one conversations with respondents at scale via AI.
❇️ And so much more…
Explore additional survey design features, including answer and question shuffling, multimedia capabilities (e.g., include videos or images), and so much more.
Note: Watch this video for more info on Pollfish’s questionnaire design features.
Sophisticated Audience Targeting Capabilities

Pollfish provides a wide array of targeting criteria, allowing you to reach even the most niche audiences:
❇️ Choose from 50+ audience filters in 6 categories:
- Demographics: Age, Gender, Hispanic Origin, Marital Status, Languages Spoken, Education Level, US Voter Registration, Household Income (US), Age & Gender of Child(ren) in Household, Type of Home, Pets in Household, Political Party Support, Hispanic Level of Acculturation, Parental Status / Pregnancy Status, Race, Device Type, Device Operating System (OS), Ethnicity, Number of Children in Household
- Geographic Criteria: US State, US Division, US DMA, US Region, US Statistical Area (CBSA), US County, US Zip Code
- Consumer Lifestyle: Beverage Consumption, Hobbies & Interests, Sports Participation, Gambling Participation, Music Streaming Services Use, Movie Theater Frequency, Home Movie Viewing Frequency, Video Game Participation, Video Game Consoles, Video Game Genres, Travel by Air for Business/Leisure, Vehicle Make/Brand Own or Lease, Vehicle Type Own or Lease, Health Ailment Diagnosis
- Employment & Occupation: Employment Status, Industry Work In, B2B Department, Number of Employees, Job Title
- Behavioral Data: Brands Purchased (In-Store), Online Shopping: Retailer, In-Store Shopper, Category Buyers, Retail Channels Shopped (In-Store), Websites Visited, Retail Channels Shopped (Online)
- Media: Video Streaming Services Used
❇️ Set Custom Quotas

Pollfish makes it easy to set custom quotas based on age, gender, income levels, or any other audience parameters.
Note: For more info on Pollfish’s audience targeting features, see this video.
Powerful Built-In Analytics

Pollfish offers powerful, built-in analytics tools that eliminate the need to export survey data to external platforms:
❇️ Demographic filtering: In just a few clicks, filter to only view survey results from specific demographic groups (e.g., compare male vs. female responses).
❇️ Response-based filtering: View survey results from only those who selected a certain answer (e.g., only view results from those who said they’re avid golfing fans).
❇️ Advanced Insights Builder: Create custom charts using multiple variables in just a few clicks, as demonstrated below:

❇️ Statistical significance testing: Optionally enable statistical testing for every chart for clear, color-coded results.
❇️ Custom branding: Customize each chart to match your brand’s color palette.
❇️ Built-in PowerPoint creation: Pollfish allows you to create and export PowerPoint slide decks directly within our platform. This streamlines your workflow by eliminating the need to switch between multiple tools, making it faster and more efficient to add charts.
❇️ Flexible export options: Export survey results in multiple formats, including PDF, Excel, crosstabs, SPSS, and more.
High-Quality Audience Data You Can Confidently Rely On
Since Pollfish owns and operates our own first-party respondent communities through parent company Prodege, we maintain strict quality controls throughout the entire data collection process. Our recent article, "3 Survey Data Quality Issues Sabotaging Your Research (& How We Fix Them)" details these measures, including:
❇️ Verifying respondent identities through diverse activities: We verify respondent identities through activities beyond surveys, such as watching videos, playing games, or shopping online. These activities help us confirm that panelists are real people and not bots, which is increasingly important with the rise of AI.
❇️ 14-Day Evaluation Period: Before taking client surveys, new panelists must complete extensive internal surveys designed to filter out low-quality responders.
❇️ Purchase receipts enable verification of self-reported preferences: When panelists upload purchase receipts, we may cross-reference this data with their profiles. For example, if someone frequently buys dog food but their profile indicates they don't have any pets, we may flag this for review.
❇️ Trust Scores: Each panelist has a trust score, with higher scores leading to more earning opportunities (which incentivizes higher quality survey responses).
❇️ Fraud Detection Technologies: We use advanced fraud detection technologies, including multi-level registration verification (e.g., CAPTCHA, Device ID Reputation, 100% Double Opt-In, etc.), tech consistency (carrier/targeting alignment check), single user IDs, sophisticated anti-VPN measures, and more.
❇️ Manual Review of Open-Ended Responses: Each and every open-ended response is manually reviewed by our team to ensure quality.
As several Pollfish customers have stated on Trustpilot:
"The most important point to make is that I trust the responses of my survey. My target audience was very specific and I could tell that the responses were legitimately coming [from] subjects in my target audience.”
– Read the full review here
“Each time I use this service I am blown away by the speed with which the responses come in and with the detail which most of them include. You can tell that the respondents take this very seriously. They must really enjoy doing it.”
– Read the full review here
“I had to get some data on a product in a tricky sector. It was proving challenging to attract participants to my study. I was able to quickly get results and some insights to be able to move forward with my work using Pollfish.”
– Read the full review here
“I was very satisfied with the results I got from Pollfish. My company was conducting market research and received very insightful help from consumers who were all verified homeowners.”
– Read the full review here
Transparent Pay-Per-Response Pricing, Unlimited Seats & No License Fees
Many competing enterprise survey platforms charge high monthly subscription fees, with significant additional costs for each new user.
❇️ In contrast, Pollfish charges only per response, and allows unlimited seats at no extra cost. This is a major advantage for large enterprise companies with numerous departments and employees who need access to the platform (whether to launch surveys, view and analyze results, and so on).
❇️ As you build your survey, pricing is always clearly displayed upfront, with no surprise or hidden fees.

Here's a breakdown of the survey cost example above:
- Base Cost: Each response costs $0.95.
- Added Filters: Three extra filters (Marital Status, Number of Children, Pets in Household) are applied, each adding $0.55 to the cost per response.
- Adjusted Cost: With these filters, the cost per response is now $2.60 ($0.95 + $0.55 + $0.55 + $0.55).
- Total Survey Cost: For 500 completed responses, the total survey cost is visibly displayed upfront as $1,300 ($2.60 x 500).
- Dynamic Pricing Calculator: See the total survey cost instantly update as you add or remove additional filters. Pricing is transparent at all times.
As several Pollfish customers have stated on Trustpilot:
“The dollar amount they quote you in their cost calculator tool, and the number they show when you're developing the survey, is the number you pay. I was burned multiple times by [competitor] charging me unexpected amounts and making it difficult to quit an expensive subscription. I'm so happy to have found Pollfish as an alternative. Their support team also responds VERY quickly to chat messages and has been tremendously helpful the few times I had questions.”
– Read the full review here
“The pricing is clear and transparent from the beginning. The results come quickly and can be downloaded in different formats and with different filters. What we like most is the ability to filter the results and analyze them separately for each segment. We highly recommend this platform.”
– Read the full review here
“They charge based on the completed response. It is very fair and transparent. As a researcher, I have used many survey platforms, but they are the best so far.”
– Read the full review here
Fast Turnaround Times (From a Few Hours to Several Days)
Because Pollfish owns and manages its own respondent communities (through parent company Prodege), we are able to deliver incredibly fast turnaround times.
❇️ For general population audiences, you can receive several hundred responses in just a few hours, as several customers have noted:
“I needed a 25 question survey answered, and was able to get 500 completed surveys in 8 hours with Pollfish. The presentation of the results is very impressive and the demographics information Pollfish provided is invaluable.”
– Read the full review here
“The thing that amazes me most is how quickly you can get your data results back. So fast! Usually in a couple of hours.”
– Read the full review here
“I honestly thought the results would take days, and I was starting to get worried because I was using Pollfish for a quarterly goal and I was trying to make it before the deadline. However, I received the results in literally just a few hours!”
– Read the full review here
“Much more affordable than all the alternatives I found, and I had all my results ready within just a couple of hours.”
– Read the full review here
❇️ For more specific audience segments (e.g., pet owners in NYC earning over $100,000 who frequently buy dog food), the turnaround time is naturally longer, typically a couple of days. As several customers have noted:
“I'm amazed at how quickly the platform was able to deliver rich, segmentable data from over 500 respondents. I had feature-ready insights in only 3 days.”
– Read the full review here
“I've used Pollfish before so when I needed to test concepts for a new business pitch in 5 countries over the holiday, I turned to Pollfish. The surveys were easy to set up, allowed me to select my very specific target and launched right away. Within a couple of days I had my results in an easy to interpret, actionable format well within my budget.”
– Read the full review here
“I found the platform super-easy to use and we received feedback on our new name and logo from our target audience within a few days.”
– Read the full review here
Powerful Administrative & Collaboration Tools
As stated, Pollfish offers unlimited team seats and no license fees.
On the backend, you can configure robust administrative and collaboration features via our intuitive dashboard. For example:
❇️ Easily add team members and assign roles — individually or in bulk:
- Admin: Can create and launch surveys. Can access and modify payment methods, and view invoices. Can add, remove, and modify team members.
- User: Has the same permissions as an Admin, except they cannot add, remove, or modify team members.
❇️ Users can quickly view their assigned teams under the “My Teams” section.
❇️ Easily switch between different team views using an intuitive toggle option in the main menu.
❇️ Brand your surveys by adding your company logo, which will appear at the top of the survey results page for team members.
❇️ Organize projects by creating folders for different surveys.
Interested in Learning More?
We invite you to schedule an introductory call to learn more about how Pollfish can fulfill your specific needs.
2. Qualtrics

Qualtrics is an enterprise survey software which categorizes its features in 3 key areas:
1. Customer Experience
- Voice of Customer
- Omnichannel Experience Management
- Digital Experience Analytics
- Website & App Feedback
- Location Experience Hub
- Online Reputation Management
- Contact Center Analytics
- Quality Management & Compliance
- Agent Coaching
- Edge Instant Insights
2. Employee Experience
- Employee Engagement
- Employee Pulse
- Employee Research
- Candidate Experience Management
- Employee Onboarding & Exit
- 360 Development Feedback
- Employee Retention Analytics
- Continuous Employee Listening
3. Strategy & Research
- Strategic Market Research
- Product Research
- Brand and Communication Research
- User Experience Research
- Edge Audiences
3. SurveyMonkey

SurveyMonkey offers several features and capabilities that enterprise companies may find useful:
- Multi-survey dashboards
- Centralized admin dashboard (easily create, manage, and organize users)
- SSO (Single Sign-On)
- HIPAA compliance
- Sophisticated data encryption
- 2FA (Two-Factor Authentication)
- Powerful integrations with Salesforce, HubSpot, Marketo, Tableau, Microsoft Power BI, and more
4. Alchemer

Alchemer (formerly known as SurveyGizmo) is an enterprise survey software with various features and capabilities:
- Collect feedback through traditional market research surveys or in real-time as customers are using your app or website.
- 400+ integrations (e.g., Salesforce, Slack, Tableau, and more)
- Flexible workflow automations
- Role-based dashboards and reports
- ISO 27001 and SOC2 Type 2 Certifications
- Data privacy (EU GDPR compliance)
5. SmartSurvey

SmartSurvey offers several features and capabilities that enterprise companies may find useful:
- Custom branded surveys & forms
- Email, SMS, web, and popups to collect feedback through multiple channels
- CRM, helpdesk, and database integrations (e.g., Salesforce, Monday.com, HubSpot, Microsoft Teams, Pipedrive, Slack, etc.)
- AI-powered insights and analysis
- GDPR, CCPA, and HIPAA compliant
- UK-based security measures
6. SurveySparrow

SurveySparrow offers several features and capabilities that enterprise companies may find useful:
- Custom domains to host surveys from your company’s site
- Custom CSS to style online surveys
- SPSS export for further statistical analysis
- Data security measures like GDPR compliance
- Sub accounts for various teams in your company
- SSO (Single Sign-On)
- Integrations (via webhooks, API, Zapier, etc.)
Interested in Learning More About Pollfish?
We invite you to schedule an introductory call to learn more about how Pollfish can fulfill your specific needs.
12 Best Brand Tracking Software Tools for 2026 (by Category)
12 Best Brand Tracking Software Tools for 2026 (by Category)
![]()
Brand tracking software generally falls into two broad categories:
- Survey-focused platforms, which are ideal for collecting structured, quantitative data directly from your target audience to help you measure brand awareness, track perception over time, and more.
- Brand monitoring software, which specializes in tracking online mentions of your brand across social media platforms, news outlets, forums, review sites, and more.
In this post, we cover the following survey-based brand tracking software:
- Pollfish: Our survey-focused brand tracking software offering transparent pay-per-response pricing, quick turnaround time, and high-quality data. Well-suited for companies of all sizes, from small and medium businesses to large enterprises.
- Qualtrics: A survey platform whose pricing may be cost-prohibitive for smaller and medium-sized companies due to high monthly fees.
- Tracksuit: Measures brand health using recurring surveys and simple visual dashboards.
- Quantilope: A market research platform offering various research tools, including surveys.
- Latana: A research platform focused on non-incentivized surveys and large sample sizes.
- Kantar: Offers a suite of brand guidance and research tools and services.
- Attest: A consumer research platform offering multi-market surveys and brand tracking dashboards.
And then we cover the following monitoring-based brand tracking software:
- Brandwatch: A social listening platform with a built-in influencer marketing solution.
- Meltwater: Well-established reputation management tool for tracking mentions across different types of media.
- Awario: Offers brand management and sentiment analysis.
- Brand24: Monitors social media mentions and tracks metrics using AI.
- Ahrefs: An SEO platform that can be used to track branded search terms, backlinks, and visibility across the web.
1. Pollfish: DIY Survey Platform for Brand Tracking
Pollfish is a DIY survey platform used by companies of all sizes for a variety of research needs, with brand tracking being one of the most popular.
You can choose from pre-built brand research templates like Brand Awareness, Brand Diagnostic, Brand Perceptions, and CPG Brand Awareness & Perceptions, or create your own survey from scratch.
While the platform is easy to use, it also offers powerful features that let you customize every part of your survey to match your research goals.
In this section, we’ll cover:
- How to use Pollfish, from designing your survey to selecting your target audience and analyzing results.
- Pollfish’s first-party respondent communities, which provide higher-quality audiences and more reliable data.
- Our transparent, pay-per-response pricing model that’s more affordable and upfront than traditional subscriptions.
- Pollfish’s fast turnaround times, just a few hours for general audiences, or a few days for more niche segments.
- Complimentary support from seasoned market researchers to guide you on survey design, targeting, and analysis.
Let’s dive in.
How to Use Pollfish’s Brand Tracking Software in 3 Easy Steps
- Build your brand tracking survey: Start with one of our brand research templates or create a custom survey from scratch.
- Choose your target audience: Pollfish offers flexible audience targeting, so you can either reach general populations or highly specific groups based on your research goals.
- Review and analyze your results: View your survey data directly in the Pollfish platform. You can filter responses, compare segments, and create custom charts in your brand’s colors, all without needing to export to Excel.
Below, we’ll look at each of these in more detail.
Step 1: Design Your Survey
❇️ Brand Tracking Templates
![]()
Pollfish offers brand tracking templates built by research experts, so you don’t have to start from zero.
Benefits of using Pollfish’s templates include:
- Save time by starting with professionally written, customizable questions.
- Follow market research best practices to ensure clean, reliable data.
- Maintain consistency across surveys to track brand changes over time.
- Reduce setup errors with built-in logic and structure.
- Get results faster by minimizing survey design work upfront.
Popular templates include:
- Brand Awareness: Measure how many people have heard of your brand.
- Brand Perception: Understand how your brand is viewed by consumers.
- Brand Diagnostic: Assess overall brand health at a specific point in time.
- CPG Brand Awareness & Perceptions: Track familiarity and perception of Consumer Packaged Goods (CPG) brands.
❇️ 16 Question Types
Pollfish offers 16 different question formats to choose from, including multiple choice, open-ended, NPS, MaxDiff, A/B tests, and more, giving you the flexibility to design surveys that match your research needs.
Read the full list of question types here.
❇️ Advanced Questionnaire Design Features
Pollfish has a variety of advanced features that help you collect clean, unbiased data and tailor the survey experience for each respondent. Let’s take a look at some that you may want to use in your brand tracking surveys:
1. Skip Logic Branching
Guide participants through different paths in your survey based on how they respond to earlier questions.
- Example: Ask “Which type of skincare products have you purchased in the last month?” If they select “Moisturizers,” they’re shown questions tailored to that category. If they choose “Acne treatments,” they’re routed to a different set of questions focused on that product type. This ensures each respondent gets a relevant experience, and your data reflects meaningful subgroup insights.
2. Shuffle Answers
Randomize the order of answer choices to prevent order bias.
- Example: When asking respondents to choose their favorite athletic shoe brand, some may unconsciously choose the first option if the list is always presented in the same order. Shuffling the choices ensures that no brand is unfairly favored by its position.
3. Randomize Questions
Change the order in which questions are shown to different respondents.
- Example: If your survey includes 10 brand attribute questions, randomizing them can help reduce response patterns or fatigue, especially if someone tends to rush through later questions.
4. Screening Questions
Filter out participants who don’t meet specific criteria before they enter the main portion of the survey.
- Example: If someone selects “I’ve never heard of this brand,” then they won’t be able to proceed with the survey.
5. “Other” and “None of the Above” Options
Quickly add these common answer choices to relevant questions with one click.
- Example: When asking, “Which of the following brands have you heard of?” including “Other” and “None of the above” helps you capture more complete and accurate responses without needing to add those options to every question manually.
Note: This is just a small sampling — explore the full list of survey design capabilities here.
Step 2: Select Your Target Audience
Pollfish gives you access to a broad and diverse set of respondents through our first-party network (through parent company Prodege), with tools to help you precisely define your ideal audience.
❇️ 50+ Audience Filters Across 6 Categories
Target respondents via 50 filters in six categories, including Demographics, Geographic Criteria, Consumer Lifestyle, Employment & Occupation, Behavioral Data, and Media.
For example, you can survey urban professionals aged 30 to 45 who read digital news daily, work in tech or finance, and regularly dine out at least three times a week.
❇️ Target Specific Shoppers
Refine your audience to include consumers who’ve purchased specific brands or visited particular stores, based on verified receipt data.
For example, instead of targeting all athletic shoe buyers, you can narrow your audience to people who’ve recently purchased from Nike, Adidas, or New Balance, or who regularly shop at retailers like Dick’s Sporting Goods or Foot Locker. (Later on, we cover in more detail how we verify that they’ve actually made these purchases.)
❇️ Set Audience Quotas
Ensure a balanced sample by setting quotas on attributes like age, gender, income, etc.
For example, if you want to compare perceptions across income groups, you can set quotas to ensure one-third of your sample earns under $50K, one-third earns $50 to 100K, and one-third earns over $100K.
That’s only scratching the surface of what you can do with Pollfish targeting, but you can view the full video demonstration here.
Step 3: Analyze the Results
Once responses start coming in, Pollfish gives you a range of tools to explore, filter, and share your findings. There’s no need to export data to external platforms unless you want to.
❇️ Visualize Results Instantly
You can view your survey result data in real time without waiting for a post-survey download. Results are automatically displayed as color-coded charts, graphs, and tables, making it easy to understand trends at a glance.
❇️ Filter by Segment or Response
Pollfish lets you break down your data by specific audience segments or individual responses.
For example, if you want to see how Gen Z respondents rated your brand versus Gen X, you can isolate that group and instantly update your visuals. You can also filter by specific answer choices: for instance, viewing only those who selected “highly likely to purchase.”
❇️ Analyze Multiple Variables at Once
You can layer multiple filters to uncover deeper insights without needing to export your data.
Let’s say you want to compare brand perception among women aged 35 to 44 who live in urban areas and earn over $75K annually. You can easily set those filters and see the exact results for that audience. The platform will automatically update your charts so you can compare across segments without additional setup.
❇️ Match Charts to Your Brand Colors
Pollfish allows you to customize the look and feel of your charts by applying your brand’s color palette. This helps ensure that your reports feel consistent with your company’s visual identity, which is especially important when sharing insights with stakeholders, presenting to clients, or incorporating charts into larger brand deliverables.
❇️ Statistical Testing
Pollfish includes built-in stat testing so you can validate whether observed differences in your data are meaningful.
Suppose 82% of respondents aged 25 to 34 recognize your brand, compared to 68% of respondents aged 45 to 54. Pollfish can automatically test this difference for statistical significance and highlight the results within your charts. No need to use manual tests or export to another tool.
❇️ Build Presentations in the Platform
Pollfish lets you start building your presentation as soon as responses begin to roll in, so you don’t have to wait until the survey is complete. You can organize insights, add visualizations, and begin shaping your narrative while data is still being collected. Once you're ready to finalize, export everything into an editable PowerPoint file to polish and share with your team.
❇️ Export Your Data
You can download your results as a PDF, Excel file, SPSS dataset, or crosstabs, depending on your workflow. This flexibility makes it easy to bring your data into whatever tool your team uses for deeper analysis or final reporting.
These are only some of the analysis tools built into the Pollfish platform.
Pollfish’s High Audience Data Quality
For brand tracking to be meaningful, you need accurate, thoughtful responses from real people, not rushed answers from disengaged panelists or fraudulent bots. Here’s how Pollfish approaches audience sourcing and quality control.
❇️ Sourced from a Verified First-Party Network
Pollfish operates through a proprietary respondent network built and maintained by our parent company, Prodege. Unlike platforms that rely on third-party panel aggregators, our audience comes from a trusted ecosystem where respondents engage in real-world activities, such as uploading receipts, shopping online, playing games, or completing microtasks. These behavioral touchpoints create a built-in safeguard against bots and fake users.
As one of our customers shared on Trustpilot: "The most important point to make is that I trust the responses of my survey. My target audience was very specific and I could tell that the responses were legitimately coming [from] subjects in my target audience.”
❇️ Respondents Opt In, Not Burn Out
Pollfish respondents aren’t bombarded with constant survey invites. Instead, they choose when to participate. This opt-in model attracts more thoughtful and attentive participants, which is essential when measuring nuanced brand perceptions over time.
❇️ 14-Day Evaluation Before the First Question
Before new panelists ever see a live survey, they go through a 14-day onboarding phase where they complete internal profiling surveys. Only those who demonstrate consistent, high-quality participation are invited into the active respondent pool, so your brand tracking survey data is built on a solid foundation from the start.
❇️ Fraud Prevention Built into Every Survey
Pollfish applies multiple layers of quality control to each response. This includes:
- Unique user IDs to block duplicates
- Attention checks and trap questions
- Speeding detection and gibberish filtering
- Anti-VPN and device fingerprinting
- Straight-lining detection
- Human oversight for each and every manual response
❇️ Trust Scores That Promote Better Behavior
Every respondent is assigned a dynamic trust score based on their response patterns and long-term behavior. Higher scores unlock more opportunities within the Prodege ecosystem, creating a real incentive for thoughtful, honest participation.
Like one of our customers noted on Trustpilot:
“Each time I use this service I am blown away by the speed with which the responses come in and with the detail which most of them include. You can tell that the respondents take this very seriously. They must really enjoy doing it.”
Note: These are just some of the ways that we ensure your brand tracking insights are based on clean, reliable data. Learn more here.
Pay-per-Response Pricing That Scales with Your Needs
Pollfish uses a usage-based pricing model that starts at just $0.95 per completed response, making it easy to scale your brand tracking efforts up or down depending on your goals and budget.
❇️ No Subscriptions, No Commitments
You’re never locked into a long-term plan or paying for unused response quotas. Whether you're launching a single brand tracking survey or running them on a recurring basis, you only pay for what you use.
As noted on Trustpilot by a Pollfish customer, “They charge based on the completed response. It is very fair and transparent. As a researcher, I have used many survey platforms, but they are the best so far.”
❇️ Unlimited Team Members Included
Collaborate freely across all departments at no extra cost. Pollfish allows unlimited users under one account, unlike other platforms that charge per seat.
Transparent Pricing with No Surprises

Pollfish makes it easy to understand exactly what you’re paying before you ever launch your survey.
❇️ No Hidden Fees
Your total cost is calculated based on the number of responses and any targeting filters you apply. There are no added charges behind the scenes.
As two of our customers shared on Trustpilot:
“The dollar amount they quote you in their cost calculator tool, and the number they show when you're developing the survey, is the number you pay. I was burned multiple times by SurveyMonkey charging me unexpected amounts and making it difficult to quit an expensive subscription. I'm so happy to have found Pollfish as an alternative. Their support team also responds VERY quickly to chat messages and has been tremendously helpful the few times I had questions.”
“The pricing is clear and transparent from the beginning. The results come quickly and can be downloaded in different formats and with different filters. What we like most is the ability to filter the results and analyze them separately for each segment. We highly recommend this platform.”
❇️ Full Price Transparency
As you build your survey and apply targeting filters, your total cost is clearly displayed in real time in the upper right-hand area.
For example:
- Base cost per response: $0.95
- Add targeting for household income over $150K: +$0.55
- Add targeting for respondents who shop at premium grocery stores: +$0.55
- Final cost per response: $2.05
Need 800 responses for your brand tracking survey? You’ll pay exactly $1,640, visibly displayed upfront — no surprises, no hidden fees.
This level of clarity makes budgeting for brand tracking surveys simple and predictable.
Fast Turnaround Time From a Few Hours to a Few Days
When you're tracking brand performance, timing matters. Pollfish helps you get results quickly, so you can take action without delay.
❇️ General Population Surveys Typically Come Back Within a Few Hours
If your brand tracking survey targets a broad audience, like adults in the U.S., smartphone users, or pet owners, you can often collect hundreds of responses within just a few hours. This makes it easy to monitor shifts in awareness or perception shortly after a product launch, PR event, or ad campaign.
Like our customers have pointed out on Trustpilot:
"The thing that amazes me most is how quickly you can get your data results back. So fast! Usually in a couple of hours."
“I needed a 25 question survey answered, and was able to get 500 completed surveys in 8 hours with Pollfish. The presentation of the results is very impressive and the demographics information Pollfish provided is invaluable.”
“I honestly thought the results would take days, and I was starting to get worried because I was using Pollfish for a quarterly goal and I was trying to make it before the deadline. However, I received the results in literally just a few hours!”
– Read the full review here
“Much more affordable than all the alternatives I found, and I had all my results ready within just a couple of hours.”
❇️ Niche or Highly Targeted Audience Surveys Usually Take a Few Days
If you’re targeting a more specific segment, such as high-income earners who buy from premium skincare brands, or Gen Z consumers in urban areas with a strong interest in sustainability, it may take a few days to complete. That’s because these groups are smaller and more defined, but Pollfish still delivers faster results than most other platforms in the same category.
Our customers have pointed out how quickly results come back in Trustpilot reviews:
“I'm amazed at how quickly the platform was able to deliver rich, segmentable data from over 500 respondents. I had feature-ready insights in only 3 days.”
“I've used Pollfish before so when I needed to test concepts for a new business pitch in 5 countries over the holiday, I turned to Pollfish. The surveys were easy to set up, allowed me to select my very specific target and launched right away. Within a couple of days I had my results in an easy to interpret, actionable format well within my budget.”
Complimentary Advanced Support from Brand Tracking Research Experts
Designing a great brand tracking survey isn’t always straightforward, especially if you’re new to market research or juggling multiple priorities. That’s why Pollfish offers free, on-demand support from seasoned market research experts who know the ins and outs of survey design, audience targeting, and data analysis.
❇️ Free 24/7 Support (Yes, Really)
Our support team is available 24/7 via live chat with no additional fees and no hidden limitations. And unlike platforms that rely on scripted chatbot responses, you’ll speak with real people who understand research.
Take it from one of our customers:
“The customer support agents were awesome. They responded to every question I had in a timely manner. (And before we even paid a cent!)”
❇️Help When You Need It, At Any Experience Level
Whether you’re launching your first brand equity survey or are an experienced market researcher seeking a second set of eyes, our team can help you choose the right approach, validate your targeting criteria, or sanity-check your questionnaire.
As noted by several Pollfish customers:
“The customer service I received was fantastic. Brilliant guidance that helped get high-quality results. I was really pleased with the outcome and highly recommend using them.”
“The customer service team is super responsive too for those more complex enquiries about the tool and criteria. All in all this experience has been way easier (and cheaper) than any other 'big players' out there”
“I love this product. I feel like it gives me enterprise grade market survey tech at a consumer price. Highly recommend. I love how responsive the customer support team is.”
Get Started with Pollfish
Ready to start running brand tracking surveys? Pollfish makes it easy to get started.
You have three flexible options:
- Create a free account: Explore the platform and start building your brand tracking survey at your own pace. No credit card required.
- Schedule a demo walkthrough: Get a guided walkthrough tailored to your brand tracking goals.
- Inquire about full-service brand research through our parent company Prodege: Prefer to hand it off? Our in-house research team can manage everything for you from survey design to audience selection, data analysis, and a final report customized to your objectives.
2. Qualtrics
Qualtrics is best suited for large enterprises that need brand tracking survey capabilities. It’s often priced out of reach for smaller teams. We discuss what differentiates Pollfish in our article on the best alternatives to Qualtrics.
Key Features
- Enterprise-grade customer survey tools with omnichannel distribution (email, SMS, digital, post-call, and more)
- AI-powered text and sentiment analysis
- Dozens of pre-built, expert-designed survey templates
- Custom dashboards and reports tailored to specific teams or roles
- Automated closed-loop customer feedback and ticketing workflows
- Real-time customer journey insights and VoC data routing
- Integrations with ticketing systems and CRM platforms
3. Tracksuit

Tracksuit is a brand tracking survey platform that’s great for marketing teams that want to track awareness, consideration, and preferences with an intuitive dashboard that’s easy to share and present.
Key Features
- Always-on tracking of brand awareness, consideration, and preference
- Visual dashboards showing performance across the full brand funnel
- Segment-level actionable insights by gender, region, and age
- Competitive benchmarking across messaging, values, and perception
- Timeline views to track brand growth and campaign impact over time
- Surveys managed by Tracksuit’s in-house research team
4. Quantilope

Quantilope is another tool that can help you run brand tracking surveys. It combines advanced methodologies like MaxDiff and conjoint analysis with automation and AI tools to streamline complex studies from setup to reporting.
Key Features
- 15 fully automated advanced research methods, including MaxDiff, TURF, and conjoint
- AI-powered co-pilot (quinn) to guide survey creation and analysis
- Drag-and-drop survey builder with pre-built templates
- Real-time data collection and analysis
- Automated tracking studies with flexible time-based filters
- Exportable dashboards and PowerPoint reports with statistical testing
- Integrated insights repository for long-term knowledge management
5. Latana

Latana is another brand tracking platform that can help you measure brand awareness and perception at scale via surveys.
Key Features
- Access to non-panel respondents for more representative sampling
- Fully integrated solution from data collection to insight generation
- Monthly dashboard updates with segment tracking and automated significance testing
- Flexible modular setup for adding markets, switching packages, or running ad-hoc research
- Real-time, ad-based sampling and machine learning-powered QA
- Intuitive dashboard with error margins and trend visualizations
6. Kantar

Kantar combines robust brand tracking tools with global panel access and full-service consulting. It’s designed for enterprises that need both DIY flexibility and high-touch strategic support for equity measurement and forecasting.
Key Features
- Extensive brand tracking tools, including BrandDynamics, BrandEvaluator, and BrandSnapshot
- Access to 170M+ global respondents in 100+ markets
- Custom survey design and expert consultation services
- Device-agnostic survey experiences to improve data quality
- Award-winning programming tools and question component library
- Integrated dashboards and visualizations for reporting and insight sharing
- Enhanced data reliability with connected datasets and fraud prevention
7. Attest

Attest is a flexible, self-serve survey platform that’s great for brands that need fresh, ongoing consumer insights across multiple regions.
Key Features
- Always-on brand tracking to monitor awareness and perception over time
- Localized surveys with translations and regional targeting
- Flat audience cost with no hidden platform fees
- Side-by-side segment comparisons and crosstab insights
- Custom research capabilities tailored to brand KPIs
- Expert research support included at no extra cost
- Reach up to 150M+ people in 59 countries with surveys in 70+ languages
Next, we’ll take a look at five monitoring-based brand tracking software options.
8. Brandwatch

Brandwatch is a robust social intelligence platform built for marketers who need to understand how their brand is discussed across the digital landscape. It excels at social listening, trend analysis, and competitive benchmarking, making it ideal for teams focused on brand perception and engagement.
Key Features
- Real-time monitoring across social media, news, blogs, forums, and broadcast media
- AI-powered sentiment analysis and trend detection
- Historical data access for long-term brand studies
- Share of voice tracking to compare brand visibility
- Influencer identification and marketing campaigns measurement
- Custom dashboards for brand health metrics and messaging impact
- Seamless integration with MarTech stacks for reporting and brand strategy
9. Meltwater

Meltwater offers a comprehensive suite for media intelligence, combining digital and traditional media monitoring with PR analytics and social listening. It's well-suited for organizations managing brand reputation, measuring media impact, and aligning comms with marketing strategy.
Key Features
- Monitoring of brand mentions across online, print, broadcast, and social media
- Reputation tracking with sentiment and advanced analytics
- PR campaign performance measurement and media outreach tools
- 360° reporting to evaluate strategy impact across departments
- AI-powered actionable insights for trend spotting and decision-making
- Tools for influencer marketing and consumer intelligence
- Social media management and audience engagement capabilities
10. Awario

Awario specializes in real-time social media monitoring across platforms like Twitter, forums, blogs, and news sites. It's built for teams that need to stay on top of conversations as they happen and react quickly to brand mentions or sales opportunities.
Key Features
- Real-time tracking of brand mentions across the web
- Brand sentiment analysis to gauge public opinion
- Boolean search for precise, flexible keyword tracking
- Influencer identification and conversation reach scoring
- Lead generation through Awario Leads, surfacing competitor complaints and product inquiries
- Email alerts and white-label reporting for streamlined workflows
- Multi-language, location-based monitoring with mobile access
11. Brand24

Brand24 offers simple, AI-enhanced media monitoring that makes it easy for small teams to track brand mentions, analyze sentiment, and generate competitive reports. It’s a strong fit for businesses that want reliable brand insights without the complexity of enterprise tools.
Key Features
- Real-time media monitoring across social, news, blogs, and reviews
- AI-powered brand sentiment analysis and topic identification
- Share of voice, influence score, and reach metrics
- Automated alerts and anomaly detection
- Customizable, white-label reports for stakeholders
- AI Brand Assistant for insights, comparisons, and recommendations
- Clean workspace with filters, folders, and starred mentions
12. Ahrefs

Ahrefs is a powerful SEO and content marketing platform designed to help teams monitor branded search performance, competitor visibility, and overall digital presence. While not a traditional brand tracker, it excels at showing how your brand performs in organic search and link-building efforts.
Key Features
- Brand Radar tracks mentions across websites, AI platforms, and competitors
- Rank Tracker monitors branded keyword rankings and share of voice
- Site Explorer analyzes traffic, backlinks, and competitive visibility
- Content Explorer surfaces brand mentions across billions of indexed pages
- Alerts notify you of changes in backlinks, rankings, and brand presence
- SEO dashboards and reports consolidate marketing campaigns' performance data
- AI Content Grader and auditing tools optimize branded content at scale
Get Started with Pollfish
To begin using Pollfish:
- Create a free account
- Schedule a demo walkthrough
- Inquire about our full-service brand research through our parent company, Prodege

Top 20 Market Research Companies in 2026: Key Strengths
Top 20 Market Research Companies in 2026: Key Strengths

Market research companies come in many different types, but most can be broadly categorized into three main buckets:
- Full-Service Market Research Firms: These firms provide comprehensive, end-to-end market research services spanning quantitative methods like surveys to qualitative approaches such as focus groups and one-on-one interviews.
- Industry Intelligence & Custom Research Firms: In addition to offering full-service consulting and bespoke research, these companies also provide access to existing data, reports, studies, and industry insights they have previously compiled. Their industry expertise is a key differentiator.
- Self-Service Survey Platforms: These technology platforms allow businesses to conduct their own market research surveys, though many also offer supported or fully-managed services.
Even though these buckets are a helpful starting point, they aren’t mutually exclusive. Plus, within each bucket, each company will have its own unique strengths and specialties.
In this guide, we'll explore 20 top market research companies and what sets them apart in today’s competitive landscape. We'll start with our parent company, Prodege, and our DIY survey tool, Pollfish.
Here’s a high-level summary of each company’s key strengths:
- Prodege: As the largest single panel owner in the world, with over 100 million respondents across 125+ countries, Prodege (Pollfish’s parent company) is a full-service market research firm renowned for exceptional survey data quality. You can opt for an end-to-end service or select specific areas you need help with, including research design, survey programming, sample & fielding, data processing & analysis, reporting, and more.
- Pollfish: Our powerful DIY survey platform with rigorous data quality measures, a flexible and transparent pay-per-response pricing model, and a quick turnaround time from a few hours for general population audiences to a few days for more specialized niches. We offer robust questionnaire design, audience targeting, and data analysis capabilities that seasoned market researchers appreciate.
- Kantar: Best known for their brand tracking & brand equity measurement capabilities, although they offer a vast range of other market research services.
- Mintel: Offer consulting and on-demand databases & reports, including GNPD (Global New Product Database), where you can learn about 40,000+ new products launched across 86 markets and 46 CPG categories every month.
- Bixa: Market research firm specializing in Gen Z insights (although they also provide comprehensive research services across other demographics and markets).
- MRI-Simmons: Best known for their in-depth consumer data and national studies, particularly their MRI-Simmons USA study.
- Ipsos: Offer custom research and consulting across a wide variety of sectors, but best known as a leader in public opinion polling and political research.
- Nielsen: Best known for their TV rating & audience measurement capabilities.
- Suzy: Best known for their survey platform capabilities. Also offer a unique feature called Suzy Live, where you can run multi-person focus groups, 1-on-1 interviews, and in-home product testing.
- SG Analytics: While they offer a wide variety of solutions, as it pertains to market research, they provide full-service consulting (e.g., primary, secondary, quantitative, and qualitative market research).
- Gartner: Market research giant that's best known for their market research literature and analyses across various technology sectors.
- Forrester: Market research powerhouse that provides data across multiple industries, with a particular focus on technology vendors.
- IDC: Consulting firm that specializes in IT and tech research.
- Drive Research: Boutique market research agency that can help with a wide range of quantitative and qualitative research needs.
- Statista: Massive data aggregator, with insights, facts and stats across 170 industries and 150+ countries.
- IBISWorld: Best known for their wide range of industry research reports across 5,000+ industries.
- MarketResearch.com: Marketplace that boasts an extensive catalog of market research reports and analyses from a wide variety of sources.
- Attest: Best known for their survey platform capabilities. Can also help you run qualitative research.
- Qualtrics: A survey platform that’s best suited for enterprise companies.
- Remesh: Offers a unique approach to market research, where participants can respond and vote on each other’s answers.
Now that you have a high-level view of what each market research company excels at, we'll examine their capabilities in more detail.
1. Prodege (Pollfish’s Parent Company)

Prodege stands out as a company that combines full-service research capabilities with advanced technology.
Over time, Prodege has built and acquired a suite of market research tech platforms, notably Pollfish — our widely used survey tool ideal for companies conducting DIY research. (More details on Pollfish in the next section.)
Additionally, Prodege manages a vast network of audience panels and communities, boasting over 100 million respondents spanning more than 125 countries.
What Makes Prodege Unique: Survey data quality isn't just a priority for us — it's our foundation. We have a 40-person Panel Support, Security, and Compliance Department dedicated to this work every day.
We recently published The 3 Survey Data Quality Issues Sabotaging Your Research (& How We Fix Them) — an in-depth look at the stringent quality standards and processes we follow.
Our commitment to high data quality underpins every aspect of our offerings.
As it pertains to Prodege's full-service research offering, you can either opt for an end-to-end service (where we manage the entire survey process from start to finish) or pick specific areas where you need support, including:
- Research design
- Survey programming
- Sample & fielding
- Data processing & analysis
- Reporting
We also provide qualitative research services, including interviews, focus groups, and other methodologies.
Here's what Remesh had to say about working with us:
“Working with Prodege has allowed us to provide quality sample and a smooth recruitment process from beginning to end for our large-scale qual sessions. We can always count on the team for fast recruitment programming, excellent screening and quota delivery, low incidence rate audiences, and timely turnaround for all our projects. The customer service of their project management team is unmatched.”
You can also take advantage of our powerful data visualization tools that make it incredibly simple to slice and dice data and create complex charts using multiple variables:
As BuzzFeed have noted:
“Prodege has been a valuable asset in helping to prove BuzzFeed’s effectiveness. The quick turnaround of results within the Data Viz platform has allowed us to better service our advertising partners in delivering valuable campaign insights. The self-serve platform gives us the flexibility to format and export in a way that meets our specific needs. Prodege has even gone the extra mile and customized the PowerPoint slides to use our unique color scheme and layout.”
Interested in learning more about Prodege?
We invite you to:
2. Pollfish
Pollfish (our own product) is a powerful DIY survey platform with robust questionnaire design, audience targeting, and data analysis capabilities that seasoned market researchers appreciate.
Pollfish’s key benefits include:
- Rigorous data quality measures, which we explore in detail in our article on the data quality issues that can negatively impact your research.
As several customers shared on Trustpilot:
"The most important point to make is that I trust the responses of my survey. My target audience was very specific and I could tell that the responses were legitimately coming [from] subjects in my target audience.”
– Read the full review here“Each time I use this service I am blown away by the speed with which the responses come in and with the detail which most of them include. You can tell that the respondents take this very seriously. They must really enjoy doing it.”
– Read the full review here
- Flexible and transparent pay-per-response pricing model, starting at $0.95 per response, with no subscriptions, long-term commitments, or hidden surprise charges.
As several customers shared on Trustpilot:
“They charge based on the completed response. It is very fair and transparent. As a researcher, I have used many survey platforms, but they are the best so far.”
– Read the full review here“The dollar amount they quote you in their cost calculator tool, and the number they show when you're developing the survey, is the number you pay. I was burned multiple times by [competitor] charging me unexpected amounts and making it difficult to quit an expensive subscription. I'm so happy to have found Pollfish as an alternative. Their support team also responds VERY quickly to chat messages and has been tremendously helpful the few times I had questions.”
– Read the full review here“The pricing is clear and transparent from the beginning. The results come quickly and can be downloaded in different formats and with different filters. What we like most is the ability to filter the results and analyze them separately for each segment. We highly recommend this platform.”
– Read the full review here
- Industry leading turnaround time, from a few hours for general population audiences to a few days for more specialized niches. As several customers shared on Trustpilot:
Review for a general population survey:
“I needed a 25 question survey answered, and was able to get 500 completed surveys in 8 hours with Pollfish. The presentation of the results is very impressive and the demographics information Pollfish provided is invaluable.”
– Read the full review hereReview for a specialized niche:
“I'm amazed at how quickly the platform was able to deliver rich, segmentable data from over 500 respondents. I had feature-ready insights in only 3 days.”
– Read the full review here
In addition, Pollfish offers a feature called Conversational AI, which lets you have one-on-one conversations with respondents at scale, and gain unique qualitative insights. This is particularly useful for brand tracking (e.g., sentiment or perception), post-experience feedback, concept or creative testing, and more.
Interested in learning more about Pollfish?
- Create a free account, no credit card required.
- Schedule a demo call.
3. Kantar
Kantar is a global leader in brand measurement and consumer insights. They offer various solutions, including
- Brand tracking & brand equity measurement: This is their flagship offering, and what Kantar is best known for. Through BrandZ, they offer extensive reports on 4.5 million consumers across 22,000 brands, in 538 categories and 54 markets.
- Market research services: They can help with survey design & consultation, global panel management, data visualization & dashboards, data defense & fraud prevention, brand tracking, and much more.
- Consumer panel research through Worldpanel, which tracks purchase and usage behaviour data through the largest consumer panels in the world.
- Media effectiveness & audience measurement: According to their site, Kantar is an indispensable partner to 96 of the world’s 100 biggest advertisers.
- Innovation & product development: They offer solutions for idea screening, concept testing, package design screening & testing, and more.
4. Mintel

Mintel is a global leader in consumer market intelligence, offering various solutions, such as:
- On-demand databases and reports, including:
- Global New Products Database: Learn about 40,000+ new products launched across 86 markets and 46 CPG categories every month.
- Global Consumer Data: Learn about what consumers want across 36 markets generating 85% of the world's GDP.
- Market Dynamics: Connect the dots between market size data, consumer sentiment, and brand innovation.
- Consulting: They can help with primary research, social listening, predictive modeling, trends & foresight, competitive intelligence, mystery shopping, ideation workshops, and more.
- Competitive market intelligence: Delivered through a platform called Comperemedia, which is a company owned by Mintel.
- AI Tools: Includes Mintel Spark (an AI concept generator ideal for early innovation stages) and Mintel Leap (which provides instant answers from their extensive data libraries).
5. Bixa

Bixa is a market research firm specializing in Gen Z insights, though they also provide comprehensive research services across other demographics and markets.
Some of their key solutions include:
- Qualitative research services, including in-depth interviews, focus groups, ethnography and virtual ethnography, content analysis, video diary studies, mobile diary studies, subject matter expert interviews, UX audits and usability testing, and more.
- Quantitative research services, including surveys, experiments, data analytics, statistical modeling, market segmentation, trend analysis, forecasting, customer satisfaction measurement, and more.
- UX & product research services, uncovering the "why" behind user behaviors through user interviews, user testing, concept testing, CRO audits, video-based observational studies, and more.
- Market trend reports: Discover newly emerging trends via reports tailored to various industries, including fashion, technology, healthcare, and more.
6. MRI-Simmons

MRI-Simmons is best known for their in-depth consumer data and national studies, particularly their MRI-Simmons USA study (which merged the best elements of their legacy Survey of the American Consumer® study and Simmons’ National Consumer Study).
Diving deeper into some of their key solutions and offerings:
- MRI-Simmons USA study: MRI-Simmons states this is “the most comprehensive study on American consumers”, with reliable data on consumer attitudes, behaviors, media preferences, and more. It’s released each quarter, and they utilize address-based probabilistic sampling to ensure a nationally-representative sample which can help businesses create digital catalogs and optimize them based on actionable data rather than blind intuition..
- Catalyst Platform: A self-service tech platform that can help you generate clear, actionable insights based on MRI-Simmons' nationally representative consumer data.
- Local consumer insights, including their Market-by-Market Study, Local Flex Markets Study, and Local Market Report.
- Print measurement insights, including Magazine Media Brand Studies, Issue Specific Readership Study, and more.
- Studies on energetic technologies and cultural trends, including their Sports Fan Study, Podcast Study, Retail Trends Study, National Cannabis Study, LGBT & Gender Identity Study, Content Drivers Study, Trending Topics Study, Health & Wellness Study, Digital Life Study, Cord Evolution Study, Multi-Media Engagement Study, and more.
7. Ipsos

While Ipsos offers a wide variety of solutions, they're best known as a leader in public opinion polling. Diving deeper, some of their core solutions include:
- Public opinion polling & reports: While they regularly publish reports about a vast range of topics, they’re best known for their political polling reports.
- Innovation & Market Research: They can help companies seize market opportunities, test concepts, optimize pricing strategy, and more.
- Surveys: They can help you launch surveys via the Ipsos.Digital Platform, and connect you with pre-recruited respondents.
- Brand strategy: They can help you track your brand's performance against competitors.
- Customer Experience (CX) & Loyalty: They can help you measure customer satisfaction (e.g., Net Promoter Score) across the customer journey.
8. Nielsen

While Nielsen offers a wide variety of solutions, they’re best known for their TV rating & audience measurement capabilities. Diving deeper, some of their core solutions include:
- Audience measurement, including TV & streaming measurement, cross-media measurement, digital measurement, audio measurement, and more.
- Media planning, including audience segmentation, competitive intelligence, scenario planning, and more.
- Marketing optimization, including marketing outcomes and sports & games.
- Content metadata, including audio metadata, sports metadata, video metadata, and contextual video data.
- Datasets and reports across a vast range of industries.
9. Suzy

Suzy offers various solutions, including:
- Suzy Insights: Quantitative surveys, which is their flagship offering.
- Suzy Live: Qualitative insights, including multi-person focus groups, 1-on-1 interviews, and in-home product testing.
- Suzy Audiences: Iterative insights from the audiences that matter most to you.
- Suzy Speaks: AI-powered conversational surveys.
- Suzy Signals: Receive an email after each survey ends, which shows not just your results, but what to do next.
They also offer full-fledged managed services (geared for enterprise companies), which you can learn more about here.
10. SG Analytics

While SG Analytics offers a wide variety of solutions, in this section, we’ll focus specifically on their market research consulting offering.
They can help you with:
- Primary market research: Gain access to 4M+ B2B and B2C panelists across 75+ countries.
- Secondary market research: Their experienced researchers will analyze secondary data from internal and external sources.
- Quantitative market research with a focus on surveys.
- Qualitative market research: Focus groups, 1-on-1 interviews, etc.
They serve a wide variety of industries, including BFSI, Capital Market, TMT, and others.
Some of their market research solutions include market segmentation, product development, UAT studies, concept testing, competitor analysis, ad effectiveness, pricing strategy, customer satisfaction and experience, market entry strategies, brand awareness and positioning, and social and environmental studies.
11. Gartner

Gartner is a market research juggernaut that's best known for their market research literature and analyses across various technology sectors. Diving deeper, some of their key offerings include:
- Magic Quadrant™ Reports: Reports that shed light on 4 types of technology providers in fast growing markets: Leaders, Visionaries, Niche Players and Challengers.
- Hype Cycle™: Graphical representation of the maturity and adoption of emerging technologies, to help you identify how much risk is involved.
- And so much more: These are just some of Gartner’s more well-known offerings but they’re a powerhouse with a wealth of other market research information and use cases.
12. Forrester

Forrester is a market research powerhouse that offers consulting and provides data across multiple industries, with a particular focus on technology vendors.
Some of the key industries they serve include:
1. Technology
- Data
- Artificial Intelligence & Analytics
- Security & Risk
- Technology Architecture & Delivery
2. B2B
- Marketing
- Product
- Sales
3. Consumer
- Customer Experience
- Digital Business
- Marketing
13. IDC

IDC is a consulting firm that specializes in IT and tech research, with over 1,300 analysts worldwide in over 110 countries.
Some of the key industries they serve include:
- Energy
- Financial
- Government
- Health Manufacturing
- Retail
14. Drive Research

Drive Research is a full-service, boutique market research agency.
While you can explore their Services page for more details, here’s an overview of the key services they offer:
- Online surveys
- Customer surveys
- Employee surveys
- Qualitative recruiting
- Focus groups
- PR surveys
- Advanced analytics
Some of the key industries they serve include Consumer Goods, Financial Services, Higher Education, Manufacturing, Healthcare, Retail Travel and Tourism, and more.
15. Statista

Statista is a widely-known, massive data aggregator.
- They break down their insights into three categories:
- Market insights: Market forecast and KPIs for 1000+ markets in 190+ countries and territories.
- Consumer insights: Insights on consumer attitude and behavior based on 2,000,000+ interviews 15,000+ brands.
- eCommerce insights: Insights on 39,000+ online stores and marketplaces, with 70+ KPIs per store and revenue analytics and forecasts.
- Some of their more popular industry statistic categories are: consumer goods & FMCG, e-Commerce, economy & politics, energy & environment, internet, technology & telecommunications, transportation & logistics, and travel, tourism & hospitality.
- Statista also offers full-service market research, including target group analysis, pricing & product research, brand tracking, quick surveys, expert interviews, ad-hoc desk research, trend analysis, market sizes & forecasts, and other types of custom research.
16. IBISWorld

IBISWorld is best known for their wide range of industry research reports across 5,000+ industries. They were founded in 1971 and have 400+ employees in 6 offices globally: New York, Los Angeles, Melbourne, London, Frankfurt.
Some of their more popular industry report sectors include:
- Accommodation & Food Services
- Administration & Business Support Services
- Agriculture, Forestry, Fishing & Hunting
- Arts, Entertainment & Recreation
- Construction
- Educational Services
- Finance & Insurance
- Healthcare and Social Assistance
- Information Sector
- Manufacturing
- Mining
- Personal Services
- Professional, Scientific and Technical Service
- Public Administration & Safety
- Real Estate, Rental & Leasing
- Retail Trade
- Transportation and Warehousing
- Thematic Reports
- Utilities
- Wholesale Trade
17. MarketResearch.com

MarketResearch.com is best known for their extensive range of market research reports across various industries, including:
- Consumer Goods
- Food & Beverage
- Heavy Industry
- Service Industries
- Public Sector
- Life Sciences
- Technology & Media
- Marketing & Market Research
- Reports by Country
- Company Reports
18. Attest
Attest is best known for their survey platform capabilities, and you can browse their solutions by use case, including:
- Brand tracking
- Consumer profiling
- Market analysis
- New product development
- Multi-market research
- Creative testing
- Concept testing
- Campaign tracking
- Competitor analysis
- Quant & qual insights
- Seasonal research
19. Qualtrics
Qualtrics is best known for their survey platform capabilities. They’re well-suited for enterprise companies, and they categorize their features in 3 areas:
1. Customer Experience
- Voice of Customer
- Omnichannel Experience Management
- Digital Experience Analytics
- Website & App Feedback
- Location Experience Hub
- Online Reputation Management
- Contact Center Analytics
- Quality Management & Compliance
- Agent Coaching
- Edge Instant Insights
2. Employee Experience
- Employee Engagement
- Employee Pulse
- Employee Research
- Candidate Experience Management
- Employee Onboarding & Exit
- 360 Development Feedback
- Employee Retention Analytics
- Continuous Employee Listening
3. Strategy & Research
- Strategic Market Research
- Product Research
- Brand and Communication Research
- User Experience Research
- Edge Audiences
In addition to their DIY survey functionality, they also offer done-for-you market research services, which you can explore here.
20. Remesh

Remesh market research platform that has a unique offering:
- Participants can respond and vote on each other’s answers, and you can run online focus groups and surveys at scale, while receiving unique insights you might otherwise miss via traditional methods.
- Unique metrics like Percent Agree Scores give you more confidence in your insights.
- Automated data analysis tools save you time on manually reading verbatim responses, helping you create summaries and identify key themes in seconds.
- Bring your own audience or recruit on-platform: Remesh can supply you with high-quality, vetted participants, with an average sub-3% removal rate.
- Multiple service options: Beyond DIY research, Remesh also provides supported or fully managed services.
Interested in Learning More About Pollfish and Prodege?
We invite you to create a free Pollfish account (no credit card required) and/or book an introductory call.