
Time isn’t on your side. But Pollfish is.
The Pollfish platform prides itself on being one of the fastest ways to conduct research on the market today. However, our clients still want to know survey feasibility in real time—be it fast or slow.
That’s why we have always included a Feasibility feature to give an estimation of how long it will take for your survey to complete based upon your targeting criteria, and that’s why this month’s update to our Feasibility estimation tool is so exciting for our self-serve platform users.
We’ve added more variables that affect a survey’s completion time to our estimator to give you an even more accurate prediction of when you can expect your survey results.
Here’s what’s new:
1. More accurate metrics.
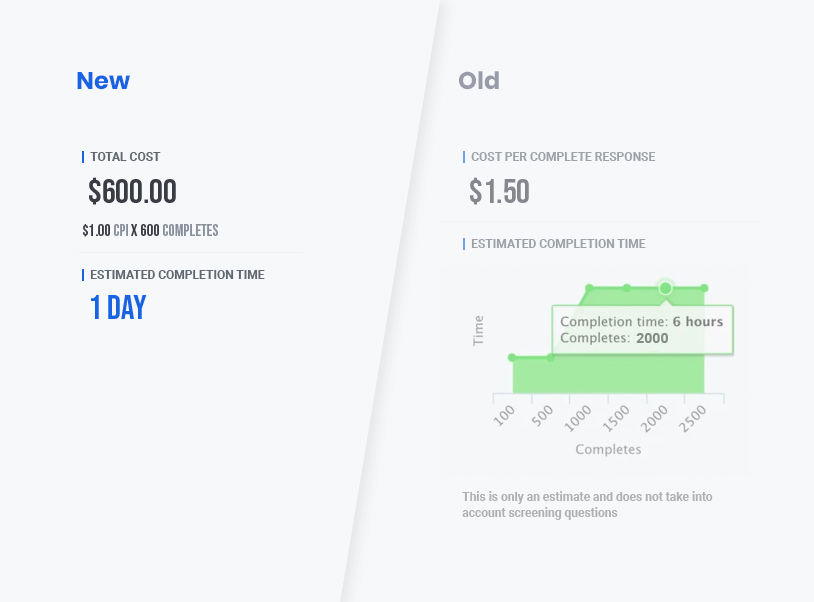
As a way to be transparent about our speed, our feasibility calculator used to showcase the mere hours it took us to complete many of our surveys. While we still set the record for survey speed, we have changed our units of measurement to “days” rather than “hours.” This allows a range of completion times that make our estimations more accurate.
Feasibility now displays a range anywhere between “1 day” up to “60 days” for a survey’s completion time. Many surveys will still only take a matter of hours to complete and will be shown as a 1-day estimate.
2. Clear Design.
If you’re familiar with the Pollfish platform, you may remember a range of completion times based on how many completes you may need for your survey. This gave a lot of information but was less clear for our users. So we moved the “Number of Completes” field to our Targeting page and made the calculation for one completion time based on the specific number of completes requested.
The calculator adjusts in real time to reflect pricing and feasibility, so any changes to the number of completes or targeting will automatically populate on the upper righthand corner.
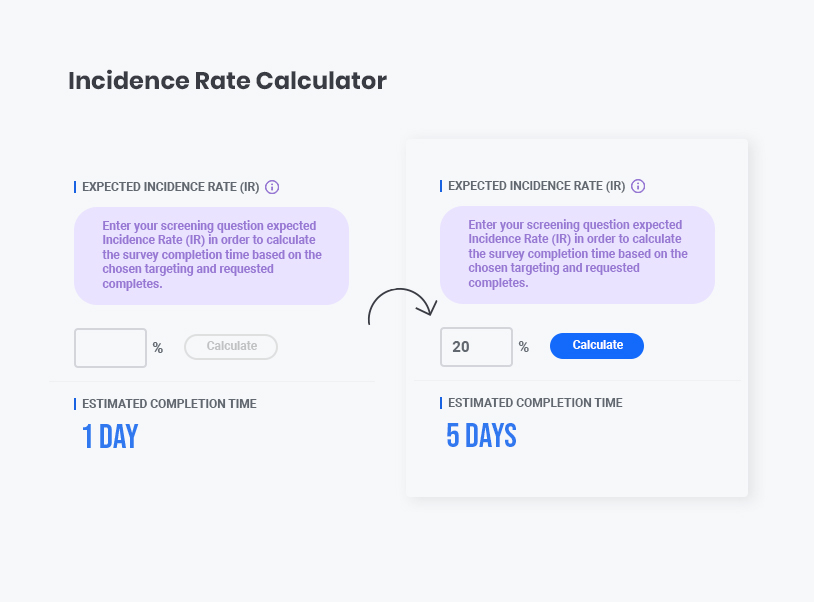
3. Incidence Rate in a Screening Question.
The star of this update is the newly added ability to estimate a survey’s completion time while factoring in the IR of their screening question. For people who have surveys where a screening question can limit their audience size, this is a significant capability in terms of understanding how long it will take them to reach their (very narrowly targeted) audience.
Once a screening question has been selected, the Incidence Rate calculator will automatically appear below the price and above the Feasibility estimator. Once an incidence rate is input and a quick calculation is made, the new number of days to completion is displayed.
This update means whether you’re scoping out a project roadmap, meeting a deadline with your custom survey findings, or simply communicating with your team or client on the status of a research project, you have the most accurate projection of how long it will take your survey to complete and the power to make the most informed decision possible.
Ready for a real estimation? Check out our 5-minute video to see it in action, or launch your own survey to get started.