
Americans Have Heart on Valentine’s Day | Poll Survey
Mobile is the new way to survey Americans
Survey stats: We surveyed 400 Americans in our Valentine’s Day poll survey about their plans for the holiday.
What we discovered: 68% plan on celebrating – for love of their partner or the holiday and additional 5% are looking for a date
Most surprising: Of those celebrating 80% plan on buying a gift – some extremely unusual; 57% plan their evening at home.
400 survey respondents (out of 662) reached had an opinion on Valentine’s Day.
- 21% are single
- 25% are in a relationship
- 44% are married
- 5% say “it’s complicated”
- 5% are divorced or widowed
Why are we so in love with Valentine’s Day?
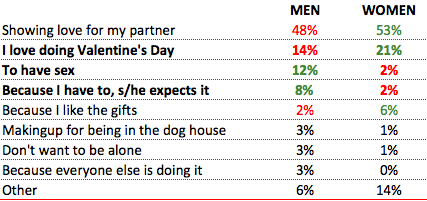
Here are the reasons why Americans choose to celebrate the day:
- 50% show love for their partner
- 17% “love doing Valentine’s Day”
- 7% say “to have sex”
- 5% because they “have to”; it’s expected by their partner
- 4% because they like the gifts
- 2% because they don’t want to be alone
- 2% because “everyone else is doing it”
- 2% to make up for “being in the dog house”
- 10% for other reasons
However, when we look at demographic questions, the break down by gender for the categories show some mixed feelings:
Where will you celebrate?
- 51% are celebrating at home
- 34% are headed to a nice restaurant
Or, at least we assumed “nice”. Full results from our poll website are available here.
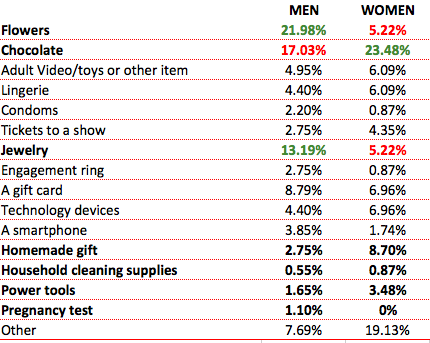
Gifts range from the usual, to the unique
Flowers, chocolate and jewelry dominate classic gifting…but
Cleaning supplies? Power Tools? Condoms? REALLY? – And it’s not just men who are splurging on these fine gifts, see below.
How much are they spending?
- 59% of women planned to spend $50 or less
- 62% of men planned to spend $50 or more.
Nearly 1/3rd aren’t celebrating Valentine’s Day. Why?
- 26% have no one to celebrate with
- 25% believe it’s a corporate holiday
- 12% are on a budget
- 12% have decided with their partner not to celebrate
- 5% “simply hate Valentine’s Day”
Full results here.
How would you describe Valentine’s Day?
- 25% “Love”
- 22% “Romantic”
- 16% “Commercial”
Valentine’s Day No-Nos
- 17% – Breaking up with your significant other
- 17% – Buying chocolate/flowers
- 13% – Proposing
- 13% – Planning nothing
- 13% – Forgetting
You just can’t keep everyone happy.
Mobile phones are the new way to survey to gain the opinions of Americans
We reached 662 Americans in just a few hours to survey 400 respondents.
Americans across all age groups rely on their cell phones as their primary means of communication (57%), and many have even switched to wireless-only (41%).
We also asked singles how they would find their date, and what they were looking for if they did – to find out what they had to say, and to customize the results views by question or answer, check out the results here.
To create your own survey and access over 185M consumers on the Pollfish mobile network, visit the website, http://www.pollfish.com. Each completed survey is just $1.