
How To Export Survey Data With Pollfish (And What To Do With It)
How To Export Survey Data With Pollfish (And What To Do With It)

It may sound like a cliche coming from a consumer data company, but data is powerful.
It is so powerful, in fact, that one single survey can touch every corner of an organization. By building smart questionnaires, carefully choosing targeting options and exporting and slicing data, brands can create internal messaging, build dynamic content, remake company strategy, build new products and much more.
To get the most out of your next survey, understanding your data export options is a great place to start.
What Are Export Options?
When you create a survey with Pollfish, you can download your results as four different report types. These reports present your data in radically different ways, and allow the various teams within your company to inject data into everything from interactive infographic to complex statistical analyses.
What Report Types Does Pollfish Offer?

What is a PDF?
PDF stands for Portable Document Format. A PDF is a file format developed by Adobe in the 1990s to present documents, including text formatting and images, in a manner independent of application software, hardware, and operating systems. Basically, instead of your document adopting the settings of the application you are saving the document to, PDFs stay true to how you saved them originally, similar to how a screenshot might behave.
What can I do with it?
The Pollfish PDF report offers a convenient, visually appealing document that can be shared with stakeholders, added to reports and saved as reference docs. The layout of the Pollfish PDF is similar to that of a PowerPoint presentation.
Excel Spreadsheet

What is an Excel Spreadsheet?
Microsoft’s spreadsheet platform should be instantly recognizable to anyone working in a modern business environment.
What can I do with it?
With an Excel spreadsheet export from Pollfish, you will have full access to all results from your Pollfish survey inside the data management platform you know best. Add pivot tables, graphs, use functions to get deeper insights--anything your Excel mastermind can dream up.
The report layout helps you access the right data more quickly, separating out the full list of respondents, as well as individual spreadsheets for each question, delivered in the familiar tab layout of Excel.
Lastly, once you have created your perfect data set, adding your data to Google Sheets allows you access to a great number of API and data delivery tools for use in websites, interactive infographics and more.
Crosstabs Report

What is a Crosstabs Report?
For a full guide to using your Crosstabs report, the Pollfish Resources Center can help. That article offers this definition:
Crosstabs are a matrix-style format for data visualization and are one of the most useful and common ways that market researchers analyze data. Pollfish offers cross tabs as an excel export for easy synthesis outside of the platform.
What can I do with it?
Crosstabs reports allow you to dig into individual insights and slice the data different ways, opening the door to different consumer insights that wouldn’t be readily available from the initial results.
For example, let’s say you conducted a survey of Android users interested in switching to an iPhone. With Crosstabs, you could see what percentage of women Android users surveyed were interested in switching. You could also see, of those interested in switching, what percentage were women.
So in our data, let’s say we find that only 13% of women Android users are interested in switching. We also find that, of those interested in switching, 58% are women. So while it may seem Android’s female fanbase is pretty loyal, you can also see that women are more open to switching in this survey than men.
As you can see, Crosstabs can be used to slice data in different directions to gain additional context on data, and build deeper, more compelling insights.
SPSS Report

What is an SPSS Report?
SPSS stands for Statistical Package for the Social Sciences. The acronym refers not to the type of data being exported, but to a set of software programs combined in a single package. When data is formatted for this package, it allows you to add your Pollfish results to various kinds of complex data analyses.
What can I do with it?
SPSS is very good at combining varied, complex data sets. Researchers use it to make connections, find correlations and quickly graph results from multiple data exports at once.
SPSS has several tools for analyzing data to make predictions and spot patterns, increasing it’s usefulness for brands and marketers looking for trends in buying behavior or trying to vet the viability of a new product or service.
How To Export Data With Pollfish
Step 1: Complete Your Survey
Once you have chosen your targeting, questionnaire and screening/quota configuration, checkout and run your survey. Once your results are complete, you will be able to export your data.
Step 2: Visit The Results Page
Even before exporting your data report, there is plenty you can do right on the Pollfish results dashboard. Check out the different features, slice your data by using the demographic and psychographic checkboxes to the left. Watch your results update as you go. Once you have gotten a few reports where you want them, check out the visualization options available on each question. These will allow you to instantly create graphs and charts to display your data one question at a time.
Step 3: Export Your Report
From your results dashboard, find the button marked Export Results in the top right corner underneath the Credits Counter. When you click this button, a pop-up should appear allowing you to choose your preferred report and download.
A Few Things To Remember…
-
- Post-Stratification data is not currently available in the PDF export format.
- Crosstabs reports come with multiple views, not just the one that appears in the first tab. Make sure you scroll through all tabs to see the different ways you can slice your data.

How To Use Consumer Surveys For Ad Effectiveness
How To Use Consumer Surveys For Ad Effectiveness

Ad effectiveness research is as old as advertising itself. If you have paid for an ad, you are going to want to know how effective it was. This can be as simple as a store owner counting foot traffic or sales.
But with digital advertising taking over the traditional advertising world ad effectiveness has become much more complicated, introducing new layers of interest, higher budgets and up-to-the-minute analytics.
What Is Ad Effectiveness Research?
Ad effectiveness research is a form of validation used to both build a baseline to compare to and ensure the efficacy of advertising efforts. Brands and agencies do this by testing things like brand recall, clarity of messaging, emotional response and more.
Since the advent of online advertising however, ad effectiveness research has become more complex. Ads can be tested in real-time, with ad platforms dynamically swapping headlines, messaging, calls-to-action and more based on performance.
Ad effectiveness research may also include testing different placements--where your ad appears--as well as different types of ad units. This will let the advertiser see which types of ads--banners, videos, site takeovers, search ads--work best to deliver campaign messaging.
Using consumer surveys for ad effectiveness is an essential part of any ad campaign, offering benchmarks, brand awareness, message efficacy and vital context to any metrics you may have collected.

How To Use Consumer Surveys In Ad Effectiveness Research
Whether you are running a traditional ad campaign--billboards, bus shelters, direct mail--or a completely digital effort, or even a combination of the two, consumer surveys help you dig deeper to find out not only how effective you were at delivering your message but what impact your message had on your most important consumers.
To use consumer surveys effectively, your testing strategy should follow a framework. We created such a framework below. Check it out to see how you can get started.
Create A Baseline
Consumer surveys can help you quickly get a baseline on just how recognizable your brand and products are today. Ad effectiveness is based on moving customers towards goals once they have seen your ads and seeing the impact.
You want to get a sense of not only if people have heard of your brand and what they think of it, but also if they have heard of your products, have opinions on current messaging and can give emotional feedback on their feelings towards you in the market.
In some cases, it may make sense to run the same survey both before and after exposure. You can do this either by running two separate surveys and using one as a control group or by using the first half of the survey to get blind perceptions or perceptions of old ads before exposing respondents to new ads. This test is more similar to creative testing than traditional ad effectiveness testing but works well for testing artwork, effective headlines and more.
Create A Tailored Audience
You have likely done your homework on the ideal target audience for your ads. Some consumer survey platforms will allow you to target just as effectively as your ad platform. So make sure your ad effectiveness survey matches your planned ad platform targeting.
Part of ad effectiveness testing is making sure your ads appeal to a broad range of consumers. This is especially important when advertising to very different geographic locations. Make sure you test your copy in different places to ensure you are communicating effectively, as there can be variations in meaning from place to place, even inside the same country.
Create An Appropriate Questionnaire
Before starting any ad effectiveness project, there are a few things you want to be sure your survey platform offers to ensure that you will be able to accomplish your survey goals.
- Make sure to use a survey platform that allows for unlimited image, audio and video file uploads so you are not limited by ad type.
- Avoid bias by shuffling answer choices, writing survey questions effectively and avoiding leading or loaded language.
- Use survey skip logic to test different kinds of consumers inside the same survey. For example, if you have different questions for users who have been exposed to your brand or your current ad campaign than for those who have not, survey skip logic allows you to bifurcate those users to different questions.
Once you have checked out these basic features, start building your questionnaire. Select your survey questions carefully, and make sure your questionnaire is built to achieve your goals.
For example, if your goal is to determine brand perception, use a mix of open and closed-ended questions so you can let people respond in their own words. If you are simply looking for which ad creative your targeted sample prefers, brief, direct, quantitative surveys will work well.
When to use an online ad effectiveness survey
Many agencies and brands make the mistake of either not using consumer surveys at all or not planning for testing as part of campaign planning.
As a result, if they do decide they want testing, its creation is often rushed, which can return results that are not as beneficial as they could be or fall outside the strategy of the campaign.
Including effectiveness testing in campaign planning will help ensure that any testing that is created is done with well-reasoned campaign goals in mind and will deliver the best possible insights, instead of a hurried request at the last minute.
As with targeting and questionnaire creation, campaign goals should determine when ad effectiveness testing should be launched. If you are testing for brand recall, you should allow a little time between exposure and testing to ensure that your brand message was “sticky.”
It should be noted however that because some survey platforms have dramatically improved lead times required for fielding a targeted sample, the days of needing 4 weeks' notice to set up testing are over.
It is wise, however, to discuss testing early, and make it part of the campaign instead of something tacked on to simply assuage the fears of marketers and clients.
Ways Of Testing Ad Effectiveness
Forced-Exposure Testing
Test creative for instant feedback on the campaign's image, video, or audio content without worrying about tracking barriers common with passive measurement. Compare results from the exposed group against a control group test to measure the impact on brand perception.
Pre/Post Study
Run a brand study among the target audience before the campaign launch to get a baseline of perceptions and the competitive landscape. Launch the same survey when the campaign ends to measure the impact on brand perception.
Matched Market Study
In a geo-targeted campaign, run a test in that market during the campaign as well as a "control" market where no media is running. Measure the differences between markets to understand the impact.
Survey Template For Ad Effectiveness
To help you get started, you can use the Pollfish Ad Effectiveness survey template. Make sure to keep the best practices for creating survey questions, respondent experience, and platform in mind when developing your questionnaire for the best results.

How Bustle Digital Group gained rapid audience insights during a crisis using Pollfish
How Bustle Digital Group Gained Rapid Audience Insights During a Crisis Using Pollfish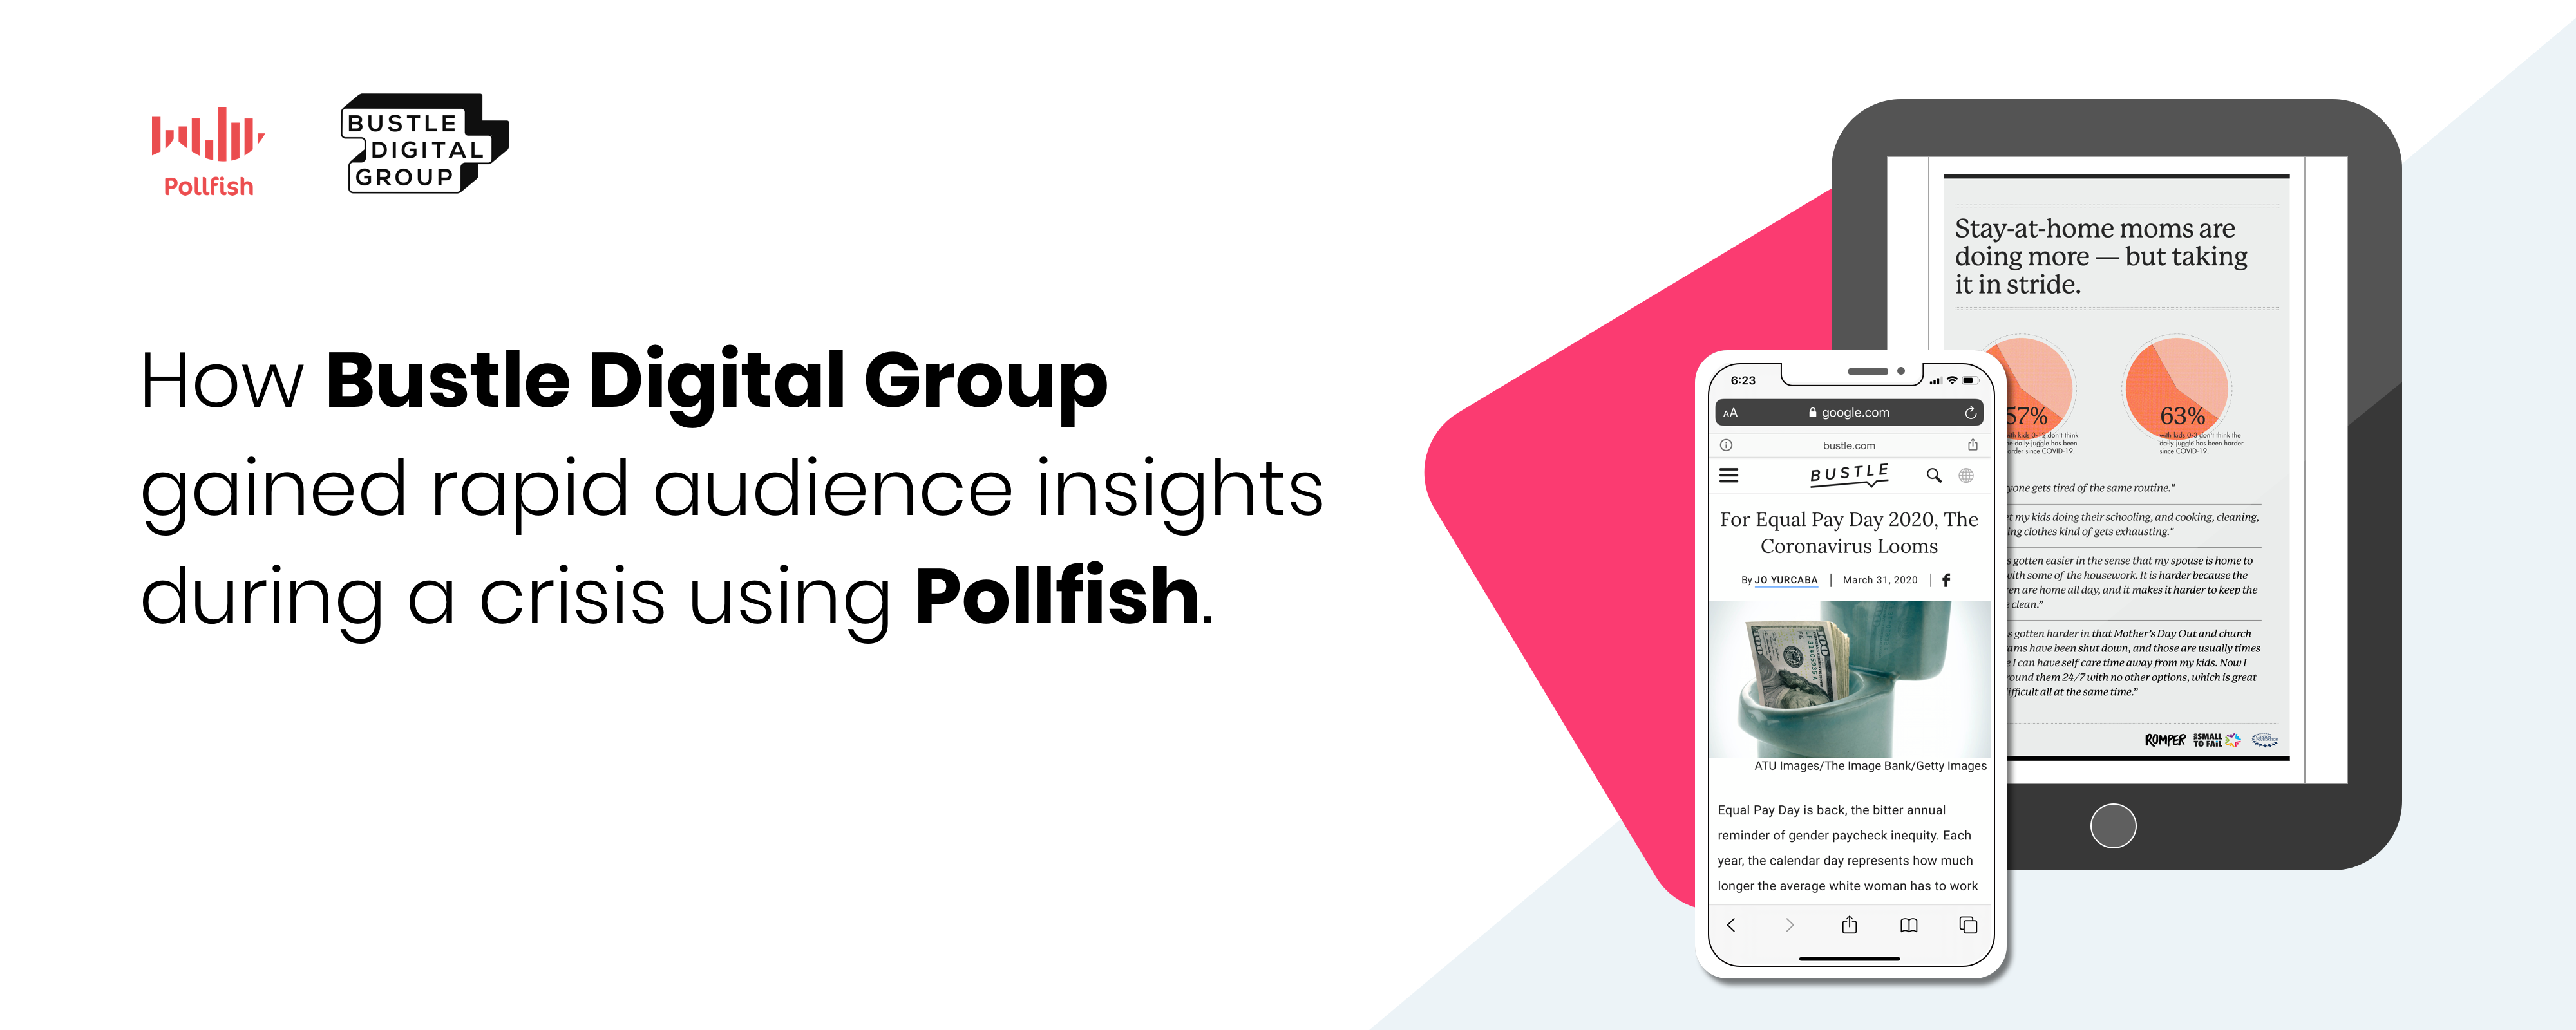
When a crisis hits, brand leaders must make hard choices.
How will their brand positioning, value proposition, feature set, and content evolve to meet the expectations, fears, and aspirations of a population gripped by doubt and uncertainty?
Leaders must make decisions quickly to both show leadership and keep progress moving forward at a critical time. But because jobs, revenue, and brand perception may be on the line, no leader takes these decisions lightly.
Now, imagine you have to meet this challenge for multiple content brands, across multiple platforms, reaching multiple audiences in multiple countries. And you need a decision right away.
That was the conundrum facing one of today’s leading global media companies, Bustle Digital Group. With a portfolio of distinct digital and experiential brands—Bustle, W, Elite Daily, Nylon, The Zoe Report, Romber, Inverse, Fatherly and more—BDG had to decide quickly how to respond to the COVID-19 pandemic, both as a parent company and as individual brands with individual audiences, voices, and topic areas.
Contents
- The Challenge
- The Decision
- The Solution
- The Results
The Challenge
![]()
When the COVID-19 crisis struck, businesses everywhere needed to understand what the impact would be on their offerings so they could make important decisions for managing the changing landscape. As a news source, Bustle Digital Group knew they wanted to shed light on the COVID-19 pandemic to their readers across their portfolio of sites. However, they were unsure how the crisis had affected their target audience and what impact that might have on their content consumption behavior or preferences for types of content consumed.
Bustle Digital Group also needed to consider its brand in the equation. As an unconventional media company, BDG knew that they didn’t want to offer the same hype and hysteria that other outlets were reporting on. Instead, they wanted to identify ways to contribute positive, helpful content and provide support to their readers through the crisis one-day-at-a-time.
With information about COVID-19 being updated constantly, BDG needed to gather data about the pandemic and its impact on the underrepresented groups that make up their brand audience. In order to produce timely and relevant pieces that cut through the noise and supported their readers in a time of need, they needed to gather insights almost instantly from hard-to-reach audiences across the US.
The Decision

Before creating content that was a fit for BDG brands, the insights team needed to connect with their target audience to understand what type of content they were consuming, what they wanted and needed during the crisis, and whether their behaviors and attitudes had changed because of COVID-19.
This meant connecting with a diverse, representative audience to reach the people the mainstream media wasn’t covering and learning what matters most to them.

“Being able to reach real people about real issues just feels like a more accurate depiction of who our audience actually is. Getting results fast from the right people has been a game changer. The project would not have been possible without Pollfish.”
— Dani Thibodeau, Associate Director, Research and Insights, Bustle Digital Group
BDG partnered with Pollfish—an in-house market research platform—to rapidly collect data that would bring the right balance of information (and distraction) to their readers during COVID-19.
By offering a single platform that includes audience selection and distribution, questionnaire building and an analytics dashboard, Pollfish offers a complete consumer survey creation experience that is easy for in-house teams to use quickly and efficiently.
The Solution

BDG’s insights team got to work. Because their target audience can be hard to reach and needs to reflect the readership of 8 media publications, they needed a network of Pollfish’s size, scale, and distribution to ensure that they would obtain a representative audience sample.
Using Pollfish’s targeting capabilities to access an audience of over 250M consumers via our parent company Prodege, BDG’s insights team was able to easily set quotas and select demographic information to define younger audiences, multiple ethnic groups, and a diverse range of socio-economic statuses across the United States.


BDG created and launched a survey to 2,000 respondents across every age group, race, and gender to learn more about how COVID-19 was affecting different groups of people throughout the US.
Within 3 days, they had their answers.
Using Pollfish, the insights team at Bustle Digital Group was able to gain data on the attitudes and behaviors of their primary audience demographic, as well as uncover unexpected findings and fears regarding COVID-19 that the editorial teams were able to use to create the right stories and content types for BDG’s readers.
The Results

Bustle Digital Group got the information they needed to make important decisions during COVID-19 instantly. The insights team used their findings to inform internal conversations across multiple departments and executives on where their readership was during the pandemic. They were able to generate reports for their advertising partners, offering data-backed updates that showed where the market was going and built confidence for these partnerships that Bustle Digital Group understood their audience.
By offering robust data from their target audience using Pollfish, the insights team at Bustle Digital Group was able to fuel 5 thought leadership projects for the BDG sales organization to share across channels and reassure their advertising sponsors that they were still connecting effectively with the audiences they intended to reach, as well as assisting Bustle’s business development team with data that could help them pitch new partners successfully.
With one Pollfish survey, the insights team gathered data to develop compelling, interesting content for readers across the Bustle Digital Group family of brands. They were able to create 3 editorial pieces for Mic and Bustle publications, garnering thousands of views of their original content.
Additional COVID-19 studies were completed with equal success, including another 2,000-person survey in collaboration with the Clinton Foundation that shed light on the plight of mothers in the pandemic. Romper, one of BDG’s brands that focuses on new mothers, was able to get results from a representative sample of their target audience in 4 days to quickly curate 7 different infographics and a long-form article, exposing the shift and impact the virus has had on mothers, families, and the expectations of different household roles. Authors at Romper were able to tell a complete story to their readers that although they are quarantined, they are not alone.

How To Create An Image Survey by adding Pictures, Audio and Video
How To Create An Image Survey by adding Pictures, Audio and Video
With Pollfish, you can add images, audio files and videos to any survey question. You can also add these file types to individual answer choices in single and multiple choice questions. The process to create an image survey is simple. See how it's done here.
Video Transcription
Hi, John from Pollfish here and today, I'm going to show you how you can add media files like images, audio clips and videos to your survey questions.
With Pollfish, you can add media files like images, audio clips and videos to your survey questions to add more context to answer choices.
You can add media to your survey in two ways: you can either add to the top of the survey on any survey question type, or you can add to individual answer choices on certain select question types.
Add Media To Any Survey Question
First, you want to select the survey that you want to add media to. Once there, you want to select your questionnaire menu to get started.
Once here, find your question menu and select Add Media To Question.
Remember, you can add media to the top of any survey question, between the question and the answer choices below. This will work on any survey question type.
First, you want to select the uploader. Once you have found your creative, you can insert it here.
Add Media To Individual Answer Choices
The second way to add media to your survey is to add media files to individual answer choices on certain supported question types.
If you look at your question type and you see the image file here, you can add media files to each individual answer choice. And you do that by selecting this icon.
Just like before, you'll see the uploader appear and then you'll select your creative.
Don't forget to check the previewer to make sure that it appears as you expect.
Add Usage Instructions To Your Image Survey
One last thing--make sure that when you add media to your survey questions, you add sufficient instructions for how the respondent is to use the media that you've added.
For example, if they need to watch the entire video in order to answer the question, make sure you let them know.
And that's it! If you enjoyed this content, please like and subscribe on YouTube or visit resources.pollfish.com for more helpful tips.

Add Advanced Skip Logic To Your Survey With Pollfish
Add Advanced Skip Logic To Your Survey With Pollfish
With Advanced Skip Logic, you can deliver different survey questions based on respondent answers. Unlike screening questions, you can include all respondents in your final survey results and simply reroute different types of respondents to different questions.
Advanced Skip Logic allows you to get a deeper level of understanding from consumers, reduce survey bias and more. And setup couldn't be easier. See the step-by-step tutorial below.
Video Transcription
Hi I'm Ally from the Pollfish marketing team and today, I'm going to introduce you to one of the most powerful features on the Pollfish platform--Advanced Skip Logic.
Skip logic allows you to redirect respondents towards different questions based on answers they've already given previously in the survey. This helps respondents to end up being served questions that are more relevant to them, it helps completion rates and it gets you better data.
This is super easy to set up and you can start by going to the Questionnaire portion of your Pollfish survey builder.
For the purpose of our example, you can see that I've already added questions to my survey. You'll need to have questions in order to add logic to them.
Getting Started
When you have a question you want to apply logic to, simply move over to the left-hand side, where you'll see your complete question menu. At the bottom, you have the option to apply logic.
There is also an icon for branching, which you'll notice on this toggle bar as well. Skip logic is sometimes called branching because it looks like a branch.
When we click on the branching icon, we can see the complete skip logic menu. This will also show us a preview of the survey questions, as well as a preview of the survey and our logic path.
The logic path shows us the flow that respondents are currently going to go to. Right now, this is a regular flow, following one question after the next where every respondent receives every question.
To make these questions more relevant, we're going to add skip logic.
My survey is addressing Netflix Original Series and asking respondents which show they liked best out of two different options.
If we want people who liked the show Ozark to only receive questions about Ozark, and we want the people who liked Stranger Things better to only receive questions about Stranger Things, we can apply skip logic to make this happen.
Adding Skip Logic
We'll start by adding a rule. This lets us choose one of the answer choices from question one and the action that we want the respondents to take.
Because the next question is about Ozark, we want respondents who choose Stranger Things to skip that question and go straight to questions about Stranger Things--in this case, question three.
Because None Of The Above is also one of our answer choices, we want people who did not really enjoy either of these shows to go straight to the end of the survey.
For question two, since we don't want respondents who are answering questions about Ozark to see the question about Stranger Things that would follow, we'll also have any answer from question two result in the respondents being sent to the end of the survey.
Review Your Logic Path
Now we can review this logic path and see what the respondents will be doing if they are presented the survey.
For question one, they have three different answer choices, all of which will take them to a new and more relevant survey path for the respondent.
And that's it! If you liked this content, please like and subscribe to our YouTube channel or visit the Pollfish Resource Center at resources.pollfish.com.

Add Age Ranges To Your Pollfish Survey
Add Age Ranges To Your Pollfish Survey
With Pollfish, you can target your survey to specific age ranges in three ways. First, you can select from our default age ranges. Second, you can create your own custom age range survey. And by using Quotas, you can select exactly how many respondents come from each age or age range.
See how it's done with this step-by-step tutorial.
Video Transcription
Hi, this is Ally from the Pollfish marketing team and today, we're going to learn how to set age range targeting in a Pollfish survey.
When a member of the Pollfish Audience Network first joins, they complete a basic profile of all their demographic information up front. We use this information to target your survey to the right audience, and saves you the trouble of having to ask questions such as how old they are later on in the process.
Default Age Ranges
When you first create your survey, you'll see your targeting page, complete with all of the ages that Pollfish supports already selected and grouped into default settings. It's easy to change these by clicking on the check boxes next to a grouping to remove it, or clicking back on it to add it back.
You can see your estimated audience distribution on the right-hand side updating in real time to show you the makeup of your audience.
Targeting Millennials and GenZ
Because we are mobile-first and COPPA compliant, we're able to target age ranges as young as 16 without violating any global privacy restrictions. This means we can reach audiences that are harder to reach such as GenZ or Millennials.
If you want to reach those specific cohorts, we'd recommend switching to specific age ranges. This is where you can create a custom age range survey by inputing the exact range of those audiences.
Since we know GenZ that we can target on Pollfish is between 16 and 23, and Millennials are between 24 and 39, we can set that exact audience group and see what the targeting looks like if we were to try to reach those groups right now with a survey.
Quotas
If you had a more balanced audience or a specific breakdown that you are looking for, we'd recommend you use quotas to create a more representative sample.
Quotas let you determine a specific number of completes for each group. Since we have 400 completes in this survey, we can adjust our audience to a 50/50 split with 200 completes in each group so we have an even number of millennials and GenZ. Or we can adjust this to different numbers, such as a 75/25 split if the group was different.
And that's it! If you liked this video, please like and subscribe to our YouTube channel or visit Pollfish Resource Center at resources.pollfish.com to learn more.

Add Team Members to Your Pollfish Survey Platform Account
Add Team Members to your Pollfish Survey Platform Account
With Pollfish, you can add up to 10 team members to any account at any subscription level. Adding new team members is easy and can be done with just a few clicks. Share survey results, create team folders and unify all surveys on one convenient dashboard. If you belong to multiple teams, easily jump between them right from the menu.
It is simple to add team members and we'll show you how with this step-by-step tutorial.
Video Transcription
Hi, John with Pollfish here and today, I'm going to show you how you can add up to 10 team members to your Pollfish account.
With Pollfish, you can add up to 10 team members to your free, pay-as-you-go account. We do this so you can try out the platform, show it off to your entire staff and really get a sense for how it might help your organization. So I'll show you how you can add your team members now.
Getting Started
Start by coming up here to the three-dots menu and finding team settings. Once there, you should see the My Teams section, which shows you all the teams that you've been added to. If you want to switch between teams, you can come up here to this toggle menu and switch over to any other teams you've been added to.
Scroll down a bit and you'll see the Team Information section. This is where you can add a team name, and an email that will act as the administrative email for this account.
Adding Team Members
The Team Members section is where you can see the owner of the team here and then a place where you can add team members. Click the plus sign to get started.
In this menu here, you will add any emails to your teammates here, and you'll select their admin roles. If you need to know the permissions for each admin role, you can see those here.
Once you've added all your teammates, click invite and they'll receive an email invitation to join your team.
And that's it! If you enjoyed this content today, please like and subscribe on YouTube or visit resources.pollfish.com for more helpful tips.

How Pollfish Post Stratification Enables Instant Survey Weighting
How Pollfish Post Stratification Enables Instant Survey Weighting
When researchers create a survey with Pollfish, the audience they build is often somewhat different from the actual population. In an effort to ensure that your survey population is as accurate as possible, Pollfish created Post Stratification.
Post-Stratification allows users to weight their survey results with the push of a button using local census data. With this video tutorial, Ally will show you how you can add survey weighting instantly.
Video Transcription
Hi, I'm Ally from Pollfish, and today I'm going to show you an amazingly easy-to-use feature that let's you weight your survey results to the census data for the region you've surveyed.
When you launch a general population survey, oftentimes the respondents who take the survey are not reflective or representative of the actual population. Pollfish's answer to this is Post-Stratification; an easy, one-click solution that lets you weight these results. Let's get started.
Select or Run Your Survey
You can see that I am on my dashboard and I am going to choose a survey I have already completed. This is because the Post-Stratification feature is available on the Results page of your survey. If you'd like to reach specific audiences, we recommend that you set this up using Quotas on the targeting page before launch.
Weight Your Survey Results
Once you reach your results page, you will see that the actual results are what populates from your survey.
When you click Post-Stratified under View Results on the lefthand side, you can see a second data set populate under your actual results, showing you the weighted information for gender and age for that area.
Census Data Availability
Post-Stratification is available in 32 countries including the US, the UK and the EU. The data comes from the census for each country, except in the case of the US, where the data will come from state-level census data.
Income census data is available in Post-Stratification for the US when the information is sufficient.
Exploring Census-Weighted Results
You can see that in my survey, I have launched this to the UK and the US--two countries supported by our Post-Stratification algorithm. And I can toggle between the two to see the census-weighted results for each one, or I can see an aggregate group that has been correctly weighted by applying post-stratification to both at once.
Export Options
I can export these results by choosing export results from the upper-righthand corner. Post-Stratification is not currently available on the PDF export format, but it will appear as a new column in Excel, Crosstabs or SPSS exports
And that's it! If you liked this content, please like and subscribe to our YouTube channel, or check out Pollfish resources at resources.pollfish.com for more great tips.
Your Ultimate Guide To Writing Amazing Survey & Poll Questions


Contents

Section 1: Set Your Data Goals
Section 2: Question Writing 101

Section 3: Respondent Experience

Section 4: Avoid Questionnaire Bias
Your Ultimate Guide To Writing Amazing Survey & Poll Questions
Whether it is your first time creating a survey on your own, or you are a seasoned research professional, one thing is for sure: if you can’t write good survey questions, you won’t get helpful consumer insights.
But just what is a “good” survey question anyway? In this guide, we break down the four key elements that you need to master in order to write better survey questions.
A “good” survey question is:
- One that achieves your survey and data goals.
- One that is clear and direct.
- One that carefully considers user experience.
- One that is free from bias.
Throughout this guide, we will show you the tactics you can use to make sure you are delivering quality survey questions. To help you along, we will also show you what not to do, so you can easily spot the difference between a good question and one that needs some work.
For example, let’s say we want to avoid bias. Which of these is the better choice?

[su_spoiler title=”Reveal Answer”] ![]() CORRECT!
CORRECT!
This is an example of a direct, straightforward question that has eliminated bias. Nice work![/su_spoiler]

[su_spoiler title=”Reveal Answer”] ![]() INCORRECT!
INCORRECT!
This is an example of Prestige Bias. By letting the respondent know that an authoritative source says smoking causes cancer, you are biasing the respondent to agree with the source.[/su_spoiler]
Try out these question quizzes at each section to test your knowledge as you go. Let’s get started.

Set (and Achieve) Your Survey Goals
Everyone wants to write good survey questions–they want to be clear, direct, engaging and get respondents excited about answering.
But these are not the most important reasons to take care when writing survey questions.
The reason is if you build a survey with the wrong questions or question types, you could get stuck with a bunch of data you can’t use.
That’s why it is important to set data goals in advance and tailor your survey to achieve those goals from the very beginning.
How To Set Survey Data Goals
On the surface, this may seem simple: just state what you want to learn from your respondents and go from there.
But different surveys deliver different types of data. So you need to know how you plan to use the data you get from your questions first.
For example, let’s say your goal with your survey data is to create a map so you can continuously survey consumers every month and map their responses over time.
For this to work, you will need to combine demographic data with raw numbers of respondents and their answers.
You also want to ensure that your questions are simple and not prone to shifts in understanding based on geographic location or time passing.
Knowing these data goals, which of these two questions would be better for your survey?

[su_spoiler title=”Reveal Answer”] ![]() INCORRECT!
INCORRECT!
By adding a specific type of summer location, you assume that your respondents go to the beach or have been recently enough to have a favorite activity there. This will bias your survey towards people that live closer to a beach. Also, by allowing an open-ended question at the end, you will make one answer choice unusable for your map.[/su_spoiler]

[su_spoiler title=”Reveal Answer”] ![]() CORRECT!
CORRECT!
By keeping responses general, you avoid bias towards one geographic area. And by having a fully quantitative survey but also including a “Something Else” answer choice, you don’t force your respondents to give an answer that doesn’t apply to them, while still ensuring you only get data you can use for your map.[/su_spoiler]
In order to discover the question types that may work best for your survey goals, check out this sample results page. Do an export of the data so you get a sense of what you will have to work with once your survey is completed.
Next, you’ll want to check with your stakeholders to ensure that you are aligned on the questions you want to get answered, how you want to use and ingest survey data and what you are hoping to be able to deliver at the end.
How To Ensure You Meet Your Goals
With Pollfish, you have 11 different question types to choose from. All of these question types deliver data slightly differently.
It’s also critical to deliver these questions in a structural order that makes sense to the respondent and reduces bias from their answers (more on that later).
Depending on your survey goals, you’ll want to choose these questions wisely to ensure you have a data set you can use.
The most important difference between survey question types is the difference between Quantitative and Qualitative research.
From Qualitative vs Quantitative survey questions
Quantitative research is about collecting information that can be expressed numerically. Researchers often use it to correlate data about specific demographics, such as Gen Z being more likely to focus on their finances than Millennials. Quantitative research is usually conducted through surveys or web analytics, often including large volumes of people to ensure trends are statistically representative.
Even when the survey audience is very large, quantitative research can be targeted towards a specific audience, usually determined by demographic information such as age, gender, geographic location.
Qualitative research focuses on personalized behavior, such as habits or motivations behind their decisions. This can be gathered through contextual inquiries or interviews to learn more about feelings, attitudes, and habits that are harder to quantify but offer important additional context to support statistical data.
When quantitative and qualitative research are paired, a complete set of data can be gathered about the target audience’s demographics, experience, attitudes, behaviors, wants and needs.
Based on this description, can you tell which is an example of a qualitative question type?

[su_spoiler title=”Reveal Answer”] ![]() INCORRECT!
INCORRECT!
Qualitative surveys don’t have set answer choices. Instead, they allow respondents to speak in their own words about experiences with your product or service.[/su_spoiler]

[su_spoiler title=”Reveal Answer”] ![]() CORRECT!
CORRECT!
Qualitative survey questions allow respondents to speak in their own words about your product or service without selecting from pre-selected answer choices. You can use these questions to gain a deeper understanding about your consumers and their feelings towards your product outside of what you’d normally ask them. Feel free to ask more broad questions and let them open up.[/su_spoiler]
But differences between quantitative and qualitative are not the only differences between question types. You can still gather a broader range of emotions from respondents without going to a fully qualitative survey.
Question types like matrix questions, where respondents can rank the importance of different product or service features can provide more quantifiable data while still giving a broader range of interest than a simple one-by-one ranking.
Lastly, some researchers choose to combine qualitative and quantitative research. By allowing an open-ended “other” field to single selection questions, for example, researchers collect quantifiable data, while still allowing the option for further context.
Based on your research goals, this added field can either provide needed context for deeper understanding of your audience, or create unnecessary noise that can’t be quantified and throw off the data set.
It all depends on you. So think it all the way through and have a plan in place before you begin creating your questionnaire.
Question Writing 101: Clear, Direct, Well-Tested
When writing anything, clear, direct communication should be the ultimate goal. You want to ensure that, regardless of any flowery language or interactive content features, the core of what you are trying to say is communicated loud and clear.
With survey questions, this becomes even more important.
Once you have selected your survey goals and you have a good idea of what kind of data you want to collect, the goal of your survey questionnaire is to get respondents to completely fill out your survey as accurately as possible.
Market research best practices show that it is best to let respondents decide if they want to finish your survey or not. With Pollfish, respondents can escape the survey at any time. Therefore, all responses are voluntary and of higher quality than if respondents were forced to finish the survey.
What that means for you as the researcher is you have to ensure that your questions don’t drive respondents away.
Don’t worry, Pollfish is here to help you with that. First of all, each questionnaire is reviewed by our research experts prior to launch. But you can help by following these three steps to survey question writing: be clear, be direct, and test on real people.
Be Clear
In order to get the types of answers you expect, you must ensure that your target audience will fully understand what you want from them.
What does that mean? Below are a few common mistakes researchers make when writing their first questionnaire.
Too Much Jargon
When writing for a niche audience, industry jargon can be a welcome addition. Things like common abbreviations and loaded terms help build rapport and allow you to establish a personal connection with your readers.
Not so in market research.
Imagine you are reading an article and you come to some jargon you don’t recognize. All it takes is a quick Google search and you have learned some new terminology.
But if you come to a survey question that contains an acronym or abbreviation you don’t recognize, not only will you feel like you can’t answer that question, you will feel like maybe you aren’t qualified to answer the rest of the survey. You may attempt to guess at the meaning, or escape the survey all together.
Even if your audience is screened to only be in your industry, don’t assume everyone uses the same terminology you do. Take care when using any kind of jargon, acronym or abbreviation in your survey questions.
Extra Explanation
Most survey question types are fairly self explanatory. If there are 5 answer choices and the instruction is “Select One”, there isn’t much room for interpretation there.
But when questions get more complicated, extra explanation is essential.
For complicated concepts or ideas that respondents may only have some ideas about, a “description” question type can be helpful in clarifying which part of the idea a respondent should focus on.
Matrix questions are one question type where you have to be careful of your labeling and explanation. Let’s take a look at two Matrix questions and see which is the most clear.

[su_spoiler title=”Reveal Answer”] ![]() INCORRECT!
INCORRECT!
How are your respondents supposed to know if 1 is good or bad? When you use matrix questions, ratings scales and any other rating or ranking question, be sure to label questions clearly.
[/su_spoiler]

[su_spoiler title=”Reveal Answer”] ![]() CORRECT!
CORRECT!
As you can see, everything here is labeled so it is very clear for each amenity what you are choosing when you select each answer. When you use matrix questions, labels are very important. From the row titles to the answer choices, make sure it is very clear what respondents are selecting.
[/su_spoiler]
Questions that contain media like images, audio files and videos also often require further explanation. Let’s take a look at the video questions below and see which is the most clear.

[su_spoiler title=”Reveal Answer”] ![]() CORRECT!
CORRECT!
With questions containing required media, it is always a good idea to give explicit instructions as to what to do with that media. Once you have done that, you want to be very specific with what you ask respondents to deliver. If your ask is too vague, you are likely to get a lot of short, unthoughtful responses.
[/su_spoiler]

[su_spoiler title=”Reveal Answer”] ![]() INCORRECT!
INCORRECT!
When you use Pollfish for video questions, respondents are required to watch the entire video before answering. Still, you want to be clear about what you want. If you want them to watch the entire video, say so. Also, be specific with what you want them to pay attention to. Otherwise, you are likely to get a lot of vague, unthoughtful responses.
[/su_spoiler]
If it is necessary to consume all media to understand the question being asked, make sure your instructions clearly state this. You can even include your media as a separate question.
Create non-leading questions
It can be tempting to write questions in a way that seems obvious to you, but survey questions should not follow the same patterns we have when speaking to each other.
Although plain language is advised, inserting your own opinions—even subtly— into the survey question can lead respondents to feeling more inclined to agree with the answer you want.
The second question remains neutral towards either show. Since the goal of your research is to uncover the most accurate data, you want to avoid pushing respondents towards one answer over another.
Make Answer Choices Clear & Distinct
Once you have made sure your questions and instructions are clear and direct, make sure your answer choices are distinct from one another.
One common reason respondents bounce from a survey is they cannot decide between two similar-seeming answer choices.
This can also reduce data quality because it may result in respondents offering answers they don’t really mean.
Although “yes” and “no” can seem like two distinct answer choices, these also don’t offer gradients within the answer options to appeal to respondents who don’t feel strongly or are unsure of an answer.
We recommend avoiding “yes/no” questions in favor of a Likert Scale or by writing answers out entirely to ensure less ambiguity and reduce bias.
Which of these questions seems correct?

[su_spoiler title=”Reveal Answer”] ![]() INCORRECT!
INCORRECT!
This question not only assumes the respondent drinks beer, but drinks beer enough to know the difference between these varieties. As a researcher, you don’t even know at this point if your respondent drinks at all. Answer choices need to be clearly distinct to all potential respondents, unless you have narrowly filtered your audience to ensure their knowledge.
[/su_spoiler]

[su_spoiler title=”Reveal Answer”] ![]() CORRECT!
CORRECT!
While this question is not as specific as it’s counterpart, it allows all possible respondents a chance to answer, while even making concessions for those who don’t drink at all. Once respondents answer here, you can get more specific (while ensuring the ability of respondents to participate) by using skip logic. Have the respondent answer and, for the ones who select beer, send them on to a question about which variety they prefer. That way, you can be more assured they will know the difference.
[/su_spoiler]
Be Direct
Good survey questions contain two parts: the question and the instructions.
For many Pollfish survey question types, some level of instruction is built in. But you want to be sure that when you deliver instructions, you are speaking directly, in clear, declarative statements.
Using too much passive language and indirect phrasing can create unnecessary confusion. Let’s take a look at the two examples below. Select which you think is the most direct.

[su_spoiler title=”Reveal Answer”] ![]() CORRECT!
CORRECT!
While these two questions may seem to say the same thing, using softer, more imprecise language opens up the potential for confusion. Using very direct, plain-spoken language removes any such ambiguity. Or to put it more simply, it makes questions (nearly) idiot-proof.[/su_spoiler]

[su_spoiler title=”Reveal Answer”] ![]() INCORRECT!
INCORRECT!
While these two questions may seem identical, the indirect language here leaves room for confusion. For example, who am I choosing for? Without a direct subject, I am left to wonder why I might be inclined to choose one flavor over another. Maybe when I buy ice cream, I only buy it for my husband because I am on a diet. If you want your respondent’s personal preference, ask for it, as clearly and directly as possible.
[/su_spoiler]
Always keep your Survey Goals in mind
As we learned in part 1, survey goals are at the core of all research projects. To make sure you’re writing the right survey questions to meet the right goals, consider the flow and structure of the survey and how the respondent will be presented with each question. Your goals may also dictate the type of question respondents should be given.
Example: Survey goal is brand awareness
 It’s best to begin a brand awareness survey with an open-ended question for respondents to recall brands that are top-of-mind, prior to being presented with a series of questions that might trigger their recall.
If the survey goal is press for a specific cereal brand, ranking questions can help uncover consumer preferences.
Ranking questions ask respondents to order answer choices, forcing them to choose one over another. These are best for establishing stronger opinions or validating a strong preference.
 The data from a ranking question could be “85% of consumers believe that Trix is the best children’s cereal”, providing a good headline for a research story.
Matrix questions allow respondents to apply a ranking scale towards each cereal, but don’t force them to choose one over another or compare them. These are a better question choice to measure other sentiments.
 The possible data to come from a matrix question could be that nearly ¾ of 90’s kids recall Frosted Flakes’ “Tony the Tiger”, however, the Cheerios bee has largely been forgotten.
Test On Real People
While it is important to align with all stakeholders internally on survey goals, you also want to test out your final questionnaire on some real people.
This can mean either sharing it with co-workers who are not familiar with the research project, or emailing your questions to a friend.
Getting outside help can be essential in identifying unclear directions that cause confusion for your respondents.

Respondent Experience: Think Like An App User
Because nearly everyone has an internet-enabled device with them at all times, survey companies have identified the opportunity to use this technology to reach respondents.
Unfortunately, not all surveys are created equal when it comes to offering a good respondent experience on mobile devices.
Poor respondent experience can have disastrous consequences, impacting your survey response and completion rates, and even impacting the data quality of your study.
So how can you follow best practices for mobile surveys?
Build on a Mobile-First platform
By using Pollfish, you are already off to a great start. That is because every Pollfish survey question type is optimized for mobile out of the box.
Our surveys are not only optimized to fit your mobile screen, they are delivered exclusively inside mobile apps, meaning each question type is designed by app developers to mirror the experience of an app.
Pollfish also provides a mobile previewer for each question in your survey, so you can test how your question will look on a phone in real time, right inside the questionnaire builder.
<Maybe add a screenshot of the questionnaire builder here?>
Shorten your questionnaire
Because so many users prefer to take surveys on mobile devices, it is important to think like a mobile user.
Think about your app usage–do you stay in one place on your phone for a long time, or do you jump quickly from place to place? Do you often have your phone open for hours or do you use your phone in quick bursts?
Mobile phone users want to move fast. They could be on the go. They could only have a few minutes to kill while waiting in line at the bank.
That’s why it is important, when you can, to keep surveys short.
Shorter surveys get faster results and ensure full engagement with your questions from start to finish.
Our survey experts review every survey before it is published as well, so they may recommend you shorten parts of your study if they feel respondent experience may be impacted.
Keep a mobile mindset
While all our survey questions will look great on mobile, there are a few things you can do to make your questionnaire more engaging to the mobile user.
Start by favoring question types that are easier to answer on mobile phones. Multiple-choice questions that users can tap, rather than open-ended questions where typing is required makes answering easier for users. Question types like rating stars and using video can keep users engaged and motivated throughout your survey.
Keep in mind that while many survey tools that offer a “mobile survey” experience also offer matrix questions, you’ll want to verify that these have been designed for mobile distribution.
Matrix questions in a typical survey present as a table where respondents are asked to rank a series of answers. In mobile, these don’t translate into a good experience for respondents.
Ensure that your mobile matrix question utilizes vertical scrolling and doesn’t require respondents to zoom in or drag the table horizontally to see all the answer possibilities.
While more qualitative questions may be helpful to provide more context and emotion to survey respondents, mobile respondents would rather tap or swipe than type.
If you were a mobile user, which of these would you prefer to answer?

Prevent Survey Bias
One of the most important parts of building the perfect survey is reducing survey bias.
From Your Ultimate Guide To Survey Bias
Put simply, survey bias impacts data quality. By eradicating survey bias (as best you can), you build trust in the data you’ve collected.
That’s no small thing, as companies across the world are using consumer insights data to inform everything from content creation to product timelines to strategic planning.
So how do you remove bias from your questionnaire?
Well, for starters, it is important to remember that preventing all survey bias is impossible.
That’s right. We are all biased. We have unconscious thoughts that cause us to subtly indicate our true feelings to those around us. And that applys to writing survey questions as well.
The key is to do everything you can to remove the most pernicious forms of bias from our surveys so we can ensure top-quality data.
With this section, I’ll take you through a few of the more common ways to avoid bias in your questionnaire.
Remove Double-barreled questions
Double-barrelled questions happen when researchers blend two questions into one, and then allow for only one answer. This creates a fallacy for the respondent and often results in incomplete or biased answers.
Can you tell which question is biased here?

[su_spoiler title=”Reveal Answer”] ![]() CORRECT!
CORRECT!
While this question may not appear to cover as much ground as it’s counterpart, the other question here doesn’t allow the respondent to choose different answers for the Pool and Bar. It is always better to split double-barreled questions into two separate questions to ensure specificity.[/su_spoiler]

[su_spoiler title=”Reveal Answer”] ![]() INCORRECT!
INCORRECT!
This question doesn’t allow respondents the ability to select different ratings for the pool and bar. Even if you consider the pool and bar to be the same, a respondent may not. Double-barreled questions provide incomplete answers. You’ll risk losing critical consumer insights. Make sure you split them in two.[/su_spoiler]
Avoid Assumptions
Depending on how you write a question, you could be assuming things of the respondent, or even forcing them to give an answer they don’t believe.
One way researchers fall into this trap is by asking loaded questions. Loaded questions make multiple assumptions about a person and then force them to answer a question based on those assumptions.
Can you spot the Loaded question?

[su_spoiler title=”Reveal Answer”] ![]() INCORRECT!
INCORRECT!
This question presupposes the respondent likes attending baseball games, because they have to fit the premise of the question in order to answer. Before you can ask this question, you must ensure your respondents like attending baseball games. You can do this by asking such a question and then adding skip logic so that only those who have previously attended baseball games will be shown this question.
[/su_spoiler]

[su_spoiler title=”Reveal Answer”] ![]() CORRECT!
CORRECT!
Before a respondent can answer a question about snack preferences at a ballpark, you have to first establish that your respondents attend or have attended baseball games. You can ask the above question and apply skip logic so only those who fit the premise of your intended question are shown it.[/su_spoiler]
Don’t Use Biased Language
Similar to Loaded questions, biased language (sometimes called Leading questions) pushes respondents towards one response or the other.
This removes the impartial nature of a survey and influences respondents, leading to poor data quality.
Can you spot the Leading question?

[su_spoiler title=”Reveal Answer”] ![]() INCORRECT!
INCORRECT!
The words “new” and “old” bias the respondent towards saying the newer design is easier to use. You need to ask questions from a neutral position and do your best to avoid biased language that lead respondents towards one answer or another.[/su_spoiler]

[su_spoiler title=”Reveal Answer”] ![]() CORRECT!
CORRECT!
By asking, simply and directly, which design is easier to use, without letting the respondent know which is newer or older, you ensure that you remove bias. By adding responses like Not Sure or No Difference, you open up the question to additional answer possibilities for a broader range of respondents.[/su_spoiler]
Do Your Best To Include All Available Choices
As a general rule, you want to avoid forcing respondents to give an answer they don’t really mean.
So when you are writing a closed-ended survey question with a finite answer pool, make sure you think hard about additional answer possibilities that may not come immediately to mind.
Once you have done that, there are two additional ways you can reduce bias on these kinds of questions.
The first is to add an open-ended “Other” field, where respondents can include any additional choice you may have forgotten. If there is enough consistency in responses, you may even be able to manually quantify the data. If not, you have still provided some much-needed context to the current answer choices.
If you want to stick with your closed-ended question type, you can make it clear in your instructions that respondents are to select the answer closest to what they think. This is imperfect and provides a tough-to-quantify variable to your data. But it also will keep respondent experience and completion rates up.